


 text in
  English (pdf)
 Article in xml format
 Article references
 Send this article by e-mail
 Cited by SciELO
  Cited by Google
  Similars in
SciELO
Similars in
SciELO  Similars in Google
 Permalink
Introduction
Helicobacter pylori infection is a public health problem because it affects more than half of the world’s population; it is transmitted orally-orally, gastric-orally, and fecal-orally through close or intrafamilial contact, although there are other possible routes1. Transmission is associated with low socioeconomic conditions, low educational level, overcrowding, poor hygiene practices, mother being infected with H. pylori, and intake of non-drinking water1,2. The prevalence of infection varies according to geographic region and ranges from 20% in middle- and high-income countries to more than 79% in low-income countries. The regions with the highest prevalence are Africa (79.1%), South America (63.4%), and Asia (54.7%), and those with the lowest prevalence are Oceania (24.4%), Western Europe (47%), and North America (37.1%)3.
H. pylori produces gastroduodenal diseases due to a multifactorial process involving factors of the microorganism, genetic and epidemiological characteristics of the host, and environmental or sociocultural factors1,4. In 80% of patients, the infection is chronic, persistent, and asymptomatic. The rest develop diseases such as peptic ulcer, gastric cancer (GC), and B-cell lymphoma of the mucosa-associated lymphoid tissue (MALT). In 1994, the International Agency for Research on Cancer (IARC) classified H. pylori as a grade I carcinogen5; furthermore, 89% of non-cardial GC is associated with bacterial infection6. According to the Global Cancer Observatory (GLOBOCAN) in 2020, GC ranked fifth in incidence (1,089,103) and third in mortality (768,793) worldwide, while in Colombia, it was fourth in incidence (8,214) and first in mortality (6,451)7.
GC mortality data in Colombia vary geographically; they are higher in mountainous regions than in coastal areas4,8. According to data from the National Administrative Department of Statistics (DANE, for its acronym in Spanish) for 2019 in Antioquia, mortality from GC shows differences by subregion. Of the 749 cases in the department (11.4/100,000 inhabitants), mortality was highest (114 deaths, 16.7/100,000) in the eastern mountainous subregion (1,900-2,600 meters above sea level [masl]; mean: 484 deaths, 12.2/100,000) and in the Valle de Aburrá metropolitan area (AMVA, for its acronym in Spanish) (1,150-1,700 masl) and low (30 deaths, 5.8/100,000) in the coastal subregion of Urabá (30-919 masl)9. These variations are explained by the genetic heterogeneity of the population, sociocultural diversity, and geographical differences8,10,11.
The regional prevalence of H. pylori is not systematically recorded, especially in low-income countries. Infection prevalence studies show variations in diagnostic methods, samples studied, selection criteria, age groups, and clinical conditions of patients, which hinders interpretation of the representativeness of the data in the general population3,12,13. In Colombia, regional prevalence studies cannot be extrapolated to the general population, and no consolidated data exists; however, the available figures estimate prevalences greater than 70%12,13.
GC prevention aims to identify high-risk populations and factors related to H. pylori because eliminating the infection reduces the risk of developing GC6,11,14. Previous studies show that these measures reduce the incidence of GC in high-risk populations11,14-16. In Colombia, GC is a disease with a poor prognosis and survival of <20% at five years17,18. Accordingly, this study aims to determine the relationship of H. pylori with clinical, epidemiological, environmental, and sociocultural characteristics in patients consulting and requiring endoscopic procedures from seven gastroenterology services in three subregions of Antioquia, Colombia.
Materials and methods
Study population and selection criteria
This analytical cross-sectional study was approved by the ethics committee of the Medicine School of the Universidad de Antioquia (Minutes 013-2016). The study population consisted of volunteers over 18 years of age treated in the upper digestive endoscopy (EGD) service of seven health institutions in three subregions of Antioquia: AMVA, Oriente, and Urabá, Colombia, between 2016 and 2018 who accepted and signed the consent. Patients treated with proton pump inhibitors (PPIs) 15 days before EGD, histamine H2 receptor antagonists 15 days before EGD, or antibiotics in the last month were excluded. We also excluded individuals with upper gastrointestinal bleeding, anticoagulant treatment, coagulation disorders, pregnant women, previous surgery of the upper digestive tract, diagnosis of severe chronic diseases (kidney, liver, decompensated heart failure, and decompensated diabetes mellitus), or radiochemotherapy.
Sample size
The sample size was calculated based on the number of patients treated in four months in the EGD services of the participating institutions (n = 4024 individuals). It was estimated using Epidat version 3.1 with a confidence interval (CI) of 95%, power of 80%, and accuracy of 5.8%. In total, 265 individuals were included, distributed as follows: 63.8% (n = 169) came from AMVA, 27.5% (n = 73) from Oriente, and 8.7% (n = 23) from Urabá.
Survey
Participants completed a structured survey supervised by previously trained project staff. The information included sociodemographic data, housing conditions, socioeconomic characteristics, lifestyle habits, and personal and family clinical history of gastroduodenal diseases.
Diagnosis of H. pylori
Patients were fasted for 7 hours before EGD, and nine stomach biopsies were taken for bacterial diagnosis. Five samples from each patient were intended for histopathological study; they were stored in tubes with 10% buffered formalin (Protokimica S. A. S.®) and transported to the cytology and pathological anatomy unit of Clínica Las Vegas for processing and reading. Two antrum samples and two body samples were placed in a Brucella broth transport medium with 20% glycerol and taken to the Medicine School of the Universidad de Antioquia laboratory for subsequent microbiological culture, detection of the urease enzyme, and study by molecular biology. The diagnosis of H. pylori infection was established as positive when at least two tests were positive.
Microbiological culture
An antrum sample and a body sample were plated on supplemented Brucella agar and incubated under microaerophilic conditions (5-10% oxygen [O2], 10% carbon dioxide [CO2], and 80%-90% humidity). Compatible colonies were identified down to species by biochemical and molecular tests. The negative cultures were followed for 15 days. Then, if they showed growth, identification and cryopreservation were carried out in Brucella broth with 20% glycerol; those in which no growth was observed were reported as negative. The isolates of H. pylori were cryopreserved in Brucella broth with glycerol.
Urease test
An antral biopsy was deposited in urea-based agar broth (BD and Company, Sparks, MD, United States) supplemented with urea (Carlo Erba Reagents S. A. S., Italy). The test was positive when an instantaneous color change from yellow to pink was noted. The initially negative samples were incubated in an aerobic atmosphere, 21% O2 at 37 °C for 2 hours to confirm the results. Subsequently, the antrum biopsy was placed in Brucella broth with glycerol and cryopreserved for molecular testing.
Histopathological and molecular diagnosis
The histopathological methodology was performed as previously described19. For molecular diagnosis, one antrum and one body sample were processed with the Dneasy blood & tissue kit (Qiagen, Hilden, Germany) according to the manufacturer’s recommendations. The concentration of genomic DNA was determined with NanoDropOne-2000 (Thermo Fisher Scientific, United States). The ureA and vacA genes (alleles s1, s2, m1, and m2) were amplified by a standard polymerase chain reaction (PCR) with previously described primers20-22. PCR was performed in a Multigene® thermal cycler (Labnet International, Inc. NJ, United States) using the strains of H. pylori ATCC 43504, NCTC 11637, NCTC 11638, the clinical strain 3062 as positive controls, and Escherichia coli ATCC 25922 as a negative control. Amplifiers were run on 1.5% agarose gels and developed with Hydragreen (Piscataway, NJ). The fragments were visualized with a transilluminator (Molecular Imager® Gel Doc™ XR System. BioRad Laboratories, Inc. Hercules, CA, United States). The 100 bp molecular weight marker (New England Biolabs, Inc.) was used to determine the amplicons’ size.
Statistical analysis
A Microsoft Office Access 2016 database was built and subjected to external quality control. Data were analyzed using SPSS version 25.0 (SPSS Armonk, NY, United States: IBM Corporation). Epidat version 4.2 and Stata Corp version 15 were used to obtain the continuous variables’ means ± standard deviation (SD); categorical variables are presented as frequencies and percentages. To identify the risk factors associated with the frequency of H. pylori, a bivariate analysis was performed with the chi-squared test (χ2). For the multivariate analysis, binomial regression was employed. Crude and adjusted prevalence ratios were estimated with 95% confidence intervals (95% CI). The variables with p <0.25 (Hosmer-Lemeshow criterion) were entered into the multivariate model, and a p-value <0.05 was accepted as statistically significant.
Results
Description of the study population
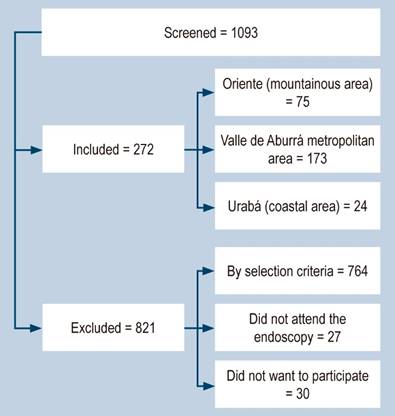
The total number of patients screened was 1093; 764 were not accepted due to the exclusion criteria and 57 for other reasons (Figura 1). A total of 272 participants were included, of which 271 were collected by EGD and one by gastrectomy.
Sociodemographic characteristics
65.1% (177) were women. The average age was 48.9 ± 15.6 years, and 45.3% (123) participants were between 36 and 55 years old. 95.6% (260) of the study population were mestizos, and 3.4% (12) called themselves Afro-Colombian, indigenous, and gypsy/ROM. Patients residing in Urabá had unfavorable socioeconomic characteristics compared to the other subregions. In Urabá, we found a higher proportion of people in the subsidized system (66.7%), low level of schooling (complete elementary or lower) (45.8%), a higher proportion of unemployment (8.3%), informal employment (29.2%), monthly income greater than or equal to a minimum wage (52.2%), and low socioeconomic status (87.4%) (Table 1).
Table 1 Sociodemographic characteristics of the population discriminated by subregion
| Variable | Subregion | |||||||
|---|---|---|---|---|---|---|---|---|
| Metropolitan area n = 173 | Oriente (mountainous) n = 75 | Urabá (coastal) n = 24 | Total n = 272 | |||||
| n | % | n | % | n | % | n | % | |
| Sex | ||||||||
| - Woman | 115 | 66.5 | 46 | 61.3 | 16 | 66.7 | 177 | 65.1 |
| - Man | 58 | 33.5 | 29 | 38.7 | 8 | 33.3 | 95 | 34.9 |
| Age | ||||||||
| - 18-25 | 14 | 8.1 | 5 | 6.7 | 1 | 4.2 | 20 | 7.4 |
| - 26-35 | 24 | 13.9 | 12 | 16.0 | 4 | 16.7 | 40 | 14.7 |
| - 36-45 | 35 | 20.2 | 17 | 22.7 | 5 | 20.8 | 57 | 21.0 |
| - 46-55 | 45 | 26.0 | 16 | 21.3 | 5 | 20.8 | 66 | 24.3 |
| - 56-65 | 32 | 18.5 | 13 | 17.3 | 5 | 20.8 | 50 | 18.4 |
| - 66-75 | 13 | 7.5 | 8 | 10.7 | 1 | 4.2 | 22 | 8.1 |
| - 76-86 | 10 | 5.8 | 4 | 5.3 | 3 | 12.5 | 17 | 6.3 |
| Social security | ||||||||
| - Contributory1 | 159 | 91.9 | 62 | 82.7 | 8 | 33.3 | 229 | 84.2 |
| - Subsidized2 | 11 | 6.4 | 11 | 14.7 | 16 | 66.7 | 38 | 14.0 |
| - Special3 | 2 | 1.2 | 1 | 1.3 | 0 | 0.0 | 3 | 1.1 |
| - No enrollment | 1 | 0.6 | 1 | 1.3 | 0 | 0.0 | 2 | 0.7 |
| Education | ||||||||
| - Elementary | 28 | 16.2 | 28 | 37.3 | 7 | 29.2 | 63 | 23.1 |
| - High school | 54 | 31.2 | 18 | 24.0 | 7 | 29.2 | 79 | 29.0 |
| - Associate degree | 25 | 14.4 | 13 | 17.3 | 2 | 8.3 | 40 | 14.7 |
| - College | 64 | 37.0 | 15 | 20.0 | 4 | 16.6 | 83 | 30.6 |
| - None | 2 | 1.2 | 1 | 1.3 | 4 | 16.7 | 7 | 2.6 |
| Occupation | ||||||||
| - Employee | 65 | 37.6 | 32 | 42.7 | 2 | 8.3 | 99 | 36.4 |
| - Homemaker | 44 | 25.4 | 19 | 25.3 | 8 | 33.3 | 71 | 26.1 |
| - Underemployed4 | 2 | 1.2 | 1 | 1.3 | 2 | 8.3 | 5 | 1.8 |
| - Informal worker5 | 4 | 2.3 | 5 | 6.7 | 7 | 29.2 | 16 | 5.9 |
| - Unemployed | 4 | 2.3 | 3 | 4.0 | 2 | 8.3 | 9 | 3.3 |
| - Self-employee6 | 20 | 11.6 | 7 | 9.3 | 3 | 12.5 | 30 | 11.0 |
| - Pensioner | 21 | 12.1 | 8 | 10.7 | 0 | 0.0 | 29 | 10.7 |
| Occupation | ||||||||
| - Student | 8 | 4.6 | 0 | 0.0 | 0 | 0.0 | 8 | 2.9 |
| - Inmate | 5 | 2.9 | 0 | 0.0 | 0 | 0.0 | 5 | 1.8 |
| Wage | ||||||||
| - Less than 1 SMLV | 12 | 7.2 | 18 | 24.0 | 12 | 52.2 | 42 | 15.8 |
| - 1-2 SMLV | 32 | 19.2 | 22 | 29.3 | 6 | 26.1 | 60 | 22.6 |
| - > 2 SMLV | 123 | 73.7 | 35 | 46.7 | 5 | 21.7 | 163 | 61.5 |
| Socioeconomic level7 | ||||||||
| - 1-2 | 58 | 34.6 | 28 | 37.8 | 21 | 87.4 | 107 | 40.2 |
| - 3-4 | 84 | 50.0 | 43 | 58.1 | 3 | 12.5 | 130 | 48.9 |
| - 5-6 | 26 | 15.5 | 3 | 4.1 | 0 | 0.0 | 29 | 10.9 |
1Contributory: enrolled in the health system through the payment of an individual or family contribution by the member or in conjunction with the employer. 2Subsidized: mechanism through which the poorest population in the country, with no ability to pay, has access to health services through a subsidy offered by the State. 3Special: people who belong to the military forces, police, teachers, and public servants. 4Underemployed: employment in which workers’ capabilities are underutilized; they work fewer hours and receive low remuneration. 5Informal worker: a person who carries out some economic activity with no employment contract, no tax control, low income, and no social protection. 6Self-employed: a person who works on their account without being bound by an employment contract and makes payments to the social security system by themselves. 7Socioeconomic levels: classes or groups into which the population is divided according to purchasing power and socioeconomic level (1 minimum wage equals 277.19 USD in 2021 in Colombia). SMLV: current legal minimum wage. Table prepared by the authors.
Housing characteristics, conditions, and living habits
84.2% (229/272) of the population lived in urban areas. The AMVA has the highest percentage with 93.6% (162/173), and the Oriente subregion concentrated the most significant number of individuals from rural areas with 28/75 (37.3%). Concerning utilities, 100% of the participants had electricity at home. Regarding access to aqueducts, differences were observed: of the participants, 9.5% (26/272) used untreated water for consumption (Table 2). Of the population, 1.5% (4/272) lived in overcrowded conditions, and as to lifestyles, 10.3% of patients (28/272) had a smoking habit. Of the latter, 21.4% (6/28) were heavy smokers (> 15 cigarettes/day), according to the classification of the World Health Organization (WHO)23.
Table 2 Housing characteristics and living habits of the studied population
| Variable | Subregion | |||||||
|---|---|---|---|---|---|---|---|---|
| Metropolitan area n = 173 | Oriente (mountainous) n = 75 | Urabá (coastal) n = 24 | Total n = 272 | |||||
| n | % | n | % | n | % | n | % | |
| Housing type | ||||||||
| - Home | 88 | 50.9 | 59 | 78.7 | 19 | 79.2 | 166 | 61.0 |
| - Apartment | 79 | 45.7 | 14 | 18.7 | 3 | 12.5 | 96 | 35.3 |
| - Room | 0 | 0.0 | 1 | 1.3 | 1 | 4.2 | 2 | 0.7 |
| - Other1 | 6 | 3.5 | 1 | 1.3 | 1 | 4.2 | 8 | 2.9 |
| Drinking water | ||||||||
| - Regulated aqueduct | 171 | 98.8 | 44 | 58.7 | 6 | 25.0 | 221 | 81.3 |
| - Unregulated aqueduct | ||||||||
| - Rural aqueduct | 2 | 1.2 | 12 | 16.0 | 0 | 0.0 | 14 | 5.1 |
| - Rainwater | 0 | 0.0 | 0 | 0.0 | 6 | 25.0 | 6 | 2.2 |
| - Tanker | 0 | 0.0 | 0 | 0.0 | 1 | 4.2 | 1 | 0.4 |
| - River or stream | 0 | 0.0 | 5 | 6.7 | 0 | 0.0 | 5 | 1.8 |
| - Other2 | 0 | 0.0 | 14 | 18.7 | 11 | 45.8 | 25 | 9.2 |
| Eating out (times a week) | ||||||||
| - 1-2 times | 53 | 54.6 | 26 | 72.2 | 6 | 50.0 | 85 | 58.6 |
| - 3-4 times | 16 | 16.5 | 3 | 8.3 | 5 | 41.7 | 24 | 16.6 |
| - > 5 times | 28 | 28.9 | 7 | 19.4 | 1 | 8.3 | 36 | 24.8 |
| Boils the water | ||||||||
| - Yes | 3 | 1.7 | 33 | 44.0 | 5 | 20.8 | 41 | 15.1 |
| - No | 4 | 2.3 | 26 | 34.7 | 10 | 41.7 | 40 | 14.7 |
| - Not applicable3 | 166 | 96.0 | 16 | 21.3 | 9 | 37.5 | 191 | 70.2 |
| Other aspects | ||||||||
| - Has gas | 159 | 91.9 | 67 | 89.3 | 19 | 79.2 | 245 | 90.1 |
| - Has sewer | 173 | 100 | 66 | 88.0 | 17 | 70.8 | 256 | 94.1 |
| - Has an aqueduct | 172 | 99.4 | 64 | 85.3 | 14 | 58.3 | 250 | 91.9 |
| - Overcrowding | 0 | 0.0 | 1 | 1.3 | 3 | 12.5 | 4 | 1.50 |
| - Current/Former smoker | 47 | 29.0 | 20 | 28.4 | 8 | 36.7 | 75 | 29.6 |
| - Drinks alcohol | 73 | 42.2 | 32 | 42.7 | 6 | 25.0 | 111 | 40.8 |
| - Daily coffee | 105 | 60.7 | 48 | 64.0 | 12 | 50.0 | 165 | 60.7 |
| - Adds salt | 36 | 20.8 | 18 | 24.0 | 4 | 16.7 | 58 | 21.3 |
1Other: halfway house, tenement, orphanage, nursing home, detention center. 2Other: well, bottled water, filtered water. 3Not applicable: for those who have an aqueduct and do not boil water. Table prepared by the authors.
Personal and family history
The most frequently reported symptoms were epigastric pain (61.8%) and abdominal distension (61%), and the least frequent were vomiting (17.3%) and hematemesis (5.9%). 50% of the patients had a history of gastroduodenal tract diseases; 80% reported previous episodes of gastritis, 19% peptic ulcer, 12% hiatal hernia, 10% esophagitis, 6% gastroesophageal reflux, and 1.5% GC. Other diagnoses (duodenitis, Barret’s esophagus, inverted esophagus, or pyloric hypertrophy) were present in 3% of cases. The percentage of patients with a history of iron deficiency anemia was 18.3% (50/272). Concerning family clinical history, it was found that the most common were gastritis (65.3%), H. pylori (30%), and GC (26%). Of the latter, 37.7% were relatives in the first degree of consanguinity (Table 3).
Table 3 Personal and family history of gastroduodenal diseases and diagnosis of H. pylori in the study population
| Variable | Región | |||||||
|---|---|---|---|---|---|---|---|---|
| Metropolitan area n = 173 | Oriente (mountainous) n = 75 | Urabá (coastal) n = 24 | Total n = 272 | |||||
| n | % | n | % | n | % | n | % | |
| Signs and symptoms | ||||||||
| - Epigastralgia | 107 | 61.8 | 40 | 53.3 | 21 | 87.5 | 168 | 61.8 |
| - Nausea | 76 | 43.9 | 25 | 33.3 | 15 | 62.5 | 116 | 42.6 |
| - Vomiting | 29 | 16.8 | 10 | 13.3 | 8 | 33.3 | 47 | 17.3 |
| - Dysphagia | 46 | 26.6 | 11 | 14.7 | 10 | 41.7 | 67 | 24.6 |
| - Feeling a lump | 64 | 37.0 | 19 | 25.3 | 13 | 54.2 | 96 | 35.3 |
| - Dyspepsia | 90 | 52.0 | 32 | 42.7 | 15 | 62.5 | 137 | 50.4 |
| - Belching | 81 | 46.8 | 41 | 54.7 | 14 | 58.3 | 136 | 50.0 |
| - Reflux | 94 | 54.3 | 42 | 56.0 | 16 | 66.7 | 152 | 55.9 |
| - Loss of appetite | 41 | 23.7 | 20 | 26.7 | 7 | 29.2 | 68 | 25.0 |
| - Weightloss | 39 | 22.5 | 15 | 20.0 | 12 | 50.0 | 66 | 24.3 |
| - Hematemesis | 9 | 5.2 | 6 | 8.0 | 1 | 4.20 | 16 | 5.9 |
| - Melenas | 35 | 20.2 | 11 | 14.7 | 8 | 33.3 | 54 | 19.9 |
| - Abdominal distension | 109 | 63.0 | 39 | 52.0 | 18 | 75.0 | 166 | 61.0 |
| Personal history | ||||||||
| - Diagnosis of previous gastroduodenal disease | 88 | 50.9 | 43 | 57.3 | 5 | 20.8 | 136 | 50.0 |
| - Previous endoscopy | 98 | 56.6 | 45 | 60.0 | 9 | 37.5 | 152 | 55.9 |
| -Previous H. pylori infection | 61 | 35.3 | 23 | 30.7 | 3 | 12.5 | 87 | 32.0 |
| - Received treatment | 55 | 88.7 | 20 | 83.3 | 2 | 66.7 | 77 | 86.5 |
| -Followed treatment instructions | 51 | 91.1 | 19 | 95.0 | 1 | 50.0 | 71 | 91.0 |
| - Diagnosis of anemia | 27 | 15.6 | 14 | 18.7 | 9 | 37.5 | 50 | 18.4 |
| Family background | ||||||||
| - Gastritis | 109 | 63.0 | 55 | 73.3 | 13 | 56.5 | 177 | 65.3 |
| - Gastric ulcer | 33 | 19.1 | 20 | 26.7 | 5 | 21.7 | 58 | 21.4 |
| - Intestinal metaplasia | 11 | 6.4 | 3 | 4.0 | 1 | 4.30 | 15 | 5.5 |
| - Stomach cancer | 45 | 26.0 | 23 | 31.5 | 2 | 8.70 | 70 | 26.0 |
| - History of H. pylori | 53 | 30.8 | 26 | 34.7 | 2 | 9.10 | 81 | 30.1 |
| Diagnosis of infection | ||||||||
| - H. pylori-positive | 94 | 54.3 | 48 | 64.0 | 19 | 79.2 | 161 | 59.2 |
| - H. pylori-negative | 79 | 45.7 | 27 | 36.0 | 5 | 20.8 | 120 | 40.8 |
Table prepared by the authors.
Diagnosis of H. pylori and factors associated with infection
54.3%, 64%, and 79.2% of the patients studied in the AMVA, Oriente, and Urabá subregions, respectively, had a positive diagnosis for H. pylori by at least two of the tests used (Table 3). Upon the bivariate analysis, we found that the frequency of H. pylori was higher in men, people between 18 and 55 years old, patients in the subsidized system, with a low educational level, underemployed or informal workers, with income less than 2 SMLV, from a low/middle socioeconomic level, without a home water supply, with signs of hematemesis, and in patients without treatment adherence (Table 4). The results of the multivariate analysis showed that the risk factors associated with H. pylori were male (p = 0.01), aged 18-35 years (p < 0.00) and 36-55 years (p = 0.01), not having a home water supply (p < 0.00), and having less than a college degree (p < 0.00) (Table 5).
Table 4 Factors associated with H. pylori by bivariate analysis
| Variable | n/N | (%) | CPR | 95% CI | p |
|---|---|---|---|---|---|
| Sex | |||||
| - Woman | 97/177 | 54.8 | 1 | - | 0.044 |
| - Man | 64/95 | 67.4 | 1.229 | 1.013-1.492 | |
| Age | |||||
| - 18-35 | 41/60 | 68.3 | 1.448 | 1.095-1.914 | 0.009 |
| - 36-55 | 78/123 | 63.4 | 1.343 | 1.038-1.738 | 0.025 |
| - 56-86 | 42/89 | 47 | 1 | - | |
| Social security | |||||
| - Contributory1 | 131/232 | 56.5 | 1 | 1.075-1.641 | 0.028 |
| - Subsidized2 | 30/40 | 75 | 1.328 | ||
| Education | |||||
| - Elementary | 45/70 | 64.3 | 1.482 | 1.096-2.003 | 0.011 |
| - High school | 52/79 | 65.8 | 1.517 | 1.132-2.033 | 0.005 |
| - Associate degree | 28/40 | 70.0 | 1.613 | 1.173-2.219 | 0.003 |
| - Incomplete or complete college degree | 36/83 | 43.4 | 1 | - | |
| Occupation | |||||
| - Employee | 61/99 | 61.6 | 1.069 | 0.817-1.398 | 0.625 |
| - Homemaker | 34/71 | 47.9 | 0.83 | 0.599-1.152 | 0.267 |
| - Underemployed3/Informal workers4 | 17/21 | 81.0 | 1.404 | 1.039-1.899 | 0.027 |
| - Pensioner/Self-employed5 | 34/59 | 57.6 | 1 | - | |
| - Unemployed/Student/Inmate | 15/22 | 68.1 | 1.183 | 0.825-1.695 | 0.92 |
| Wage | |||||
| - Less than 1 SMLV | 29/42 | 69.0 | 1.308 | 1.020-1.679 | 0.034 |
| - 1-2 SMLV | 41/60 | 68.3 | 1.295 | 1.033-1.622 | 0.024 |
| - More than 2 SMLV | 86/163 | 52.8 | 1 | - | |
| Socioeconomic level6 | |||||
| - Low (1-2) | 76/107 | 71.0 | 1.872 | 1.157-3.029 | 0.011 |
| - Middle (3-4) | 70/130 | 53.8 | 1.419 | 0.867-2.321 | 0.163 |
| - High (5-6) | 11/29 | 37.9 | 1 | - | |
| House location | |||||
| - Rural/Other7 | 33/43 | 76.7 | 1.373 | 1.123-1.678 | 0.011 |
| - Urban | 128/229 | 55.9 | 1 | - | |
| Aqueduct | |||||
| - Yes | 141/250 | 56.4 | 1 | - | 0.002 |
| - No | 20/22 | 90.9 | 1.612 | 1.358-1.913 | |
| Black stools | |||||
| - Yes | 40/54 | 74.1 | 1.335 | 1.095-1.626 | 0.013 |
| - No | 121/218 | 55.5 | 1 | - | |
| Diagnosis of gastric disease | |||||
| - Yes | 59/136 | 43.38 | 0.578 | 0.466-0.717 | < 0.001 |
| - No | 102/136 | 75 | 1 | - | |
| Previous endoscopy | |||||
| - Yes | 65/152 | 42.76 | 0.535 | 0.436-0.656 | < 0.001 |
| - No | 96/120 | 80 | 1 | - | |
| Previous diagnosis of H. pylori infection | |||||
| - Yes | 26/87 | 29.9 | 0.41 | 0.293-0.572 | < 0.001 |
| - No | 135/185 | 73.0 | 1 | - | |
| Followed the treatment indications for H. pylori | |||||
| - Yes | 18/71 | 25.4 | 1 | - | 0.021 |
| - No | 5/7 | 71.4 | 2.817 | 1.522-5.214 |
# 1 indicates the reference category. 1Contributory: enrolled in the health system through the payment of an individual or family contribution by the member or in conjunction with the employer. 2Subsidized: mechanism through which the poorest population in the country, with no ability to pay, has access to health services through a subsidy offered by the State. 3Underemployed: employment in which workers’ capabilities are underutilized; they work fewer hours and receive low remuneration. 4Informal worker: a person who carries out some economic activity with no employment contract, no tax control, low income, and no social protection. 5Self-employed: a person who works on their account without being bound by an employment contract and makes payments to the social security system by themselves. 6Socioeconomic levels: classes or groups into which the population is divided according to purchasing power and socioeconomic level (1 minimum wage equals 277.19 USD in 2021 in Colombia). 7Other: detention centers. SMLV: current legal minimum wage. Table prepared by the authors.
Table 5 Variables associated with the prevalence of H. pylori. Bivariate (CPR) and multivariate (adjusted PR) analysis
| Variable | CPR | 95% CI | p | APR | 95% CI | p |
| Male sex | 1.22 | 1.01-1.49 | 0.04 | 1.26 | 1.04-1.52 | 0.01 |
| Age (18-35 years) | 1.44 | 1.09-1.91 | 0.00 | 1.62 | 1.22-2.16 | 0.00 |
| Age (36-55 years) | 1.34 | 1.03-1.73 | 0.02 | 1.39 | 1.07-1.79 | 0.01 |
| No home water supply | 1.61 | 1.35-1.91 | 0.00 | 1.40 | 1.15-1.72 | 0.00 |
| Elementary | 1.48 | 1.09-2.00 | 0.01 | 1.60 | 1.17-2.19 | 0.00 |
| High school | 1.51 | 1.13-2.03 | 0.00 | 1.65 | 1.24-2.18 | 0.00 |
| Associate degree | 1.61 | 1.17-2.21 | 0.00 | 1.73 | 1.26-2.38 | 0.00 |
APR: adjusted prevalence ratio; CPR: crude prevalence ratio. Table prepared by the authors.
Discussion
This study found that the frequency of H. pylori in patients who attended the seven endoscopy services of the three subregions of Antioquia was 59.2%, with the following differences: 54.3% in AMVA, 64% in Oriente, and 79.2% in Urabá. A relationship was also identified between H. pylori infection and factors such as male sex, ages between 18 and 55, lack of a drinking water supply system, and less than college education.
When contrasting our findings with other studies from AMVA or Antioquia, we noted a higher frequency of H. pylori (59.2%) compared to that described by other authors such as Correa et al. in 2016 (36.4%)24, Roldan et al. in 2019 (44.2%)25, and Sánchez et al. in 2022 (36.4%)26. The higher frequency found in this study could be explained by including the sample of patients who attended the endoscopy services of two subregions of Antioquia other than the AMVA with less favorable socioeconomic conditions27,28. Another explanation for the high frequency is that the population captured included consulting patients and patients requiring endoscopic procedures who attended the seven institutions in the three subregions. Furthermore, the majority were patients with gastroduodenal symptoms. Notably, the findings in this study have limitations because it is impossible to calculate epidemiological information for the regions or draw conclusions that can be extrapolated to the general population.
In the Urabá subregion, 74.6% of the population has unmet basic needs, and 6.18% of individuals live in misery, exceeding the province’s 26.4% and 1.52%, respectively29. Besides, 14.3% of the population lacks basic utilities, and only 48.5% have drinking water28,29. In 2018, 89.8% of people in Antioquia had a home water supply, but in Urabá, only 68.9%30. The high prevalence of H. pylori infection in developing countries is associated with health problems and poor water quality, which is why it is suggested as a possible important source of transmission of the microorganism31. The bacteria survive in chlorinated water and tolerate pH changes. However, it is difficult to isolate from natural water sources, possibly due to the low bacterial load or difficulties in isolation and culture32.
Moreover, the low frequency of H. pylori in patients who attended the endoscopy services of the AMVA subregion is possibly due to better sanitary conditions such as access to quality drinking water, correct disposal of excreta and garbage, access to education, acceptable infrastructure conditions, among others33. However, as mentioned above, the findings in this study have limitations because it is impossible to calculate epidemiological information from the regions or draw conclusions that can be extrapolated to the general population. Some studies show that low socioeconomic and educational levels and lifestyles are risk factors for H. pylori34-38, suggesting that the high frequency of the bacteria reflects the need to improve the population’s living conditions by reducing exposure to risk factors and diseases associated with H. pylori.
A limitation of this work is the inability to determine the moment of primary infection, mainly because the pediatric population in which this entity occurs was not captured. Several studies demonstrate that primary infection is acquired during early childhood, and the main transmission occurs from person to person in the family environment39-46. Therefore, new research is necessary for the pediatric population in Antioquia to compare the findings with other studies in infants because it is not ruled out that the infection was acquired in childhood or adolescence, which is common in developing countries such as Colombia47-49.
The above reflects the importance of preventive measures in early childhood, such as screening and treatment when required to avoid progression in adulthood to diseases such as GC and peptic ulcer. Education for mothers and caregivers in early childhood is also essential to avoid infection and the spread of the bacteria to other individuals46.
The patients analyzed could have been exposed to other risk factors since childhood, different from those evaluated in our research. Considering this study’s cross-sectional design, risk factors and their long-term influence on developing preneoplastic lesions or serious diseases, such as GC, were not monitored.
This is the first research on H. pylori that includes populations other than AMVA and evaluates the frequency of H. pylori in patients who required digestive endoscopy in seven units in three subregions of Antioquia. An advantage of this study is that the patients belonged to different socioeconomic levels and healthcare systems. In addition, they were captured in seven endoscopy services in three subregions of Antioquia with more than 200,000 inhabitants, reflecting the heterogeneity in the province’s geographical, cultural, environmental, and socioeconomic characteristics.
Finally, the study was conducted in Antioquia, a province located northwest of the country with a coastal region (Urabá), where mortality from GC is less common. In contrast, the medium and high mountain regions (AMVA and Oriente) have more deaths from GC9. These figures contrast the differences in the frequencies found in this study concerning H. pylori. While it had already been described as “the enigma of the Andes” in the south of the country, it had not been evaluated in populations with many inhabitants or the coastal area of Antioquia4,50,51.
Conclusion
The frequency of H. pylori found in patients who required and were taken to digestive endoscopy (symptomatic or by screening) in seven endoscopy units in three subregions of Antioquia was greater than 50%, with substantial differences between them. The variables related to the highest frequency of infection were male sex, age between 18 and 55 years, an educational level less than college, and individuals without a home water supply. The above suggests the need to implement programs to improve the population’s living conditions, such as access to drinking water supply systems, and continue with the detection of H. pylori and the associated risk factors, which could influence the reduction of gastroduodenal diseases associated with the bacteria. Likewise, it is necessary to direct primary prevention measures against infection, especially in family groups, to impact the transmission dynamics of the bacteria. Lastly, it should be taken into account that the findings in this study have limitations because it is not possible to calculate epidemiological information from the regions or draw conclusions that can be extrapolated to the general population.

