


Services on Demand
Journal
Article
 English (pdf)
 Article in xml format
 Article references
 Send this article by e-mail
Indicators
-
 Cited by SciELO
 -
 Access statistics
Related links
-
 Cited by Google
 -
 Similars in
SciELO
Similars in
SciELO -
 Similars in Google
Share

 Permalink
Agronomía Colombiana
Print version ISSN 0120-9965
Agron. colomb. vol.29 no.1 Bogotá Jan./Apr. 2011
Evaluation of models for estimating the reference evapotranspiration in Colombian Coffee Zone
Evaluación de modelos para calcular la evapotranspiración de referencia en la zona cafetera de Colombia
Víctor Hugo Ramírez1,3, Alexandra Mejía2, Elsa Viviana Marín2, and Rafael Arango2
1 Researcher in Phytotechnics, Coffe National Research Center (Cenicafe). Chinchina (Caldas, Colombia).
2 Students, Agricultural Sciences Faculty, Universidad Santa Rosa de Cabal (Unisarc). Santa Rosa de Cabal (Risaralda, Colombia).
3 Corresponding author: victor.ramirez@cafedecolombia.com
Received for publication: 3 February, 2010. Accepted for publication: 2 February, 2011.
ABSTRACT
The reference evapotranspiration (ETo) is an important variable for hydrological studies, crop water requirements estimations, climatic zonification and water resources management. The FAO recommends the Penman-Monteith (P-M) and/or the Hargreaves models as the worldwide useful for the ETo calculation. The objective of this work was to test the performance of these models in one place of the Colombian Coffee Belt, and identify limitations and proposes modifications. The ETo calculation were compared with daily lysimeter measurements. The principal disadvantages of the P-M model were: the lack of calibrated coefficient for the long wave radiation estimation (Rnl) which affected seriously the net radiation estimation and finally the ETo, highly sensitivity at the wind speed changes, that make it inappropriate for locations without this data. The Hargreaves model, as FAO proposed, overestimate the ETo, which made necessary a modification. The ETo estimation for this location was most sensible to atmospheric vapour and air temperature than the available energy in the atmosphere (Rn-G).
Key words: evapotranspiration, atmospheric humidity, radiation, temperature. Penman-Monteith , Hargreaves, Garcia and Lopez, lysimeter.
RESUMEN
La evapotranspiración de referencia (ETo) es una variable de importancia en los estudios hidrológicos, en la estimación de los requerimientos de agua de los cultivos, en la zonificación climática y el manejo de los recursos hídricos. La FAO recomienda los modelos Penman-Monteith (P-M) y/o Hargreaves como los de mayor acogida mundial para calcular la ETo. Este trabajo evaluó el desempeño de estos modelos en una locación de la Zona Cafetera colombiana a fin de identificar sus limitantes y proponer modificaciones. El cálculo de la ETo se comparó diariamente con las lecturas del lisímetro. Las desventajas más notables del modelo P-M fueron: la falta de un coeficiente calibrado para la estimación de la radiación de onda larga (Rnl), lo cual afectó seriamente la medición de la radiación neta y, como consecuencia la ETo, que es altamente sensible a los cambios de velocidad del viento, lo que lo hace inapropiado para usarlo en locaciones en donde no se dispone de tales datos. Como lo propone la FAO, el modelo Hargreaves sobre-estima la ETo lo que hace necesario implementar una modificación. El cálculo de la ETo para la locación estudiada es más sensible al vapor atmosférico y a la temperatura del aire que a la energía disponible en la atmósfera (Rn-G).
Palabras clave: evapotranspiración, humedad atmosférica, radiación, temperatura, Penman-Monteith , Hargreaves, García and López, lisímetro.
Introduction
The appropriate estimation of evapotranspiration (ET) is necessary for the crop water requirement calculation, for climatic characterization and in the scheduling and management of the water resources (Ramirez and Harmsen, 2011). At the biological level, the knowing the ET helps to understand the magnitude of the gas interchanges between the eco and agro ecosystems with the atmosphere.
The calculation of the crop water requirement need an appropriate selection of method or model for the estimation. The direct measuring can be done with field lysimeters, which measure mass balance variables like rainfall, percolation, runoff and soil moisture changes and by default estimate the crop water requirement or the ET (Malone et al. 1999; Howell, 2004), also the ET estimation can be done using micrometeorological measurements, which are base on the energy balance equation, or methods based on gradients of air temperature and moisture, or the eddy covariance technique (Meyer and Baldocchi, 2005). All these direct methods in practice present some difficulties to be use, basically by his high cost of acquisition and keeping.
The United Nations Food and Agriculture Organization (FAO) recommend the method known like "the two steps" for the crop evapotranspiration (ETc) estimation. This method is useful for condition without limitation of water and pest (Allen et al., 1998; Doorembos and Pruitt, 1977). The "two steps" method consist in the estimation of the reference evapotranspiration (ETo) times the crop coefficient (Kc) which should be estimated in field using mass balance, energy balance, temperature and humidity gradient or eddy covariance methods. The FAO approach is very usefully because is possible make water requirement estimation by phenological phases or discriminate water uses by crops, using common meteorological information that is the most available in our media.
At global level the use of the FAO approach has increasing the knowledge of the crop water uses, the knowledge of the water consumes of the different land covers, the precision of the climate and hydrological studies. At agronomical level, the FAO approach is very useful in the estimation of the available water in the root zone, all this indicate a need a good estimates of the reference evapotranspiration (ETo). The first step in the appropriated ETo estimation is the local validation or calibration of the ETo models (Allen et al., 1998). In countries like Colombia, where the studies that measure directly the crop evapotrasnpiration (ETc) are scarce, the FAO approach in an important alternative.
Few are the studies that evaluate the ET models in Colombia. In the case of the Colombian coffee zone, can be mentioned the Jaramillo (1977) and Jaramillo (1989) studies that compared the class A pan evaporation with equations base on weather information. Subsequently Jaramillo (2006) calculated the ETo variation with altitude in several locations of the Colombian Andes discriminating the Cauca and Magdalena river watershed, in that study he compare the relationship between the ETo estimated by the Penman-Monteith (P-M) model and the class A pan evaporation.
Giraldo et al. (2008) compared several ETo methods in the North of Santander coffee zone (Francisco Romero station), in that work they compare the reference P-M model with the Turc, Linagre, Hargreaves, Jensen-Haise and Garcia and Lopez modified by Jaramillo, indicating not statistical differences between the Garcia and Lopez modified by Jaramillo and the reference Penman-Monteith model. In that study they do not include direct measures with lysimeter or other micrometeorological methods.
Barco et al. (2000), made an a macro scale estimation of the evaporation in Colombia, using several methods like the Turc, Morton, Penman, Holdridge and Budyko, in that study they made an quantitative and qualitative analysis of these models, but do not include a comparison with direct field measures.
The reference P-M model is the most useful method because include most climate variables that other models, and specially because include in his calculation the effect of the several factor in the ET like the energy availability (Rn-G), de water vapor pressure deficit (VPD) and the wind speed. The precision of the ETo estimation by the P-M model, depends of the data quality. For the specific case of the Colombia coffee zone, exist a potential limitation for the ETo estimation using the P-M model, because some direct meteorological measurement are not available, like the net radiation (Rn), soil heat fluxes (G), wind speed at 2 m level, and vapor pressure deficit (VPD). In the specific case of the Rn and G, we use empirical relations base on sunshine measurements. Similar situation has been reported by other author in other locations (Yoder et al., 2005; Liu et al. 2009).
The FAO-56 paper recommends the P-M model when is possible use the solar radiation, wind speed, temperature and air humidity information, or when the empirical models for the solar radiation has been previously calibrated, and then recommends the Hargreaves model when only exist air temperature information (maximum and minimum). For these reason our objectives were evaluate the FAO recommended models for the reference evapotranspiration (ETo) with the Garcia and Lopez modified model and direct field measuring with lysimeter.
Materials and methods
Location
This study was conducted in the Campus of the University of Santa Rosa de Cabal (Risaralda-Colombia), placed in the west slope of the Cauca river watershed at 04° 55' North, 75° 38' West, at 1.600 m.a.s.l. The climate characteristics during the research period are listed in the Tab. 1. The dominant soils are derivate for volcanic ash, classifieds as Andisols (Suarez, 1998), the main characteristics of this soils are: depth of the A horizon higher than 20 cm, high levels of organic matter, lower content of exchangeable bases, acid, with high infiltrations rates and high water retention capacity. The dominant crops in this area are the coffee and grass.

The Penman-Monteith model
For this study we use the P-M model for the ETo estimation recommended by the FAO-56 paper (Allen et al., 1998) and standardized by the American Society of the Civil Engineers-ASCE (Allen et al., 2005). The model calculations were based at daily level for a reference crop with 0.12 m height:
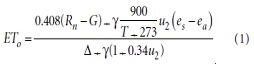
Where Rn is the net radiation (MJ m-2 día-1), G is the soil heat fluxes (MJ m-2 día-1) calculated as 0.1 of the Rn, g is the psychometric constant (kPa °C-1), es is the saturated vapor pressure, ea is the actual vapor pressure (kPa), D is the slope of the vapor pressure curve (kPa °C-1), u2 is the wind speed at 2 m, T is the air temperature (°C) at 2 m level. For this study the ea, es, D y g were calculated how is describe by the FAO-56 paper (Allen et al., 1998). The mean air temperature was calculated using the average between the maximum and minimum.
The net radiation (Rn) was calculated using the equation for solar radiation budget as follow:
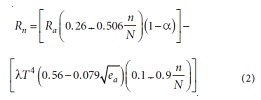
Where Ra is the astronomic solar radiation (MJ m-2 d-1) and calculated following the model presented by Allen et al. (1998); n is the sunshine (h) measure by the heliograph, N is the astronomic sunshine (h), λT4 is the Stefan-Boltzman constant (W m-2), ea is the actual vapor pressure (mb). The a and b values are the Ángstrom-Prescott coefficients, we use a=0.26 and b=0.56 calculated by Gómez and Guzmán (1995) for the central coffee zone, α is the albedo we use 0.23 for wet grass used for the reference conditions.
The solar radiation budget used in this study is different at the recommend by FAO-56 paper, due that we use the Ángstrom-Prescott model for the calculation.
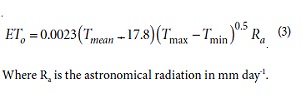
The Hargreaves model
When some of the climate information for the P-M model estimation is not available, the FAO-56 paper (Allen et al., 1998) recommend the Hargreaves model:
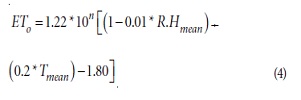
Modified model of Garcia and Lopez García and López (1970) proposing a model for the reference evapotranspiration calculation in Venezuela, that was later modified by Jaramillo (1977) for the conditions of the central coffee zone (with elevation between 1.000-2.000 m), this model use the mean air temperature (Tmean, °C) and the mean relative humidity (R.Hmean, %) at daily level:
The lysimeter
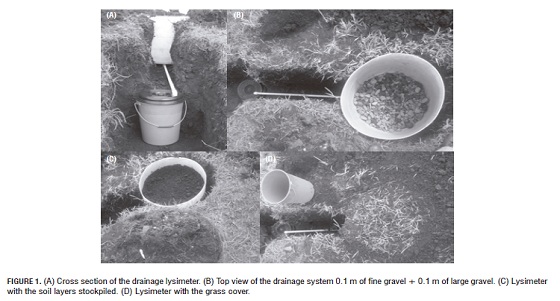
We used in this study a drainage type lysimeter, with 0.255 m2 of collecting area and 0.60 m of depth. For the lysimeter installation, the soil was excavated at 0.70 m depth, removing the soil in three layers with the aim to reduce the soil disruption by the excavation. One polyethylene container was placed in the hole with the installation to collect the drainage water. The drainage system was composed by 0.1 m of fine gravel and 0.1 m of large gravel, the system for the drainage water conduction was connected in the bottom of the lysimeter with a PVC tube connection to other small collector tank of 12 L of capacity. Above the drainage system the soil was stockpiled in two layer of 0.10 m each one in the inverse order of excavation, and then a grass layer was installed (Fig.1). The lysimeter was installed at side at weather station. Once installed the grass cover, after the lysimeter installation we leave during fifteen for the grass installation inside and outside of the lysimeter.
The field capacity of the soil was 0,81 cm3 cm-3, the wilting point 0,48 cm3 cm-3, the bulk density 0,7 g cm-3, and the available water at 30 cm of 46.2 mm.
Before start the evapotranspiration reading we applied irrigation at the lysimeter at field capacity to reduce the influence of the soil moisture changes in the water balance calculation, the irrigation was applied the day before to allow the free drainage. The ETo estimates were made daily after the lysimeter reached the field capacity. Days without rain fall we applied a known irrigation.
The ETo calculation was made as follow:
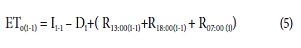
Where ETo(i-1): is the reference ET for the previous day in mm d-1; Ii-1 is the irrigation applied in the previous day (mm), Di is the drainage in the day i (mm), R13:00(i-1)+R18:00(i-1) are the rainfall measured at the previous day at 13:00 and 18:00 hours, and R07:00 (i) is the rainfall measured at the day i at the 07:00 hours that correspond at the night rainfall at the previous day. The lysimeter had a small trench 0,1 m wide and 0.15 m depth to prevent the entry of the runoff from the adjacent area (Fig.1)
Measurement of meteorological variables
Since September 2008 to September 2009, the meteorological information was recorded as follow. The minimum temperature was measure in an alcohol thermometer, the maximum temperature in a mercury thermometer with strangulation, the relative humidity was measure in a thermo-hygrograph with bi metallic sensor and hair bundle for the air temperature and humidity respectively, these instruments were placed inside of a shelter at 2-m height of the ground. The sunshine was measure in a heliograph type Campbell Stokes. The rainfall was measured three time per day (07:00-13:00 and 17:00 hours) using a rain gage with 200 cm2 of collecting area and a pluviograph type Hellman. All the instruments were placed at side of the lysimeter area following the specification of the World Meteorological Organization (WMO), and the weather station was operated by the National Coffee Research Center (Cenicafé-Colombia).
Test for the reference conditions
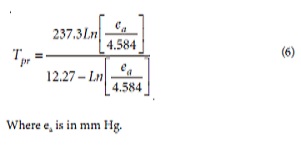
According with the FAO-56 paper (Allen et al. 2008), the references equations for the ETo computing is base on requirements that weather data be measured in environmental conditions that correspond to the definition of reference evapotranspiration, that means that the weather variables are measure above extensive grass cover crop that is actively evaporating with constant leaf area, surface resistance and height, or in an environment with healthy vegetation not short of water, this mean that do no exist additional energy source for evaporation. Allen (1996) proposed the difference between the minimum temperature and the dew point temperature to evaluate the reference conditions. If the difference is higher than +3°C, is not considered as a «reference» day (Jia et al., 2005). The dew point temperature was computing using the Tetens equation as follow:
Data analysis
For the models comparison, we used the hypothesis test with a T-student as a statistical test and a linear regression analysis especially the slope of the line to identify sub estimation of overestimation, similarly how was used in similar studies by Kjelgaard et al. (1994); Rana et al. (1997); Alves and Pereira, (2000); Prenger et al. (2002); Ortega-Farias et al. (2004), Ortega-Farias et al. (2006).
Results and discussion
During the measured time, the differences between the minimum air temperature and dew point temperature was negative, indicating that all measurements were under references conditions (Allen et al., 1998), with difference up to 11°C.
ETo methods comparison
For wet tropical Andean zone like the include in this study, the Penman-Monteith (P-M) model without wind conditions and the Garcia and Lopez Modified, showing similar ETo values that those measured in the lysimeter (Tab. 2). The Hargreaves model how is recommended by the FAO-56 paper (equation 3), overestimated the ETo values respect to the Lysimeter and the Garcia and Lopez Modified. Similar results were reported in the coffee zone of Brazil by Souza et al. (2003), respect to the Hargreaves model.
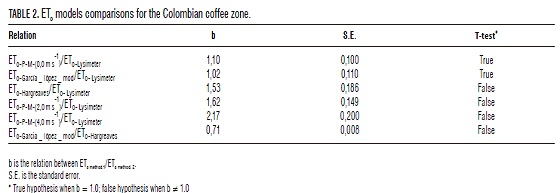
When increasing the wind speed in the P-M model the ETo is overestimated (Tab. 2). This situation is associated at the fact that in this study the wind speed was not measured. As general term at meteorological level, when the wind speed increase the vapor pressure deficit increase and the air temperature decrease, increasing the ETo rates. For these reason, is not recommended assume an arbitrary value for the wind speed when this in not measured because the ETo is overestimated.
By other hand, the results indicating that the model of the Garcia and Lopez modified by Jaramillo is appropriated for the ETo estimations without wind conditions.
How the initial Hargreaves model overestimated the ETo values respect to the lysimeter measures and the P-M model without wind (Tab. 2), we propose a modification at the Hargreaves model as follow:
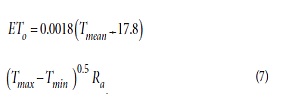
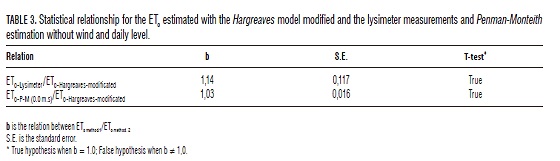
Once the Hargreaves model was modified (equation 7) we do not observed statistical differences between modified model and the lysimeter measures and the P-M model without wind (Tab. 3), how the results indicate modification was appropriated for the local conditions.
Restrictions for the Penman-Monteith model application in the Colombian Coffee zone.
The P-M model is highly susceptible at the wind speed changes. In general, most of the weather stations installed in the Colombian coffee zone, do not measure the wind speed and directions at 2-m height, for this reason is not appropriated the ETo calculation with the P-M model if the wind speed at 2-m height is not measured.
Only the central Colombian coffee zone has the Ángstrom- Prescott coefficients adjusted used in the equation 2 for the net solar radiation estimation base on sunshine readings, and is necessary derivative these coefficients for other locations for get more precise the calculations.
When we compared the solar radiation estimation using the Ángstrom-Prescott relations using the FAO-56 coefficients and those derivative by Gómez y Guzmán (1995), the difference in the estimation is low with a mean error of 0,53 MJ m-2 d-1, equal to 0,22 mm d-1 indicating that the difference in the estimation is in the long wave radiation estimation, as is described as follow.
How the difference in the short radiation is low, we analysed the long wave radiation using two models (equations 8 and 9).
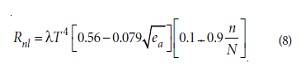
The long wave radiation model used for cloudy locations using sunshine readings is the Penman model (equation 8) and, the FAO-56 recommended model for the ETo estimating
is presented in the equation 9.
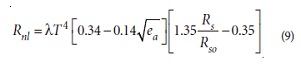
Where Rso is the solar radiation for clear sky conditions (equation 10), Rs is the solar radiation using the Ángstrom- Prescott model first part of the equation 2.
The altitude is in meters and Ra is the astronomical radiation.
When compared the ETo estimating with the long wave radiation models from the equations 7 and 8, we can see that the long wave radiation model proposed by FAO-56 overestimate the net radiation up to 2,5 MJ m-2 d-1 (Figure 2a) and also the ETO (Fig. 2b), with difference in the estimation up to 0,9 mm d-1; similar results were reported in China by Liu et al. (2009), who used uncalibrated FAO-56 coefficients for the radiation model, reporting variations between â3% to 15% un the daily ETo calculation. For these reason is necessary to conduct more field research for the Colombian coffee zone that permit the development of the appropriated coefficients for the long wave radiation estimation and increase the precision of the ETo calculation.
Faccioli et al. (2003) compared the ETo calculations using the FAO-56 model for net radiation using sunshine readings and direct solar radiation measurements in the Brazilian Coffee zone of Vicosa-Mina Gerais, and they finding that under cloud conditions the ETo was over estimated with the FAO-56 model.
Conclusions
The Garcia and Lopez Modified model and the Hargreaves Modified model area usefully for the ETo estimation for Colombian Coffee zone without wind or when only the air temperature and relative humidity data are available.
The use of sunshine data in the Angstrom-Prescott solar radiation model can be use in the net radiation estimation for the ETo estimation in the P-M model, the potential source of variability of the estimation could be direct related with the long wave radiation stimation that affect the pression of the net radiation calculation (Rn) and clearly the ETo estimation.
Is necessary conduct studies that permit the long wave radiation coefficients estimation (Rnl) in the Colombian coffee zone with the aim to make more precise the ETo estimation from the P-M model. Also, is necessary study the short wave radiation coefficient for other location of the Colombian coffee zone, especially in that zone were presumably the relationship Ra/Rg differs substantially from those estimated by Gómez and Guzmán (1995).
Acknowledgments
To the UNISARC for provide support for this research, specilly greatfully at the people of the Agroclimatology discipline from Cenicafé for provide meteorological information necessary in this study, and the anonimous evaluators for help in the improvement of this paper.
Literature cited
Allen, G.R., ; I.A. Walter, R.L. ; Elliot, T.A. ; Howell.; D. Itenfizu, M.E.; Jensen and R.L Snyder. 2005. The ASCE standarized reference evapotranspiration equation. Comittee of standarization of reference evapotranspiration of the enviromental and Water Resources Institute of the American Society of Civil Engineers. [ Links ]
Allen, G.R., S.L. Pereira, D. Raes and M. Smith. 1998. Crop evapotranspiration: Guidelines for computing crop water requirements. Food and Agricultural Organization of the United Nations (FAO). Publication No. 56. Rome. 300 p. [ Links ]
Allen, R.G. 1996. Assessing integrity of weather data for reference evapotranspiration estimation. Journal of Irrigation and Drainage Engineering 122(2), 97-106. [ Links ]
Alves, L. and L.S. Pereira. 2000. Modeling surface resistance from climatic variables? Agric. Water Manage. 42:371-385. [ Links ]
Barco, J., A. Cuartas, O. Mesa, G. Poveda, I.J. Velez, R. Mantilla, A. Hoyos, F.J. Mejia, B. Botero and M. Montoya. 2000. Estimación de la evaporación en Colombia. Avances Recursos Hidráulicos 7, 43-51. [ Links ]
Doorembos, J. and W.O. Pruitt. 1977. Guidelines for predicting crop water requirements. Food and Agricultural Oeganization of the United Nations (FAO). Publication No 24. Rome.300p. [ Links ]
Faccioli, G.G., L.O.C. Souza, A.S. Mudrik and E.C. Mantovani. 2003. Efeito do balanco do radiacao utilizando rediacao medida e estimada por numero de horas de brilho solar na estimativa da evapotranspiracao de referencia pelo metodo de Penman- -Monteith. pp. 560-568. Em: II simpósio de Pesquisa dos cafés do Brazil. Viçosa, MG. [ Links ]
Garcia, B.J. and D.J. Lopez. 1970. Fórmula para el cálculo de la evapotranspiración potencial adaptado al trópico. Agronomía Tropical 20(5), 335-345. [ Links ]
Giraldo, J.A., L.A. Lince, A.F. Cuartas y H. Gonzalez. 2008. Evaluación de fórmulas empíricas para el cálculo de la evapotranspiración potencial. Fitotecnia 141, 2. [ Links ]
Gómez, G.L. y M.O. Guzmán. 1995. Relación empírica entre la radiación global y el brillo solar en el área de Cenicafé, Chinchiná, Caldas. Cenicafé 46(4), 205-218. [ Links ]
Howell, T.A. 2004. Lysimetry. pp. 379-386. En: Hillel, D. (ed.). Encyclopedia of Soils in the Environment. Elsevier Press, Oxford, UK. [ Links ]
Jaramillo, R. A. 1977. Comparación entre la evapotranspiración registrada en tanque y la calculada por diferentes fórmulas. Cenicafé 28(2), 67-72. [ Links ]
Jaramillo, R. A. 1989. Relación entre la evaporación y los elementos climáticos. Cenicafé 40(3), 67-72. [ Links ]
Jaramillo, R. A. 2006. Evapotranspiración de referencia en la región andina de Colombia. Cenicafé 57(4), 288-298. [ Links ]
Jia, X., E.C. Martin and D.C. Slack. 2005.Temperature adjustment for reference evapotranspiration calculation in Central Arizona. Journal of Irrigation and Drainage Engineering 130(5), 384-390. [ Links ]
Kjelgaard, J.K., C.O. Stockle., J.M. Villar Mir., R.G., Evans and G.S. Campbell. 1994. Evaluation methods to estimate corn evapotranspiration from short-time interval weather data. Trans. ASAE. 37(6), 1825-1833. [ Links ]
Liu, X.; X. Mei, Y. Li, Q. Wang, Y. Zhang and J.R. Porter. 2009. Variation in reference evapotranspiration caused by Ángstrom- Prescott coefficient: Locally calibrated versus the FAO recommended. Agricultural Water Management 96(7), 1137-1145. [ Links ]
Malone, R.W., D.J. Stewardson, J.V. Bonta y T. Nelsen. 1999. Calibration and quality control of the coshocton weighing lysimeters. Transction of ASAE 42(3), 701-712. [ Links ]
Meyers, P.T. and D.D. Baldocchi. 2005. Current micrometeorological flux methodologies with applications in agriculture. pp. 381- 396. In: Micrometeorology in Agricultural Systems. Agronomy Monogaph No. 47. American Society of Agronomy, Crop Science Society of America, Soil Science Society of America, Madison (W., USA). [ Links ]
Ortega-Farias, S.O., A. Olioso, R. Antonioletti and N. Brisson. 2004. Evaluation of the Penman- Monteith model for estimatig soybean evapotranspiration. Irrig. Sci. 23, 1-9. [ Links ]
Ortega-Farias, S.O., A. Olioso, S. Fuentes and H. Valdes. 2006. Latent heat flux over a furrowirrigated tomato crop using Penman- Monteith equation with a variable surfaces canopy resistance. Agric. Water. Manage. 82, 421-432. [ Links ]
Prenger, J.L., R.P. Fynn. and R.C. Hansen. 2002. A comparison of four evapotranspiration models in a greenhouse environmnent. Trans. ASAE. 45(6): 1779-1778. [ Links ]
Ramirez, B.V.H. and W.E. Harmsen. 2011. Water vapor flux in agroecosystems: methods and models review. In: Labedski, L. (ed.), Evapotranspiration. INTECH Open Access Publisher: 3-48. [ Links ]
Rana, G., N. Katerji., M. Mastrorilli, and M. El Moujabber. 1997. A model for predicting actual evapotranspiration under soil water stress in a mediterranean region. Theor. Appl. Climatol. 56:45-55. [ Links ]
Souza, L.O.C., G.G. Faccioli, A.S. Mudrik and E.C. Mantovani. 2003. Comparacao do evapotranpiracao de referencia (ETo), estimada pelos modelos teóricos de Penaman-Monteith e Hargreaves -Samani, com uso do sofware SISDA. pp. 506-511. In: II Simpósio de Pesquisa dos Cafés do Brazil, Viçosa (Brazil). [ Links ]
Suárez, V.S. 1998. Características físicas de los suelos del departamento de Risaralda, relacionadas con el uso, manejo y conservación. Avances Técnicos-Cenicafé. No 257. [ Links ]
Yoder, R.E. y L.O. Odhiuambo and W.C. Wright. 2005. Effects of the water pressure deficit and the net-irradiance calculation methods on accuracy of standardized Penman-Monteith equation in a humid climate. Journal of Irrigation and Drainage Engineering 131(3), 228-237.
[ Links ]
