


![Growth and development of the cupuaçu fruit (Theobroma grandiflorum [Willd. Ex Spreng.] Schum.) in the western colombian Amazon](/img/pt/next.gif)


Serviços Personalizados
Journal
Artigo
 Inglês (pdf)
 Artigo em XML
 Referências do artigo
 Enviar este artigo por email
Indicadores
-
 Citado por SciELO
 -
 Acessos
Links relacionados
-
 Citado por Google
 -
 Similares em
SciELO
Similares em
SciELO -
 Similares em Google
Compartilhar

 Permalink
Agronomía Colombiana
versão impressa ISSN 0120-9965
Agron. colomb. vol.30 no.1 Bogotá jan./abr. 2012
POSTHARVEST PHYSIOLOGY AND TECHNOLOGY
1 Department of Chemical and Environmental Engineering, Faculty of Sciences, Universidad Nacional de Colombia. Bogota (Colombia).
2 Corresponding author. dacastellanose@unal.edu.co
Received for publication: 22 November, 2011. Accepted for publication: 1 March, 2012.
ABSTRACT
To determine the change in the ripening stage and quality through associated variables such as firmness and peel color is a useful tool for predicting the behavior and involvement of the product stored at different changing conditions. The change in O2 and CO2 concentration, pulp firmness and peel color were measured in a test of modified atmosphere packaging for baby banana to develop a mathematical model to represent the change in firmness and color as a function of temperature, mixture of gas and time. The fruits were packaged at three temperatures (11, 13 and 17°C) and a range of combinations of steady state concentrations of modified atmospheres (5.3 to 15.7 kPa O2 and 0 to 11.0 kPa for CO2), local atmospheric pressure of 74.9 kPa (0.74 atm) and 80 % relative humidity constant in polyethylene bags (HDPE) micro-perforated for a period of 30 days. The model considers the product respiration rate by an Michaelis-Menten equation of noncompetitive inhibition, and takes into account the transfer of gases through packaging film and through micro-perforations of this; the change of firmness is considered through a first-order model, and depending on the concentration of both O2 and CO2 by Michaelis-Menten equations; color change (in Hunter Lab coordinates) was considered separately for each color coordinate, representing the coordinate L* using an increase-logistic model, a* by a zero-order model and b* by first-order model, all temperaturedependent by Arrhenius functions. The predictive capability of the developed model is appropriate, explaining 97.0% of the modified atmosphere effect on the loss of firmness, 90.6% of the change in the coordinate L*, 88.9% of the change in a* and 96.7 % of the change in b*.
Key words: mathematical model, respiration, pulp firmness, peel color.
RESUMEN
Determinar el cambio en el estado de madurez y de calidad a través de variables asociadas como la firmeza de la pulpa o el color de la corteza, es una herramienta útil para predecir el comportamiento y afectación del producto almacenado en condiciones cambiantes. El cambio en la concentración de O2 y CO2, la firmeza de la pulpa y el color de la corteza fueron medidas en un ensayo de almacenamiento en atmósferas modificadas de baby banana con el fin de desarrollar un modelo matemático para representar el cambio en la firmeza de la pulpa y en el color de la corteza como función de la temperatura, la mezcla de gases y el tiempo. Los frutos fueron almacenados a tres temperaturas (11, 13 y 17°C) y un rango de combinaciones de concentraciones en el estado estable de atmósferas modificadas (5,3 a 15,7 kPa para O2 y 0 a 11,0 kPa para CO2), con presión atmosférica local de 74,9 kPa (0,74 atm) y humedad relativa de 80% constante en bolsas de polietileno (HDPE) micro-perforado, por un periodo de 30 días. El modelo considera la tasa de respiración del producto mediante una ecuación de Michaelis-Menten de inhibición no competitiva, y tiene en cuenta la transferencia de los gases a través de la película de empaque y a través de las micro-perforaciones de este; el cambio de firmeza es considerado a través de un modelo de primer orden, y la dependencia del nivel de O2 y CO2 mediante relaciones de Michaelis-Menten; el cambio de color (en coordenadas Hunter Lab) fue considerado independiente para cada coordenada de color, representaron la coordenada L* mediante un modelo logístico de incremento, a* mediante un modelo de orden cero y b* mediante un modelo de primer orden dependientes de la temperatura por funciones de Arrhenius. La capacidad de predicción del modelo desarrollado es adecuada, explicando 97,0% del efecto de la atmósfera modificada sobre la pérdida de firmeza de la fruta, 90,6% sobre el cambio en la coordenada L*, 88,9% sobre el cambio en la coordenada a* y 96,7% sobre el cambio en la coordenada b*.
Palabras clave: modelo matemático, respiración, firmeza de pulpa, color de corteza.
Introduction
In Colombia where they are primarily engaged in the The baby banana (Musa acuminata AA) occupies an im-export market because they are very pleasing to consumportant and ever increasing production of edible fruits ers in Europe and North America mainly (MADR, 2006).
However, they have a fairly short postharvest life, which is affected by factors such as temperature, humidity and gas concentration in the surrounding atmosphere that con- tribute to their deterioration. When export products must be transported long distances, usually by freighter, this requires using techniques that ensure the maintenance of quality after long periods of transport. These techniques aim to reduce the fruit respiration rate, ripening delay and prevent physiological disorders (Brackmann et al., 2006). After harvest, bananas have chemical modifications, bearing a continuum of metabolic processes, hydrolysis of starch being the change that characterizes the arrival of senescence. In addition to the hydrolysis of starch, ripening is related to other complex changes, among which are: increased respiration rate, ethylene production and concentration of sugars, solubilization of pectic substances, degradation of chlorophyll, increase in the concentration of organic acids, volatile production, variations in enzymes, vitamins, minerals activities and changes in tissue permeability (Santos et al., 2006).
The use of modified atmosphere (MAP, modified atmosphere packaging) plus the decrease in product storage temperature delays the ripening process because enzymatic activity is reduced by decreasing the temperature, composition of oxygen and ethylene, and increase slightly CO2 concentration; due to the above, in general, reduces the consumption rate of substrates (carbohydrates, organic acids and other cellular stocks) and increases the postharvest life of the product compared to ambient conditions (Saltveit, 2004; Santos et al., 2006). This can be verified by measuring fruit quality properties such as pulp firmness or peel color, which depend on the conversion of carbohydrates in cell walls into sugars and degradation of chlorophyll in the peel (Castro-Benítez et al., 2005). The pulp firmness may indicate the quality and ripening grade of the product since this variation is closely related to the change in storage variables such as temperature and concentrations of the internal atmosphere. Hertog et al. (2001) found a common kinetic between loss of firmness and gas exchange for apples 'Braeburn' stored at 0°C. Hertog et al. (2003) also found quantitative relationships between the rate of gas exchange and changes in properties such as weight (loss), color and firmness in avocado and kiwi in another paper (Hertog et al., 2004).
Temperature, humidity and gas concentration such as CO2, O2 and C2H4 are the most important variables in the MAP storage and are closely related to the shelf life and quality of the stored product (Trakulnaleumsai et al., 2006; Santos et al., 2006).
The change in firmness over time has been represented by a model of the first order (Eq. 1) where F is firmness (Benge et al., 2000), F0 is initial firmness, Ffix is equilibrium firmness, k denotes the rate of loss of firmness (in d-1) and is dependent on the concentration of O2 and CO2 by Michaelis-Menten relationships (Peppelenbos et al., 1996; Hertog et al., 2004) who consider oxidative respiration and fermentation (Eq. 2):
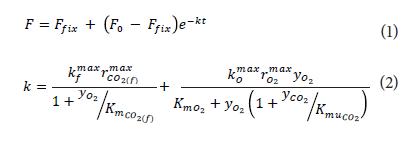
In Eq. 2,  and
and  are the maximum rates of firmness loss related to fermentative and oxidative processes,
  is the Michaelis-Menten constant for the inhibition for CO2 of the loss of firmness related to oxidative process. and are functions of temperature using Arrhenius relationship (Eq. 8 e. g.)
  and
and  y are the maximum anaerobic rates of CO2 production and O2 consumption.
Ripening changes in banana fruit and associated color have been reported by many authors (Ramaswamy and Richards, 1980; Medlicott et al., 1990). Li et al. (1997) developed a system that relates the change in chlorophyll content with the change in the peel color of banana ripening. Tijskens et al. (2008) considered the change in apple color during storage as affected by senescence (aging) and chilling injury, using a model that provides the color coordinate a* (system CIE L*a*b*) as function of storage time at various temperatures.
Chen and Ramaswamy (2002) have considered the kinetics of color change for ripening bananas as a function of time, can be set independently for each coordinate of the color system L*, a* and b* based on the work of Lenz and Lund (1980). L* (lightness) coordinate is represented by an increase logistic model (Eq. 6), a* (red/green) using a zero-order model (Eq. 3) and b* (yellow/blue) by a first order model (Eqs. 4 and 5):
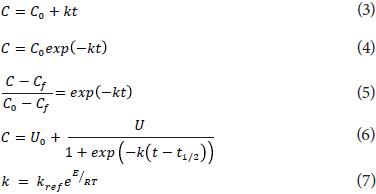
where:
C0 is the coordinate value at time zero, Cf is the value in a time of equilibrium, U0 is a constant value related to the initial value of the color coordinate, U is a value related to the value in equilibrium and t1/2 is the time for which the coordinate value increases or decreases to half the value in the equilibrium constant; k is a constant dependent on gas concentration and temperature using the Arrhenius relationship (Eq. 7), where R is the gas constant. Eq. 5 represents in this case, the fractional conversion for the first-order kinetics.
The aim of this paper is to describe the change in pulp firmness and peel color of baby banana stored in MAP conditions, using a mathematical model that takes into account the fruit respiration rate, O2 and CO2 concentrations in the package headspace, temperature and storage time.
Materials and methods
Raw material (selection criteria, previous treatments and packaging)
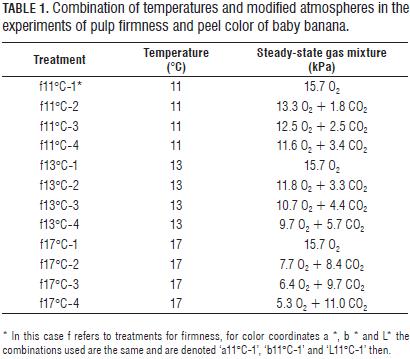
For experiments were used fruits with age of 7 weeks of physiological maturity (stage 1 of 7, 100% green, according to the classification of Chitarra and Chitarra (1990). Fruits were harvested from a plantation located in Icononzo (Tolima department, Colombia). The bunches were transported by truck (at 14°C) to agro-industrial processing laboratories of the Colombian Corporation for Agricultural Research (Corpoica, Tibaitatá) 1 d after harvest. Fruits had a solids content of 3.6±0.2°Brix, titratable acidity 0.21±0.01% (expressed as percentage of malic acid) and pulp firmness 7.7±0.2 kgf. In the laboratory, the clusters were sectioned into groups of four fruits per section, the sections were subjected to appropriate cleaning and disinfection treatments, starting with a wash solution of 2% (v/v) citric acid in water, followed by rinsing, with subsequent crowns immersion in a water solution 2% (v/v) of antifungal Lonlife 20%TM (Adiquim, Bogota), finally fruits surface was dried at room temperature. After cleaning and disinfection, the fruits were selected according to their size, accepting those who had a caliber of 30±4 mm and size of 12±2 cm. After selection, were separated sections of four fruits weighing 250±50 g, constituting an experimental unit or repetition. Fruits were packed in high-density polyethylene bags (HDPE, 0.025 mm thick, total surface area of the bag of 810 cm2), open (1) and sealed (initial concentrations: 3.7 kPa O2 + 1.5 kPa CO2) with 2 micro-perforations of 0.5 mm (2), a micro-perforation of 0.5 mm (3) and one micro-perforation of 0.35 mm (4). Bags were stored at three temperatures (11±0.2, 13±0.2 and 17±0.2°C) with four steady-state concentrations of O2 and CO2 (according to the micro-perforations, Tab. 1), and 0.74 atm (74.9 kPa) local atmospheric pressure, relative humidity of 80% constant, taking data for color and firmness at 0, 5, 10, 15, 20, 25 and 30 d of storage in triplicate.
The gas concentration in the headspace was measured with an electronic gas analyzer PAC Check® Model 325, (Mocon, Minneapolis, MN), which reports total pressure and percentage of molar fraction of O2 and CO2.The peel color was measured in the equatorial area of the fruit, with a colorimeter ColorTecTM SN 3000699-PCM (ColorTec Associates, Clinton, NJ) reporting Hunter Lab coordinates L*, a* and b*, using standard illuminant 'Daylight 65' with 3 replicates per fruit.
The pulp firmness was measured at middle region of each fruit (peeled, subjected to axial puncture), using a manual penetrometer Bertuzzi (model FT 327) 8-mm tip diameter. The reference values measured for Eq. 1 were: Ffix = 0.5±0.1 kgf and F0 = 7.7±0.2 kgf. Each measurement was made in triplicate.
Parameter estimation
Respiration rate
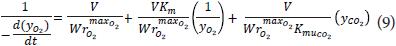
To obtain the maximum oxygen consumption and carbon dioxide production kinetic, rmax, and the Michaelis constant Km, the uncompetitive constants KmuCO2 and the dependence of these with respect to temperature, an experiment was conducted to three temperatures (11±0.2, 13±0.2 and 17±0.2°C) with initial concentrations of 21% (15.7 kPa) and 0% for O2 and CO2 respectively, and 0.74 atm (74.9 kPa) local atmospheric pressure in a closed compartment, making measurements of O2 and CO2 concentrations to the fruits at 30 min, 1, 2, 4, 8, 12, 24 and 48 h in triplicate. In this short time does not show anaerobic CO2 generation. Given the above, the differential equation of material balance for oxygen can be written as:
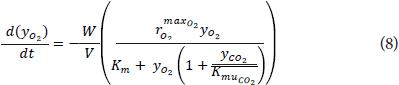
Where:
yO2 and yCO2: molar fractions of O2 and CO2.
rmax: maximum rate of O2 consumption or CO2 production, cm3 kg-1 d-1.
Km: Michaelis constant, dimensionless in this case.
KmuCO2: noncompetitive inhibition constant of CO2, dimensionless in this case.
The equation is similar for CO2 except the negative sign, W is the weight of the fruit (0.3±0.02 kg for the test) and V the headspace (1,310 cm3 in the closed compartment). The linearized form of Eq. 8 is:
From the above equation is found rmax, KmuCO2 and Km for each gas to the three test temperatures by estimating the regression parameters by the method of least squares. To find the temperature dependence (in this case for oxygen) was considered an Arrhenius type relationship of the form:
where:

E: activation energy, kJ mol-1.
R: gas constant, kJ mol-1 K-1.
T: temperature, K.
and in its linearized form:

with Eq. 11 were obtained reference values and the activation energies for each parameter.
Pulp firmness
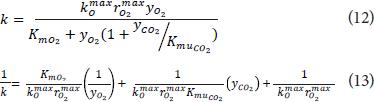
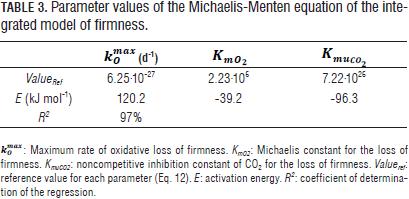
Because oxygen concentrations used were far from zero (O2 concentrations above 10%), it was considered the term corresponding to the rate of firmness loss anaerobic as negligible, simplifying Eq. 2 in Eq. 12. To obtain the parameters of the equation at each temperature the linearized Eq. 13 was employed, making regression to obtain the equation parameters.
The temperature dependence of each parameter was obtained using an Arrhenius relationship (in this case the maximum rate of loss of firmness):

Being  rate of loss of firmness of reference and E the activation energy (in kJ mol-1), with T in Ke. The linearized form is:

Reference values and activation energies for Km, KmuCO2 and rmax of O2 and CO2 were fitted with linearized Eq. 15 then.
Peel color
With the test data, the parameters for the coordinates a* and b* (Eqs. 3 and 5) were found by linear regression at each temperature; the parameters corresponding to the L* coordinate were found by non-linear regression (Eq. 6), and values reference and activation energies by linear regression using Eq. 7. The reference values used in the equations for the color coordinates were measured for fruits in the stage 6 of 7 (100% yellow) fully mature, being respectively:
In order to establish the change in a* and b* with respect to O2 and CO2 concentrations, was made an analysis of variance of the data at each temperature (using the software SAS 9.2, SAS Institute, Cary, NC), comparing the means for Duncan's multiple range test and Tukey's HSD at a level of 5% probability of error.
For the non-linear regression the "nlinfit" function of Matlab® R2010b (MathWorks®, Natick, MA) was used, which returns a vector of coefficients of Eq. 6 for each test temperature.
Results and discussion
Respiration rate
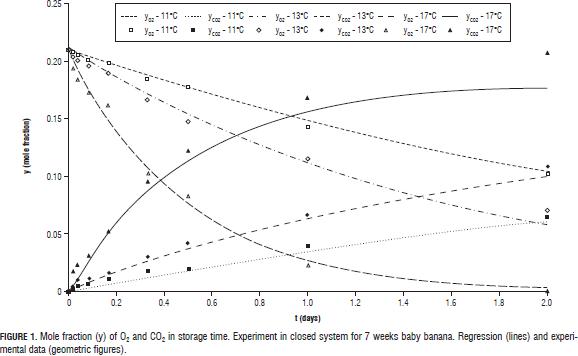
The change in the concentration of O2 and CO2 in the closed system experiment at evaluated temperatures is shown in Fig. 1. Can be seen that at 17°C, the O2 level is reduced to almost zero, which shows the high influence of temperature on the rate of respiration of fruits. Reference values and activation energies for the three parameters of the Michaelis-Menten equation for uncompetitive inhibition are reported in Tab. 2 for the two gases in question.
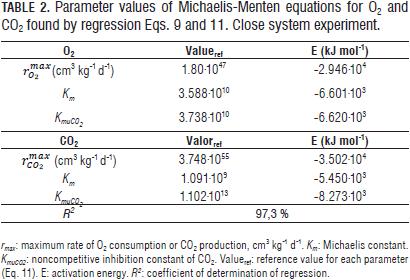
Values for the maximum rates of O2 consumption and CO2 generation (Tab. 2) proved to be very high, taking into account that at high oxygen concentrations, the inverse of the respiration rate is near zero. This behavior was already observed by González-Buesa et al. (2009) for the case of storage of peaches, using in these case, equations without mechanistic background such as Michaelis-Menten used for the regression model generated for this paper.
For the model of change in the pulp firmness, the value corresponding to the maximum rate of oxygen consumption has been integrated because it is necessary for calculating the rate of loss of firmness, k (Eqs. 12 and 13).
Loss of firmness
The temperature dependence of each parameter was obtained from the linearization of the Arrhenius relationship (Eq. 15). No data were available for baby banana stored in MA conditions employed in the literature, making direct comparison impossible. The coefficient of determination of the regression obtained for the model with respect to the experimental results was good (R2 = 0.97), indicating that at least 97% of the data change in fruit firmness, can be explained by the model integrated. The values found experimentally for the model parameters are reported in Tab. 3.
Figs. 2 and 3 show the loss of firmness with storage time for experimental treatmentss used to obtain the model parameters. 2 and 3 at 11 and 13°C (Tab. 1) were not shown, because the values of loss of firmness very close to those shown in Fig. 2).
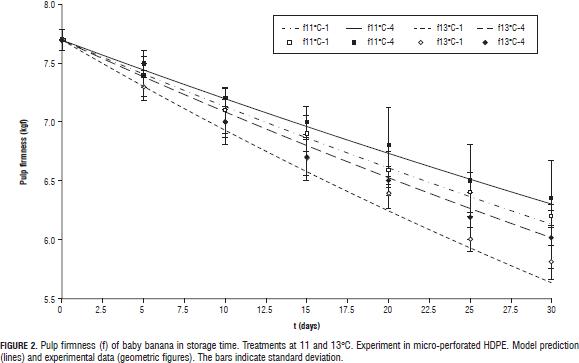
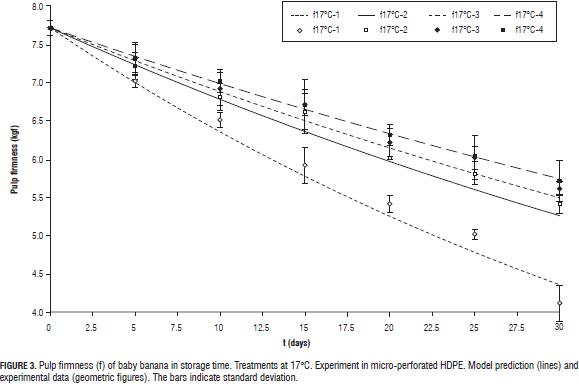
The weaker effect of CO2 in the loss of firmness was evident in the model (Tab. 3). The value of KmuCO2ref which is quite large, resulting in a relationship yCO2/KmuCO2 that tends to zero, affecting very little the value of k in Eq. 14. The assumption of the rate of loss of firmness only as a function of oxidative respiration was acceptable (R2 = 0.97), in agreement with previous results with other species such as apple, avocado or kiwifruit (Hertog, et al. 2001, 2003, 2004). This behavior can be explained by the lower efficiency than the fermentation process has in terms of the energy that is produced for every mole of CO2. With respect to oxygen concentration, a greater loss of firmness for the highest levels in steady state was observed at three evaluated temperatures. This according to the observations of Jiang and Joyce (2003); elevated O2 concentrations in post-harvest storage of bananas is believed to be involved in the synthesis of new ethylene binding sites thus enhancing ethylene production and accelerating ripening. Also, fruits packed in open bags (treatments 1 at each temperature) shown higher firmness losses than fruits packed in micro-perforated bags (with AM; treatments 2-4). Similar observations in MAP of 'Robusta' bananas stored under low temperature conditions were reported by Kudachikar et al. (2011).
The effect of MA was greater in reducing the loss of firmness at temperatures closer to the optimum for storage of baby banana (12°C; Jiang et al., 2004; Castro-Benítez et al., 2005; Fig. 2, 11 and 13°C, and Fig. 3, 17°C).
Peel color
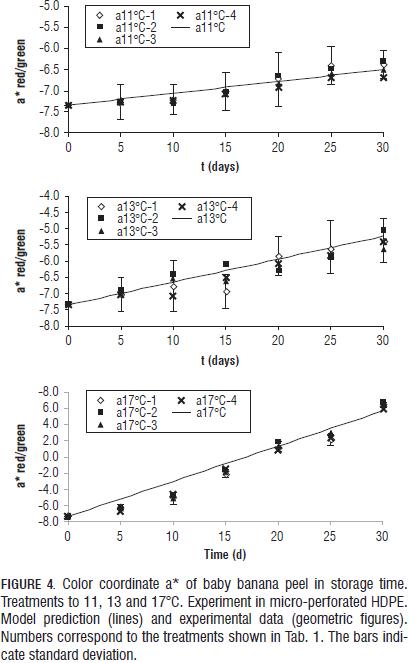
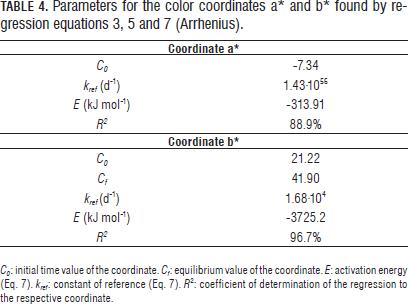
The experimental data of the coordinates a* and b* for all four gas concentrations at each temperature were very close (Fig. 4). Therefore, the ANOVA of the data at each temperature was performed and gave no significant differences among the four gas concentrations for each of the three test temperatures (results not shown). As consequence of the above, the constant k in Eqs. 3, 4 and 5 only was temperature dependent following an Arrhenius function (Eq. 7) for color coordinates a* and b* (Tab. 4).
For L* coordinate, k constant and value t1/2 in Eq. 6 were considered dependent on the concentration of O2 in the headspace by a linear equation (Eq. 16 and 17), considering the constants a, b, c and d temperature-dependents through a Arrhenius function (Eq. 18).
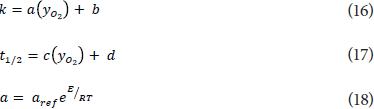
where:
k: constant depending on the concentration of O2, d-1.
t1/2: time for L* reaches half the equilibrium value, depending on the concentration of O2, d.
a, b, c and d: constant values, d-1.
aref, bref, cref and dref: reference values of the constants a, b, c, d-1.
E: activation energy, kJ mol-1.
R: gas constant, kJ mol-1 K-1.
T: temperature, K.
The reference values and the activation energies of constants a, b, c and d for k and t1/2 were found by linear regression of Eq. 18 and are shown in Tab. 5.
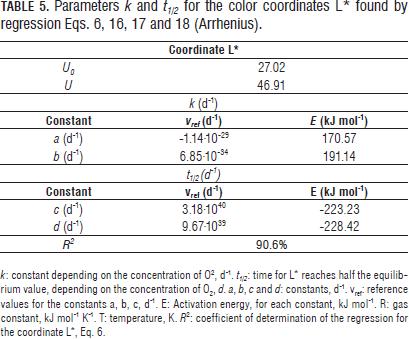
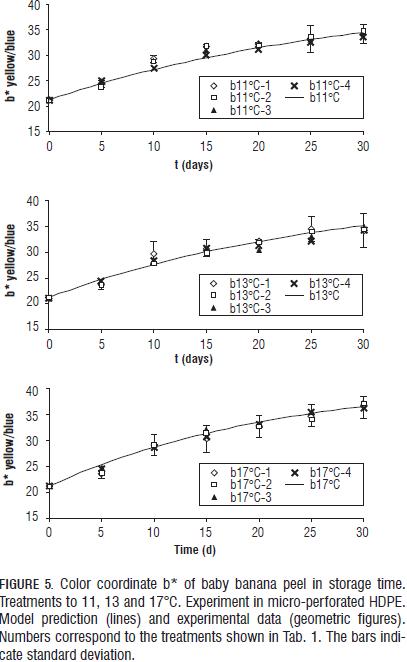
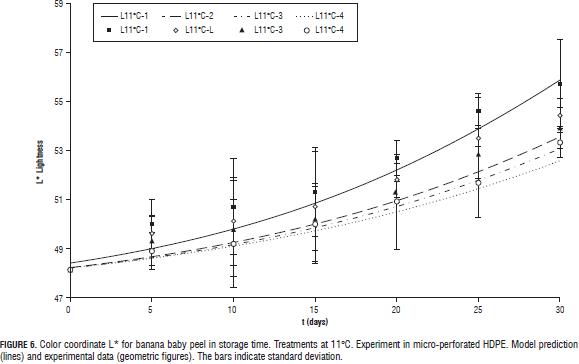
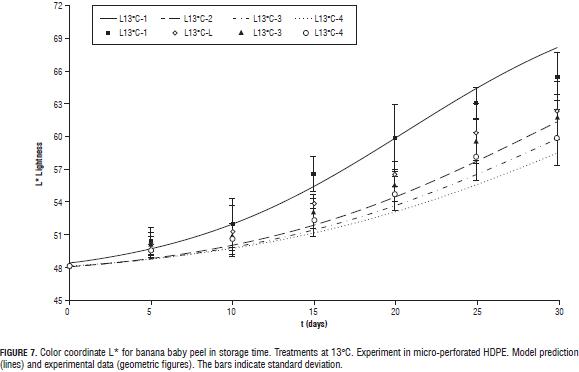
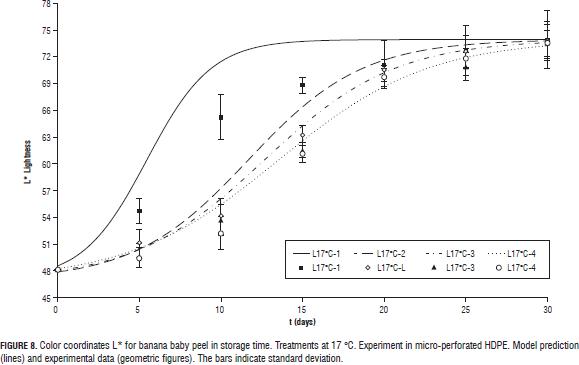
All three color coordinates increase as storage time progresses (Figs. 4, 5, 6, 7 y 8) being the most pronounced increase with increasing temperature and in the case of the coordinate L* (Figs. 6, 7 y 8) with increasing steady state O2 concentration. In general with increasing storage time the fruits gradually changed from a medium green (grade 1, on the scale of Chitarra and Chitarra, 1990) to a deep yellow color (grade 6), this color reaching for fruit stored at 17 °C spent the day 25 of storage. This color change is due to degradation of chlorophyll and other pigments associated located in the chloroplast, by pH changes, oxidative process development and action of enzyme chlorophyllase (Castro- Benítez et al., 2005). The regression model was considered only temperature dependent because the O2 and CO2 concentrations appears to have no effect on the change in color coordinates a* and b* (Figs. 4 and 5). The coefficients found for modelling the change of peel color, indicate a very good representation of the data of the coordinate b* (R2 = 96.7%, yellow/blue values; Tab. 4) and acceptable representations for the coordinates a* and L* (R2 = 88.9%, and 90.6%; Tabs. 4 and 5). As in the case of pulp firmness as storage temperature increases the effect of MA is more limited, coming to have values for the color coordinates of the same order and with a similar evolution over time to those reported by Chen and Ramaswamy (2002) in the storage of bananas at different temperatures.
The models developed in this work can predict in a more than acceptable way, quality changes (through the properties evaluated peel color and pulp firmness) in baby banana stored under different MAP conditions and also may provide with further development, tools in the design of controlled atmosphere storage, offering the possibility to control the properties of the product taking into account their destination, which is undoubtedly of great benefit to the export chain of this fruit and to the local production in Colombia. However, as some authors point out (Ramaswamy and Richards, 1980; Chen and Ramaswamy, 2002), it is required scaling experiments, since these models are based on a limited number of samples and storage equipment for laboratory use.
The models developed could be a useful tool to simulate postharvest storage situations of baby banana in controlled atmospheres (CA) too.
Conclusions
The models developed to represent the change in firmness and color coordinates L*, a* and b* for baby banana stored in modified atmospheres, have adequate predictive power, given the determination coefficients (R2) obtained.
Loss of firmness for baby banana pulp followed a function of the concentration of O2 and CO2 in the package headspace and temperature, using a first order model, with firmness loss rate represented by a Michaelis-Menten non-competitive inhibition function; change in the color coordinates of the peel was represented by an increaselogistic model for coordinate L*, a zero-order model for a* and a first order model for b*, with parameters dependent on temperature through Arrhenius functions.
The coordinates a* and b* were independent of the O2 and CO2 concentrations at storage temperatures employed, while coordinate L* depended on the concentration of O2, representing the constant dependence on gas and time to reach half the equilibrium value as linear functions of the mole fraction of O2.
Acknowledgments
The authors would like to thank the Ministerio de Agricultura y Desarrollo Rural for its financial support and the Colombian Agricultural Research Corporation (Corpoica) for their support in laboratory infrastructure and equipment.
Literature cited
Benge, J.R., H.N. De Silva, N.H. Banks, and P.S. Jeffery. 2000. Empirical modelling of postharvest changes in the firmness of kiwifruit. Postharv. Biol. Technol. 19, 211- 220. [ Links ]
Brackmann, A., C. Steffens, I. Sestari, D. Neuwald, and R. Hettwer. 2006. Armazenamiento em atmosfera modificada e controlada de banana 'Prata' com absorçao de etileno. Ciênc. Agrotec. 30(5), 914-919. [ Links ]
Castro-Benítez, M., L.P. Restrepo-Sánchez, and C.E. Narváez- Cuenca. 2005. Actividad de clorofilasa durante la maduración del banano bocadillo (Musa acuminata) (Simons). Actual. Biol. 27(83), 151-158. [ Links ]
Chen, C.R. and H.S. Ramaswamy. 2002. Color and texture change kinetics in ripening bananas. Lebensm.-Wiss. U.-Technol. 35, 415-419. [ Links ]
Chitarra, M.I.F. and A.B. Chitarra. 1990. Pós-colheita de frutos e hortaliças. Facpe, Lavras, Brazil. [ Links ]
González-Buesa, J., A. Ferrer-Mairal, R. Oria, and M.L. Salvador. 2009. A mathematical model for packaging with microperforated films of fresh-cut fruits and vegetables. J. Food Eng. 95(1), 158-165. [ Links ]
Hertog, M.L.A.T.M., S.E. Nicholson, and N.H. Banks. 2001. The effect of modified atmospheres on the rate of firmness change in 'Braeburn' apples. Postharv. Biol. Technol. 23(3), 175-184. [ Links ]
Hertog, M.L.A.T.M., S.E. Nicholson, and K. Whitmore. 2003. The effect of modified atmospheres on the rate of quality change in Hass avocado. Postharv. Biol. Technol. 29, 41-53. [ Links ]
Hertog, M.L.A.T.M., S.E. Nicholson, and P.B. Jeffery. 2004. The effect of modified atmospheres on the rate of firmness change of 'Hayward' kiwifruit. Postharv. Biol. Technol. 31, 251-261. [ Links ]
Jiang, Y.M. and D.C. Joyce. 2003. Softening response of 1-methylcyclopropene- treated banana fruit to high oxygen atmospheres. Plant Growth Reg. 41(3), 225-229. [ Links ]
Jiang, Y., D.C. Joyce, W. Jiang, and W. Lu. 2004. Effects of chilling temperatures on ethylene binding by banana fruit. Plant Growth Reg. 43, 109-115. [ Links ]
Kudachikar, V.B., Kulkarni, S.G., and M.N. Keshava Prakash. 2011. Effect of modified atmosphere packaging on quality and shelf life of 'Robusta' banana (Musa sp.) stored at low temperature. J. Food Sci. Technol. 48(3), 319-324. [ Links ]
Lenz, M.K. and D.B. Lund, 1980. Experimental procedures for determining destruction kinetics of food components. Food Technol. 34(2), 51-55. [ Links ]
Li, M., D.C. Slaughter, and J.F. Thompson. 1997. Optical chlorophyll sensing system for banana ripening. Postharv. Biol. Technol. 12, 273-283. [ Links ]
MADR, Ministerio de Agricultura y Desarrollo Rural. 2006. Bananito fresco. Información de monitoreo internacional. Sistema de inteligencia de mercados. In: Corporación Colombiana Internacional (CCI), http://www.agronet.gov.co/www/docs_agronet/2006719102836_Bananito.pdf; consulted: March, 2012. [ Links ]
Medlicott, A.P., A.J. Semple, A.J. Thompson, H.R. Blackbourn, and A.K. Thompson. 1990. Measurement of color changes in ripening bananas and mangoes by instrumental, chemical and visual assessments. Trop. Agric. 69(2), 161-166. [ Links ]
Peppelenbos, H.W., L.M.M. Tijskens, J. Van't Leven, and E.C. Wilkinson. 1996. Modelling oxidative and fermentative carbon dioxide production of fruit and vegetables. Postharv. Biol. Technol. 9, 283-295. [ Links ]
Ramaswamy, H.S. and J.F. Richards. 1980. A reflectance method to study the green-yellow changes in fruits and vegetables. Can. Inst. Food Sci. Technol. J. 13(3), 107-111. [ Links ]
Saltveit, M.E. 2004. Cucumber. In: Gross, K.C., C.Y. Wang, and M.E. Saltveit (ed.). The commercial storage of fruits, vegetables, and florist and nursery stocks. Agricultural Handbook No. 66. USDA, ARS, Beltsville, MD. [ Links ]
Santos, C.M.S., E.V. de Barros Vilas Roas, N. Botrel, and A.C. Marques. 2006. Influência da atmósfera controlada sobre a vida pos-colheita e qualidad de banana 'Prata Ana'. Ciênc. Agrotec. 30(2), 317-322. [ Links ]
Trakulnaleumsai, Ch., S. Ketsa, and W. Van Doorn. 2006. Temperature effects on peel spotting in 'Sucrier' banana fruit. Postharv. Biol. Technol. 39, 285-290. [ Links ]
