


Serviços Personalizados
Journal
Artigo
 Inglês (pdf)
 Artigo em XML
 Referências do artigo
 Enviar este artigo por email
Indicadores
-
 Citado por SciELO
 -
 Acessos
Links relacionados
-
 Citado por Google
 -
 Similares em
SciELO
Similares em
SciELO -
 Similares em Google
Compartilhar

 Permalink
Agronomía Colombiana
versão impressa ISSN 0120-9965
Agron. colomb. vol.31 no.2 Bogotá maio/ago. 2013
SOILS, FERTILIZATION & MANAGEMENT OF WATER
A new algorithm for mapping burned areas in Colombia
Un nuevo algoritmo para el mapeo de áreas quemadas en Colombia
Federico González-Alonso1, Carol Franco2,Fredy Vargas 1and Dolors Armenteras 2
1Forestry Research Center (CIFOR) (Centro de Investigación Forestal), National Institute for Agronomic Research (INIA). Madrid (Spain).2Landscape Ecology and Ecosystem Modeling Laboratory, Department of Biology, Faculty of Science, Universidad Nacional de Colombia. Bogota (Colombia). darmenterasp@unal.edu.co
Received for publication: 6 February, 2013. Accepted for publication: 5 June, 2013.
ABSTRACT
Every year, between 2.5 and 4.0 million km2 of vegetation are burned around the world, emitting an annual average of 2,013 Tg of C, at least 50% of which is estimated to represent net emissions that are not compensated for by the regeneration of vegetation. In Colombia, the official statistics of burned areas are not well known, but it is estimated that burned areas vary between 15,000 and 20,000 km2 per year. The main objective of this study was the development and application of a new algorithm for mapping burned areas in Colombia, using a synergistic combination of reflectance images and thermal anomalies detected by the MODIS sensors installed on NASA 's TERRA and AQUA satellites. Upon applying the developed algorithm, a burned surface area in Orinoquía of 998,473 ha was obtained for the month of February, 2007. The validation of the algorithm was performed using high spatial resolution Landsat images and the comparison of the data with the global MODIS MCD45A1 burned area product. The developed algorithm performed very similar to MCD45A1, with an overall accuracy of 79% in both cases. The new algorithm, which was developed for the mapping of burned areas in Colombia, can be used to complement deforestation and forest degradation monitoring procedures that are being implemented in Colombia in the context of the REDD+ mechanism initiation.
Key words: MODIS, fire detection, remote sensing, savannas.
RESUMEN
Cada año se queman en el mundo entre 3,5 y 4,0 millones de km2, que emiten como media anual 2.013 Tg de C, de las cuales se estima que el 50% al menos corresponden a emisiones netas no compensadas por la regeneración de la vegetación. En el caso de Colombia las estadísticas oficiales de área quemada no son bien conocidas pero se estima que el área quemada puede oscilar entre 15.000 y 20.000 km2 al año. El objetivo principal de este trabajo es el desarrollo y aplicación de un nuevo algoritmo para cartografiar el área quemada en Colombia a partir de imágenes de reflectancia procedentes del sensor MODIS, instalado en los satélites TERRA y AQUA de la NASA , y de las anomalías térmicas, también detectadas por dichos sensores, combinadas de forma sinérgica. Al aplicar el algoritmo desarrollado, se ha obtenido una superficie de área quemada para Orinoquia de 998.473 ha en el mes de febrero 2007. La validación del algoritmo se ha realizado mediante la utilización de imágenes de alta resolución espacial Landsat y su intercomparación con el producto global de área quemada MCD45A1 de MODIS con una precisión del 79% en ambos casos. El nuevo algoritmo desarrollado para realizar la cartografía de las áreas quemadas en Colombia puede tener un gran interés y ser complementario con los procedimientos de monitoreo de la deforestación y degradación de los bosques que se están empezando a implementar en Colombia en el contexto de la puesta en marcha del mecanismo REDD+.
Palabras clave: MODIS, detección de incendios, teledetección, sabanas.
Introduction
The conservation and sustainable use of natural resources in Latin America is fundamental within the current context of accelerated climate change caused by global warming. Spatial remote sensing, owing to its special characteristics (i.e., the repetition, comprehensiveness, homogeneity, and objectivity of the information obtained regarding the surface of the Earth), is an indispensable tool for the sustainable management of global natural resources and for the establishment of systematic monitoring that supports an operational knowledge of these resources. For thousands of years, fire has ceased to be a natural force that modifies landscapes, and in the majority of cases, fire has become a human tool used to quickly and easily modify the environment to meet the needs of humans. These anthropogenic fires have not only become more frequent and extensive, but also increasingly affect natural ecosystems by diminishing their resilience (Roberts et al., 2000).
Although fire equally affects nearly all regions on the planet (with the exception of areas without vegetation, such as deserts and the poles), historically, fire research has been focused on subtropical and temperate ecosystems. Only during the last decade, has research on tropical regions, including forests and savannas as well as the impact of fire on land use and ground cover, been developed (Roberts, 2000). Forest fires and vegetation burns also have substantial impacts on the level of greenhouse gas emissions (Van der Werf et al., 2010).
Remote sensors, such as MODIS, SPOT-VEGETAT ION and ATS R-2, have indeed facilitated the study and spatiotemporal monitoring of forest fires on a global scale. This type of information has allowed for the generation of statistics that describe the global incidence of forest fires (Giglio et al., 2005; Tansey et al., 2004; Simon et al., 2004). In addition to global products showing burned areas, regional products have also been generated. For example, a burned area product was generated for Latin America for the year 2004, called AQL2004, in which it was estimated that the area burned across all of Latin America was 153,215 km2 (Chuvieco et al., 2008). Of this total area, 19,449 km2 were located in Colombia (i.e., 12.69% of the area burned in Latin America in 2004).
The comparison of global products indicating burned areas is problematic because the values that have been obtained with different products are, in some cases, highly variable for instance global burned area products L3JRC (Tansey et al., 2004) and MCD45A1 (Roy et al., 2008), were compared for the period of 2000-2006, and average global burned areas of 4,010,858 and 3,465,434 km2, respectively, were obtained.
The average burned area for this period in South America, according to the L3JRC estimates, was 360,882 km2, which represents 8.99% of the total global burned area. In the case of the MCD45A1 product, the average amount of burned area for 2000-2006 for South America was 176,601 km2, which represents 5.09% of the burned areas in the world. According to the L3JRC estimates, an average of 2% of South America is burned every year, whereas according to the MCD45A1 estimates, 0.99% of the continent is burned (Chang and Song, 2009).
For Colombia, the L3JRC product indicates that the average burned area for 2001-2006 was 14,807 km2 (Anaya-Acevedo and Chuvieco-Salinero, 2010). According to the MCD45A1 product (Quality Level 1), the average annual burned area was 4,856 km2 for the same period (Armenteras-Pascual et al., 2011). These global burned area products tend to significantly underestimate the burned area. For example, for Colombia, it was estimated that the L3JRC product undervalued the burned area by 45-50% (Anaya-Acevedo and Chuvieco-Salinero, 2010). For this reason, burned areas in global products should be corrected according to the results of the appropriate validations.
In Giglio et al. (2010), it was estimated that during 1997- 2008 an average of 3.71 million km2 were burned annually around the world, 210,000 km2 of which were in South America (5.81% of the total). In Van der Werf et al. (2010), it was estimated that during 1997-2009, an annual average of 2,013 Tg of C were emitted as a consequence of biomass burning throughout the world. Based on this quantity, it is estimated that at least 500 Tg were "net" emissions that were not compensated by vegetation regeneration, which represents approximately 50% of the global emissions produced by land-use changes (LUCs). These LUCs are mainly attributed to the deforestation and degradation of tropical forests. From these figures, one can deduce the enormous importance of forest fires as a factor in the deforestation and degradation of the world's forests; therefore, there is great interest in monitoring and studying forest fires within the implementation of the REDD+ mechanism.
With respect to South America, during the above-mentioned period (1997-2009), biomass burning led to the emission of an average of 271 Tg of C, which represents 13.46% of global emissions, or double the proportion corresponding to the burned areas, owing to the substantial accumulation of biomass in existing tropical forests in the region. According to GFED3 estimates (Van der Werf et al., 2010), the impact of C emissions resulting from biomass burning is between 241.6 Tg of C in Brazil, with up to 4 Tg of C in Colombia, and 0.2 Tg of C in Ecuador. In absolute terms, the largest emitters due to biomass burning are Brazil (241.6 Tg of C), Bolivia (36.8 Tg of C ), Argentina (16.8 Tg of C), Paraguay (14.4 Tg of C ), and Mexico (11.8 Tg of C). Nevertheless, the relative impacts in terms of the amount of above-ground burning per C stock in 2000-2005 rank the following countries in decreasing order of importance: Guatemala (1.13%), Bolivia (0.82%), Cuba (0.61%), Mexico (0.58%), and Argentina (0.54%).
According to Van der Werf et al. (2010), the GFED3 model estimates average annual emissions from biomass burning for Colombia in 1997-2009 to be 5 Tg of C, with maxima of 10 Tg of C in 2004 and 9 Tg of C in 2007 and a minimum of 2 Tg of C in 2006. These estimates are in agreement with the burned area in Colombia, which illustrates the great importance of having precise estimates of burned areas that are derived from correct algorithms.
Statistics concerning forest fires in Colombia are not well known, and concurrent data on the magnitude of forest fires do not exist. The GLOBSCAR2000 project (Simon et al., 2004) estimates a burned area of 15,000 km2, whereas the GBA2000 (Tansey et al., 2004) and AQL2004 (Chuvieco et al., 2008) projects cite values of 8,015 and 19,500 km2, respectively. For the specific area comprising the Colombian plains, 4,882 km2 were mentioned by Armenteras et al. (2005) for the year 2001, and Romero-Ruiz et al. (2010) indicated an annual average of 27,500 km2 for 2000-2008. In Anaya-Acevedo and Chuvieco-Salinero (2010), the burned area in Colombia was studied based on the global burned area product L3JRC for the period of 2001-2007. The years with the greatest amount of burned area were 2004 and 2007 at approximately 20,000 km2; the year with the least amount of burned area was 2006 with 9,000 km2. The average annual area burned in Colombia in the aforementioned period (2001-2007) was 14,807 km2.
In Armenteras et al. (2009), the geographical and temporal distribution of fires in Colombia was studied using thermal anomaly data deduced from the MODIS sensors during the 2001-2009 period, which allowed for the determination of the spatial and temporal distribution patterns of thermal anomalies in Colombia for different types of vegetation cover, natural regions, and administrative regions. The years with the greatest number of active fires were 2004 and 2007; the lowest number was observed in 2006 and 2002. The type of vegetation cover with the greatest presence of active fires was grassland, followed by pasture and natural forest with approximately half of the incidence rate. The departments with the greatest number of cumulative active fire during the studied period were Meta, Vichada, Arauca, Casanare, and Caquetá. In Armenteras-Pascual et al. (2011), the incidence of forest fires by ground cover type in Colombia during the 2000-2009 period was studied using the global burned area product MCD45A1deduced from MODIS sensor images. The years 2003, 2004, and 2007 had the greatest amount of burned area, whereas 2008, 2005, and 2006 had the least. By natural region, Orinoquía had the greatest burned area, followed by the Amazonia and the Andes.
Mapping burned areas has been mainly based on either postfire reflectance remote sensing images by using spectral indices (such as the normalized difference vegetation index (NDVI)) or active fire remote sensing data. Those two types of data can be used separately or in combination (Merino-de-Miguel et al., 2011). When an area of vegetation is burned, the resulting near infrared (NIR) surface reflectance is reduced; and the shortwave-infrared (SWIR) reflectance increases and an integration of data from both these two bands has been used to develop several indices (e.g., the normalized burn ratio (NBR) and the differenced NBR (dNBR)) (Loboda et al., 2007). On the other hand, active fires are detected using the thermal bands of satellites. However, since the timing of a satellite passing oven an area might not match the time of an active fire, this kind of thermal data has to be used with caution (Roy et al., 2002). In order to overcome these difficulties, several algorithms have been developed at the global level, combining both types of remote sensing data (Giglio et al., 2006; Loboda et al., 2007).
The algorithms that synergistically combine information stemming from the various infrared regions of the electromagnetic spectrum (near, medium, and thermal) have been of great interest (Roy et al., 1999; Fraser et al., 2000; Giglio et al., 2006, 2009; González-Alonso et al., 2009; González-Alonso and Merino-de-Miguel, 2009). In particular, the Burned Area Synergic Algorithm (BASA ) (González-Alonso and Merino-de-Miguel, 2009) as well as its variations (Huesca et al., 2008; Merino-de-Miguel et al., 2010, 2011) have provided the following advantages in applications used in Spain and Colombia: a) data can be preprocessed and processed rapidly, b) field data are not required, c) significant human input is not required, and d) these algorithms are easy to implement.
The primary objective of this study was the development and application of a new algorithm for mapping the burned area in Colombia using a synergistic combination of reflectance images and thermal anomalies detected by the MODIS sensors installed on NASA 's TERRA and AQUA satellites.
The existing global burned area algorithms mentioned above (MCD45A1, L3JRC, GLOBCARBON) do not adapt well to the environmental characteristics of Colombia, primarily due to the substantial cloud cover. For this reason, it is necessary to adopt new strategies when developing algorithms that are more efficient and precise in the specific case of Colombia.
Materials and methods
In the development of the present study, a variation of the BASA (González-Alonso and Merino-de-Miguel, 2009; Merino-de-Miguel et al., 2011) was refined and specifically adapted to the environmental conditions of Colombia. The main steps of the present algorithm were as follows Daily MODIS images of Colombia, collected by the TERRA and AQUA satellites, corresponding to the month of February, 2007, were downloaded from the MODIS-team webpage. For the refinement and testing of the algorithm, only the territory including the natural region of Orinoquía, 17,140,218 ha, was considered. In addition, the month of February, 2007 was selected because it showed a large amount of burned area according to the MCD45A1 product and, therefore, was ideal for performing the relevant test and trials.
The daily TERRA and AQUA images were calculated based on the normalized burn ratio (NBR) index, which is a good indicator of the burned area (Loboda et al., 2007):
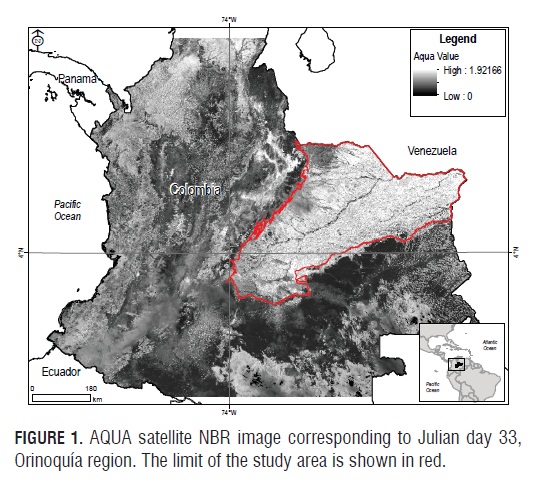
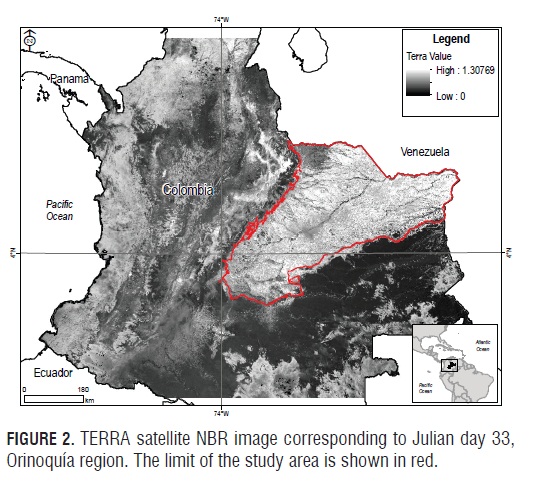
where, r_swir is the reflectance in MODIS sensor band 7 and r_nir is the reflectance in MODIS sensor band 2. In Fig.1, the NBR image corresponding to the AQUA satellite image for Julian day 33 is presented for the Orinoquía region. In Fig.2, the NBR image corresponding to the TERRA satellite image for Julian day 33 is presented for the Orinoquía region.
The daily maximum NBRs from the TERRA and AQUA images were selected for the month of February, 2007. A maximum monthly NBR composite was generated based on these maximum daily NBR values for the month of February, 2007 in Orinoquía, which we called "NBR max". Fig.3 presents the NBR max data for February, 2007 for the Orinoquía region. The darknest colors correspond to the greatest NBR max values that indicate where burned areas are likely located, i.e., fires in these areas have a large effect on the reflective characteristics, which results in high NBR values.

The NBR max image is specifically adapted for the discrimination and mapping of burned areas. This aspect is especially important because standard composites are not specifically designed for these objectives. In Colombia, this problem is compounded by the relative large number of days with high cloud cover.
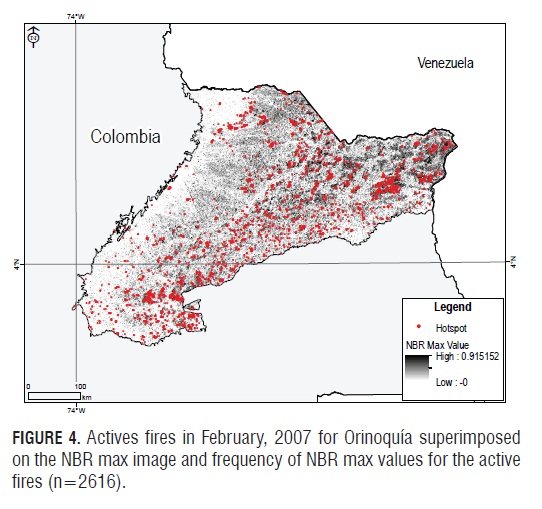
MODIS thermal anomalies for February, 2007 in the Orinoquía region were downloaded from the MODIS-team webpages. A confidence level of greater than 80% was used, and a 500-m radius area of influence was generated for each active fire, thereby eliminating any overlaps. This process generated a mask of active fires for February, 2007. In Fig.4, active MODIS fires superimposed on the NBR max image are represented for February, 2007 for Orinoquía. One can see that active fires are associated with high NBR max values (dark colors) and this is also observed with the histogram that shows the frequency of NBR values for the active fires.
The mapped burned area, deduced from the interval of NBR max that showed the greatest burned signal, was determined based on the active fire mask for February, 2007. The basic working hypothesis was that a burned area (i.e., a high NBR max value) should demonstrate thermal anomalies at some point, provided that the active fire coincided with the passing of the satellite and had a footprint of sufficient size.
The determination of the NBR max interval that defined the burned area was conducted using the NBR max histogram for the active fire mask and by calculating its average. The burned area was defined by values of NBR max that were greater than the average on the active fire mask for February, 2007.
In our case, NBR max > 0.2271.
The burned area in Orinoquía for February 2007 was cleaned up by eliminating patches of less than 1 pixel (500 x 500 m) to avoid false detection or errors that can occur due to the spatial resolution of the MODIS sensor. In order to further validate the results of the INIA-UNA L algorithm, we used data derived from higher spatial resolution images as one of the most common means. In this case, we processed the Landsat-7 ETM (Path 4 Row 56, 11th February, 2007) image that partially covered the study area to produce a high-spatial-resolution burned area map that we used as a reference map. The processing of the Landsat image consisted of a visual interpretation of the burned polygons. In a second step, we compared both the INIA-UNA L algorithm and the MCD45A1 burned area map with this reference map by means of cross tabulation and we built an error matrix. We calculated three validation parameters: overall accuracy, kappa coefficient, and omission and commission errors for the burned class.
Results
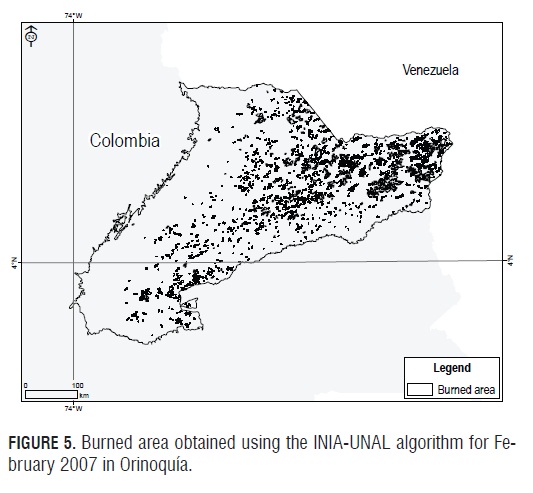
Upon applying the algorithm explained above, a burned surface area of 998,473 ha was obtained for Orinoquía for February, 2007. The burned area obtained using the INIAUNA L algorithm is presented in Fig.5 for February, 2007 in Orinoquia.
The validation of the algorithm was conducted through the use of high spatial resolution Landsat images and their comparison with other existing burned area products, such as the MCD45A1 MODIS product (Roy et al., 1999).
A validation image search was conducted using the freeaccess Landsat archives. The results were unsatisfactory due to the presence of clouds and the banding effect. Thus, it was not possible to conduct a rigorous validation based on high-resolution spatial images.
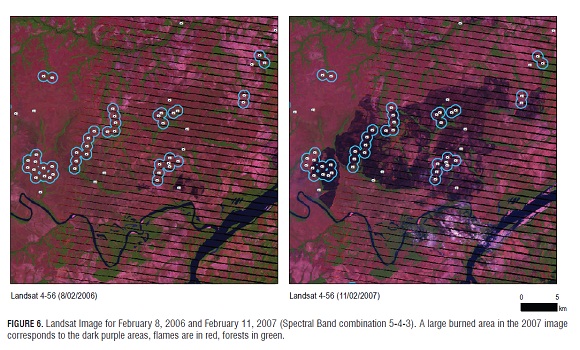
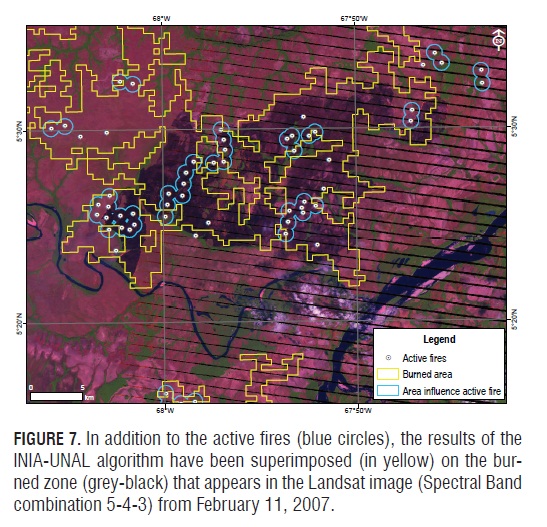
Fig.6 presents a portion of the Landsat image for February 11, 2007, in which a large burned area shown in dark colors was probably initiated in the preceding days. The figure also includes active flame fronts recorded on February 11 at the time that the satellite passed, as shown by the bright orange at the bottom left corner of the image. The active fires detected by MODIS on the same day have been superimposed on the image; some of these active fires coincide with the aforementioned flame fronts, which provides a form of validation for these MODIS active fires. In Fig.7, in addition to the active fires, the result of the INIA-UNAL algorithm has been superimposed (in yellow) over the previously mentioned burned zone. One can observe that the burned area that appears in the February 11, 2007 image is identified with considerable precision. The active fires and burned area that appear in the upper left corner correspond to zones burned between the 12th and 30th of February, 2007, which do not appear in the February 11 image.
The results were also validated by comparison with the MCD45A1 burned area product for February, 2007. Fig.8 presents the MCD45A1 product for February, 2007 (white vectors) laid over the February 11, 2007 Landsat image. This figure shows that although the adjustment is fairly good, there are burned area zones that are not included in the burned area perimeter belonging to the MCD45A1burned area product.
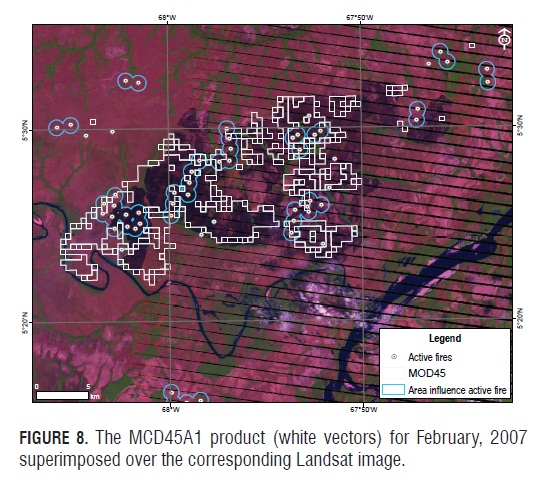
By comparing Fig.7 and 8, one may deduce that the INIAUNA L algorithm better fits the burned area observed in the February, 2007 Landsat image and incorporates the areas burned between the 12th and 30th of February 2007 that do not appear to have been captured by the MCD45A1 product.
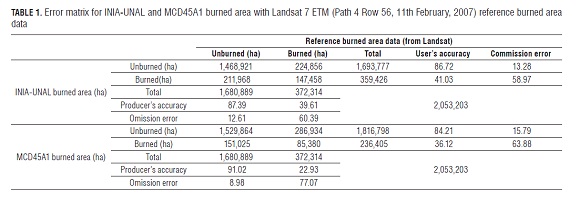
Tab.1 shows the comparative results of the validation of algorithms and MCD45A1 INIA-UNA L in our study area. From this table it follows that the mapping algorithm UNA L INIA maps better the burned areas than the MCD45A1 algorithm, since the sum of their errors of omission and commission is lower (119.26% compared to 140.95%). From the point of view of estimating burned area surfaces the INIA-UNA L algorithm also provides better results than the MCD45A1, since it has a difference in the errors of omission and commission more balanced (1.42% vs. 13.19%) and consequently its estimate of burned area is closer to the real figure estimated reference Landsat image. Chuvieco et al. (2008) obtained some omission and commission errors for Colombia similar to those obtained in the present work when validated their algorithm AQL2004, though their errors were less balanced than the case of INIA-UNA L algorithm. The advantage of the algorithm INIA-UNA L against MCD45A1 and AQL2004 algorithms is that its operational implementation in Colombia can be easier to be a less complex algorithm thus requiring less computational effort.
Conclusions
In the present study, a new algorithm was developed to support the mapping of burned areas in Colombia using information available in images produced by the MODIS sensors installed on the TERRA and AQUA satellites. To develop and test the algorithm, the Orinoquía region in the month of February, 2007 was used as a reference; this reference presented the greatest extent of burned areas during the 2000-2010 period. Upon applying the INIA-UNA L algorithm, a burned area of 998,473 ha was obtained for Orinoquía for February, 2007.
A rigorous validation of the algorithm was not possible due to an insufficient number of cloud-free Landsat TM images for February, 2007 in the Orinoquía region. However, the analyzed examples and the validation with one of the best Landsat images available (11th Feb, 2007) appear to demonstrate that the algorithm works reasonably well in the region. The comparison with the MCD45A1 burned area product appears to demonstrate that the INIA-UNA L algorithm performs better, as it presents less errors of omission and commission and maps burned area patches larger than 25 ha better. Thus, with the aforementioned caveat, the INIA-UNA L algorithm might be a good alternative for operationally mapping burned areas in Orinoquía due to its simplicity and ease of implementation.
For future research, it would be prudent to investigate the application of the algorithm in other natural regions of Colombia, especially in the Amazonía, where a different problem likely exists due to the smaller size of the burned areas. The smaller size might make the identification of burned areas more difficult because of the 500 m spatial resolution of the MODIS sensor.
This procedure for monitoring burned areas in Colombia may be of significant interest and could be used to complement procedures for monitoring deforestation and forest degradation that are being implemented in Colombia within the context of the initial phases of the REDD+ mechanism.
Acknowledgements
The authors wish to thank the Spanish Ministry of Education for the Salvador de Madariaga grant provided to Dr. Federico González-Alonso, and NASA for providing free access to the MODIS and Landsat images. Finally, we want to thank the Vicerrectoría de Investigación of the Universidad Nacional de Colombia for providing support for the English revision of the manuscript.
Literature cited
Anaya-Acevedo, J.A. and E. Chuvieco-Salinero. 2010. Validación para Colombia de la estimación de área quemada del producto L3JRC en el periodo 2001-2007. Actu. Biol. 32(92), 29-40. [ Links ]
Armenteras, D., F. González-Alonso, and C. Franco. 2009. Distribución geográfica y temporal de incendios en Colombia utilizando datos de anomalías térmicas. Caldasia 31(2), 291-306. [ Links ]
Armenteras, D., M. Romero, and G. Galindo. 2005. Vegetation fire in the savannas of the Llanos Orientales of Colombia, difference between global and regional estimates. World Res. Rev. 17(4), 531-543. [ Links ]
Armenteras-Pascual, D., F. González-Alonso, and M. Morales-Rivas. 2011. Incidencia de los incendios forestales sobre la cubierta del suelo de Colombia a partir de información derivada de imágenes Modis del periodo 2000-2009. pp. 167-184. In: Parra L., A. de C. (ed.). Incendios de la cobertura vegetal en Colombia. Tomo 1. Universidad Autónoma de Occidente, Cali, Colombia. [ Links ]
Armenteras-Pascual, D., J. Retama-Alumbreros, R. Molowny-Horas, R. Roman-Cuesta, F. González-Alonso, and M. Morales-Rivas. 2011. Characterising fire spatial pattern interactions with climate and vegetation in Colombia. Agric. For. Meteorol. 151(3), 279-289. [ Links ]
Chang, D. and Y. Song. 2009. Comparison of L3JRC and MODIS global burned area products from 2000 to 2007. J. Geophys. Res. 114(D16), http://dx.doi.org/10.1029/2008JD011361; consulted: June, 2013. [ Links ]
Chuvieco, E., S. Opazo, W. Sione, H. Del Valle, J. Anaya, C. Di Bella, I. Cruz, L. Manzo, G. López, Mari, F. González-Alonso, F. Morelli, A. Setzer, I. Csiszar, J.A. Kanpandegi, A. Bastarrika, and R. Libonati. 2008. Global burned-land estimation in Latin America using MODIS composite data. Ecol. Appl. 18(1), 64-79. [ Links ]
Fraser, R.H., Z. Li, and J. Cihlar. 2000. Hotspot and NDVI Differencing Synergy (HAN DS): a new technique for burned area mapping over boreal forest. Remote. Sens. Environ. 74, 362-376. [ Links ]
Giglio, L., G.R. Van der Werf, J.T. Randersron, G.J. Collatz, and P. Kasibhatla. 2006. Global estimation of burned area using MODIS active fire observations. Atmos. Chem. Phys. 6, 957-974. [ Links ]
Giglio, L., J.T. Randerson, G.R. Van der Werf, D.S. Kasibhatla, G.J. Collatz, D.C. Morton, and R.S. De Fries. 2010. Assessing variability and long-term trends in burned area by merging multiple fire products. Biogeosciences. 7, 1171-1186. [ Links ]
Giglio, L., T. Loboda, D.P. Roy, B. Quayle, and C.O. Justice. 2009. An active-fire based burned area mapping algorithm for the MODIS sensor. Remote Sens. Environ. 113, 408-420. [ Links ]
González-Alonso, F. and S. Merino-de-Miguel. 2009. Integration of AWiFS and MODIS active fire data for burn mapping at regional level using the Burned Area Synergic Algorithm (BASA ). Int. J. Wildland Fire 18(4), 404-414. [ Links ]
González-Alonso, F., M. Huesca, and S. Merino-de-Miguel. 2009. Estimación del área quemada en los incendios de Galicia 2006 utilizando imágenes. MODIS y MERIS. pp. 2-13. In: V Congreso Forestal Español, Ávila, Spain. [ Links ]
Huesca, M., F. González-Alonso, J.M. Cuevas, and S. Merino-de- Miguel. 2008. Estimation of burned surface in 2007 forests fires in Canarias synergically using MODIS images and thermal anomalies. Invest. Agr.: Sist. Recur. For. 17, 308-316. [ Links ]
Loboda, T., K.J. O´Neal, and I. Csiszar. 2007. Regionally adaptable dNBR based algorithm for burned area mapping from MODIS data. Remote Sens. Environ. 109, 429-442. [ Links ]
Merino-de-Miguel, S., F. González-Alonso, M. Huesca, D. Armenteras, and C. Franco. 2011. MODIS reflectance and active fire data for burn mapping in Colombia. Earth Interact. 15(10) 1-17. [ Links ]
Merino-de-Miguel, S., M. Huesca, and F. González-Alonso. 2010. MODIS reflective and active fire data for burn mapping and assessment at regional level. Ecol. Model. 221, 67-74. [ Links ]
Roberts, S.J. 2000. Tropical fire ecology. Prog. Phys. Geog. 24(2), 281-288. [ Links ]
Romero-Ruiz, M., A. Etter, A. Sarmiento, and K. Tansey. 2010. Spatial and temporal variability of fires in relation to ecosystems, land tenure and rainfall in savannas of northern South America. Glob. Change Biol. 16, 2013-2023. [ Links ]
Roy, D.P., L. Giglio, J.D. Kendall, and C.O. Justice. 1999. Multitemporal active-fire based burn scar detection algorithm. Int. J. Remote Sens. 20, 1031-1038. [ Links ]
Roy, D.P., P.E. Lewis, and C.O. Justice. 2002. Burned area mapping using multi-temporal moderate spatial resolution dataA bi-directional reflectance model-based expectation approach. Remote Sens. Environ. 83, 263-286. [ Links ]
Roy, D., L. Boschetti, C.O. Justice, and J. Ju. 2008. The collection 5 MODIS burned area product. Global evaluation by comparison with the MODIS active fire product. Remote Sens. Environ. 112, 3690-3707. [ Links ]
Simon, M., S. Plummer, F. Fierens, J.J. Hoelzemann, and O. Arino. 2004. Burnt area detection at global scale using ATS R-2: The GLOBSCAR products and their qualification (on line). J. Geophys. Res. 109(D14), S02, http://dx.doi.org/10.1029/2003JD003622; consulted: June, 2013. [ Links ]
Tansey, K., J.-M. Gre´goire, D. Stroppiana, A. Sousa, J. Silva, J.M.C. Pereira, L. Boschetti, M. Maggi, P. Brivio, R. Fraser, S. Flasse, D. Ershov, E. Binaghi, D. Graetz, and P. Peduzzi. 2004. Vegetation burning in the year 2000: Global burned area estimates from SPOT VEGETAT ION data. J. Geophys. Res. 109(D14), S03, http://ba1.geog.umd.edu/Papers/Tansey_GBA_JGR.pdf; consulted: June, 2013. [ Links ]
Van der Werf, G.R., J.T. Randerson, L. Giglio, G.J. Collatz, P.S. Kasibhatla, D.C. Morton, R.S. De Fries, Y. Ju, and T.T. Van Leeuwen. 2010. Global fire emissions and the contribution of deforestation, savanna, forest, agricultural and peat fires (1997-2009). Atmos. Chem. Phys. 10, 11707-11735. [ Links ]
