


Services on Demand
Journal
Article
 English (pdf)
 Article in xml format
 Article references
 Send this article by e-mail
Indicators
-
 Cited by SciELO
 -
 Access statistics
Related links
-
 Cited by Google
 -
 Similars in
SciELO
Similars in
SciELO -
 Similars in Google
Share

 Permalink
Agronomía Colombiana
Print version ISSN 0120-9965
Agron. colomb. vol.32 no.1 Bogotá Jan./Apr. 2014
https://doi.org/10.15446/agron.colomb.v32n1.40652
http://dx.doi.org/10.15446/agron.colomb.v32n1.40652
José Edgar Zapata M.1, Oscar Albeiro Quintero C.1, and Luis Danilo Porras B.1
1 Department of Food, Faculty of Pharmaceutical Chemistry, Universidad de Antioquia. Medellin (Colombia). jedgar_4@yahoo.es
Received for publication: 2 November, 2013. Accepted for publication: 19 March, 2014.
ABSTRACT
Moisture sorption isotherms of oat flakes were determined at temperatures of 5, 25 and 37°C, using a gravimetric technique in an aw range of between 0.107 and 0.855. These curves were modeled using six equations commonly applied in food. The quality of the fit was assessed with the regression coefficient (r2) and the mean relative percentage error (MRPE). The best fit were obtained with the Caurie model with r2 of 0.996, 0.901 and 0.870, and MRPE of 7.190, 17.878 and 16.206, at 5, 25 and 37°C, respectively. The equilibrium moisture presented a dependence on temperature in the studied aw range, as did the security moisture (XS). These results suggest that the recommended storage conditions of oat flakes include: a relative air humidity of 50% between 5 and 25°C and of 38% up to 37°C.
Key words: water activity, simulation, diffusion models, storage.
RESUMEN
Se determinaron las isotermas de sorción de humedad de la avena en hojuelas a temperaturas de 5, 25 y 37°C, utilizando una técnica gravimétrica en el rango de aw entre 0,107 y 0,855. Estas curvas se modelaron utilizando seis ecuaciones comúnmente aplicadas en alimentos. La calidad del ajuste se evaluó con el coeficiente de regresión (r2) y el porcentaje de error medio relativo (PEMR). Los resultados mostraron que el modelo de Caurie fue el que mejor se ajustó a los datos experimentales, con r2 de 0.996, 0.901 y 0.870, y %PEMR de 7.190, 17.878 y 16.206, para las temperaturas de 5, 25 y 37°C, respectivamente. La humedad de equilibrio presentó dependencia con la temperatura en el rango de aw estudiado, al igual que la humedad de seguridad (XS). Se obtuvó para este último parámetro valores de 0.053, 0.041 y 0.063 para 5, 25 y 37°C, respectivamente. Los resultados también permiten concluir que las condiciones de almacenamiento recomendadas para la avena en hojuelas son humedad relativa a 50% a 5 y 25°C, y de 38% para 37°C.
Palabras clave: actividad acuosa, simulación, modelos de difusión, almacenamiento.
Introduction
Oat (Avena sativa L.) is a cereal that belongs to the gramineae family, widely used worldwide for human consumption, animal food and cosmetic products (Gates, 2007). Compared with other cereals, oat is considered a source of proteins, carbohydrates, fiber, vitamins and minerals (Gates, 2007). It has components of minor proportion, such as unsaturated fat and b-glucans, which contribute to the health and well-being of human beings (Peterson, 2004).
Oat flakes are an important raw material in the food industry (Gates, 2007). One of the most important aspects concerning oat quality is its moisture content, since many of its physical properties depend on this property (Prieto et al., 2006). But its water activity (aw) is much more important, which indicates the water quantity in a food that may be used for developmental biochemical reactions (i.e., lipid oxidation processes, enzyme reactions, Maillard reaction and microbial development) (Gálvezet al., 2006).
Predicting the variation of the equilibrium moisture content in solid materials, based on fundamentals principles, has not yet been developed for complex systems such as food matrices (Al-Muhtaseb et al., 2004). A common practice is to correlate the experimental data through mathematical models, which render satisfactory results in certain aw ranges and certain food types (Zhang et al., 1996). This adjustment is obtained by graphing the experimental moisture data in the product equilibrium at a pressure and temperature (Corzo and Fuentes, 2004) with the thermodynamic activity of water. The water activity in equilibrium equals the relative moisture of the air that surrounds it (Zhang et al., 1996). The most used strategy for studies on sorption desorption phenomena is sorption isotherms, which are important in the analysis and design of several food processes and can be used to predict changes in food stability and to select appropriate packaging materials and ingredients (Zhang et al., 1996). The sorption-desorption behavior, as well as the isosteric heat of food products and the influence of temperature over the moisture content in equilibrium, provides very useful information for the processes of drying, preservation and conditioning of the food materials (Badui, 1993). Besides, it defines the storing conditions that guarantee food stability (Correa et al., 2004).
Isosteric heat in the desorption processes represents the energy required for breaking inter-molecular forces between the water vapor and the adsorbent surface, while in sorption processes it corresponds to the energy delivered by the molecules as they are being adsorbed (Gálvezet al., 2006; Rizvi, 1995).
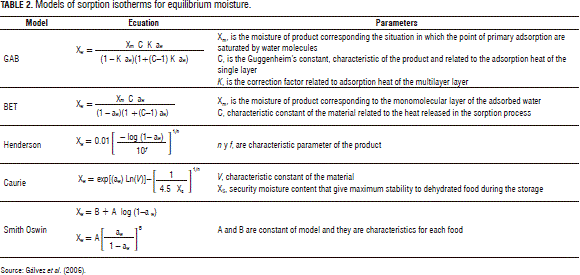
Models that are available in the literature for describing moisture sorption isotherms can be divided into several categories: kinetic models based on a mono-layer (Mod-BET model), kinetic models based on a multi-layer and condensed film (Guggenheim, Anderson and de Boer - GAB, model), semi-empirical (Ferro-Fontan, Henderson and Halsey models) and empirical models (Smith and Oswin models) (Al-Muhtaseb et al., 2004). The BET model represents a fundamental milestone in the interpretation of multi-layer sorption isotherms, particularly Types II and III (Timmermann, 1989). The GAB model is considered to be the most versatile sorption model available in the literature (Al-Muhtaseb et al., 2004). The Smith model (Smith, 1947) is useful in describing the sorption isotherm of biological materials such as starch and cellulose. Henderson (1952) proposed a semi-empirical model for the equilibrium moisture content of cereal grains. The use of Caurie's equation is very important in modeling dehydrated food isotherms since it provides the parameter called "security moisture content" (XS), which indicates the moisture content that results in the maximum stability of food during its storage (Gálvezet al., 2006).
In more recent years, the GAB isotherm equation has been widely used to describe the sorption behavior of foods (Bizot, 1983; Weisser, 1985; Iglesias et al., 1995). Having a reasonably small number of parameters (three), the GAB equation has been found to adequately represent the experimental data in the range of water activity of the most practical interest in foods, i.e., 0.10-0.90 (Timmermann, 2001). The GAB equation has been recommended by the European Project Group COST 90 on Physical Properties of Foods (Wolf et al., 1985) as the fundamental equation for the characterization of water sorption of food materials (Timmermann, 2001). This model has been used with protein, rice, turkey, chicken, tomato, potato starch, and wheat starch (Timmermann, 2001).
On the other hand, the Oswin model has been used with meat and fruits (Boquet et al., 1978) and the Henderson model with Starchy food, Proteins, Meats, and Fruits (Chirife et al., 1978).
The purpose of this study was to experimentally determine the equilibrium moisture curves of oat flakes (Avena sativa L.) at three temperatures (5, 25 and 37°C) and to fit them by means of the mathematical models: GAB, BET, Oswin, Caurie, Smith and Henderson. Furthermore, the present study aimed to establish the best storage and packaging conditions for oat flakes.
Materials and methods
Determining sorption isotherms
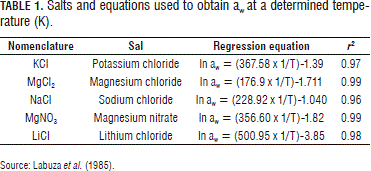
Avena sativa oat flakes were provided by the Gelatinas y Refrescos de Colombia Company, located in Envigado (Colombia). The oat product (Avena sativa or A. byzantine L.) was previously cleaned, dried, stabilized, shelled, cut transversely and crushed to form flakes, scales or flakes, and had rounded, soft edges, uniform size, characteristic color, 15% moisture, 2.0% ash, and 1.8-2.0% crude fiber. The method consisted of putting a previously known mass of sample (triplicate) in tightly closed containers at a constant temperature (5, 25 and 37°C) with a saturated dilution of salt of known water activity (Tab. 1). From then on, the weight of the sample was controlled every 10 d until it achieved a constant weight (equilibrium condition). The containers with relative moisture solutions (%RH) higher than 75% had Thymol added to the structure supporting the sample in order to prevent developing microorganisms, especially fungi. Before doing the equilibrium moisture trials, the initial moisture of the oat flakes was determined by triplicate, following the methods of the AOAC No. 925.10, for which an analytic scale (Acculab LA-60, New Jersey), of 0.001 g precision, and a forced-convection heat drying chamber (Binder, Tuttlingen) were used.
Modeling of the isotherm sorption
The equilibrium moisture content on a dry basis was plotted against the aw, to obtain the equilibrium moisture curves. The experimental data were fit to the mathematics models (Gálvezet al., 2006): GAB (Guggenheim, Anderson and de Boer) (Ocampo, 2006), BET (Brunauer, Emmett and Teller), Henderson, Caurie, Smith and Oswin, which are shown in Tab. 2.
The quality of the fit of the proposed models was assessed with a linear correlation coefficient (r2) and the percentage of the mean relative error (MRPE) (Eq. 1); both are statistic parameters widely used in food isotherms (Tolaba, 2004). The r2 must be higher than 0.85 to get a good fit in the experimental data.
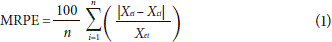
where,
Xei, experimental moisture content (g water/g sample)
Xci, estimated moisture content from every model (g water/g sample)
n, number of observations
Results and discussion
Equilibrium moisture content
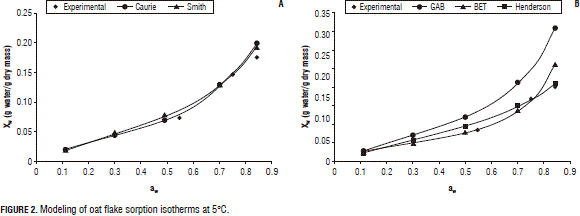
The oat flake sample initial moisture was 0.137±0.001 g water/g sample sorption isotherms for the working temperatures are shown in Fig. 1 (5, 25 and 37°C), which correspond to type II isotherms according to Vander Waals' classification (Debnath et al., 2002). These types of isotherms are the most frequently found in foods such as fruits and vegetables (Martínezet al., 1998; Kiranoudis et al., 1993). According to Fig. 1, the equilibrium moisture curve slope above a particular value of aw increases drastically for the three working temperatures. This behavior can be explained by the endothermic dissolution of sugars at raised values of aw (Brett et al., 2009).
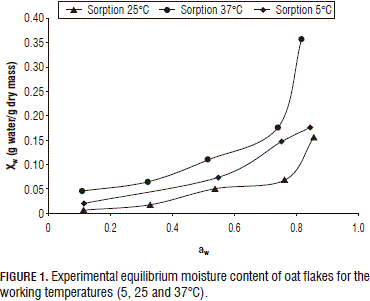
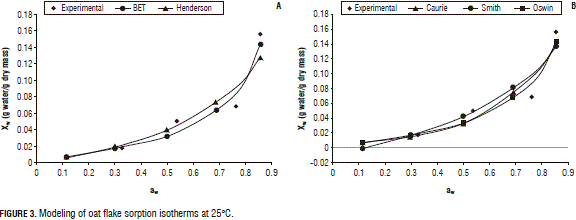
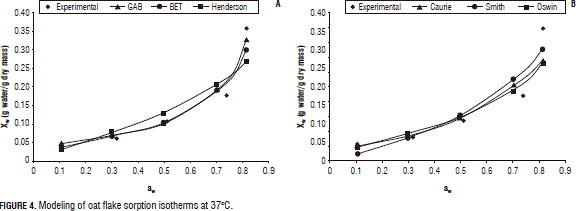
Figure 1 shows that, between 5 and 25°C, as the temperature rose, the equilibrium moisture content for a given aw decreased, which is a common phenomenon in different types of food (Johnson et al., 2000; Gálvezet al., 2006). However, at 25 and 37°C, for a given aw, the equilibrium moisture increased with the temperature over the studied range of water activity, which has already been observed in other types of foods (Foster et al., 2005).
In the first range of temperatures (5 to 25°C), the moisture decreased with increasing temperatures, indicating that the oat flakes became less hygroscopic. This fact was attributed to the higher energy levels and lower stability of water molecules as temperature increases, promoting their separation from the binding sites within the food matrix (Breett et al., 2009).
The system behavior between 25 and 37°C has been widely studied in foods rich in carbohydrates, such as beets (Iglesias et al., 1975) raisins (Saravacos et al., 1986) barley malt (Barreiro et al., 2003) and soy texturized proteins with a 20% sugar content (Cassini et al., 2006). In order to explain this behavior, it must be considered that oat flakes have about 1% sugar, mainly constituted by starch (Aaman et al., 1984; Brett et al., 2009), which may associate them to a greater exposition of active sites or hydroxyl groups as both the aw and the temperature increase (Brett et al., 2009). Under such conditions, the molecules in the glass stage may approximate to the glass transition region and become plasticized, thereby increasing their mobility and availability for sorption (Brett et al., 2009; Perdomo et al., 2009). The role of the glass transition in starch-rich products and how it affects their sorption mechanism has been studied by Al-Muhtaseb et al. (2004) and Perdomo et al. (2009).
The results obtained in this study confirm the premise of Van den Berg (1981) in relation to the modification of the sorption capacity around the transition region where the amorphous region of starch begins to be plasticized, increasing their availability of hydroxyl groups for the sorption of water molecules (Brett et al., 2009).
On the other hand, starch, quantitatively the main component of cereals such as oat, contains two polymers that contribute to its molecular structure: amylose, mainly a linear molecule, and amylopectin, a nonlinear and highly branched molecule (Damodaran et al., 2007; Brett et al., 2009). Both molecules form semicrystalline superstructures (with crystalline and amorphous layers arranged in an onion-like structure) where most of the crystalline regions are formed by amylopectin although part of the amylose molecules are also present in them (Zobel, 1988; Brett et al., 2009). Within such a system, amorphous zones are more water-accessible than crystalline regions in which the intermolecular interactions between the chains are too strong to allow solvent penetration. Consequently, water influences the structure by acting as a plasticizer of the amorphous regions (Al-Muhtaseb et al., 2004; Brett et al., 2009). This effect causes a depression of the glass transition temperature (Tg). The plasticizing effect is very small at low aw values; therefore, the Tg associated with the amorphous regions in samples will be typically high and the material will be glassy at room temperature. Water access will be higher in the rubbery state (at T>Tg) than in the glassy state, since the free volume increases above Tg. Increasing water activity causes an increase in the availability of the polar sites to the water molecules (Al-Muhtaseb et al., 2004; Brett et al., 2009), such as shown in the curve for 37°C (Fig. 1).
Modeling isotherms
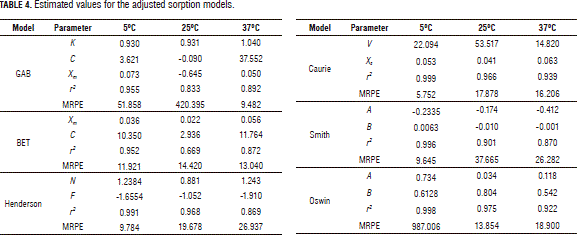
Table 4 presents a summary of the results obtained for the proposed models with their respective constants and r2 and MRPE values. Based on the values of r² and MRPE, the equation proposed by Caurie was seen to be the most useful among those evaluated in this study. The Henderson model also presented a good behavior in respect to the r2 but produced a high MRPE (superior to 19.8%). The GAB, BET and Smith models did not satisfactorily describe the behavior of the oat flake sorption isotherms. On the other hand, the GAB, Oswin and Smith models presented some very high MRPE while BET'S produced a very low r2. This result does not agree with Brett et al., 2009, who reported a good fit with GAB and BET models to oat flour (Brett et al., 2009), nor with Ayala (2011), who reported good fit in cassava flour with the GAB, Oswin and Smith models (Ayala, 2011), or with Gálvezet al. (2006), who observed good fit in corn flour with the GAB and Oswin models (Gálvezet al., 2006).
In this study, (XS) values equal to 0.053, 0.041 and 0.063 g water/g sample were obtained for working temperatures of 5, 25 and 37°C, respectively, with which the dependence of this parameter on temperature can be observed. These values correspond to XS values that have been reported for foods rich in starch (Gálvezet al., 2006; Montes et al., 2009).
Figures 2, 3, and 4 present the experimental and predicted curves for the models at 5, 25 and 37°C, respectively, using the six proposed equations. Here, one can see that the curve predicted by the Caurie model is the best fit to the experimental data, consistent with those predicted by the r2 and MRPE.
Additionally, based on the results from Fig. 1 and Tab. 4, the recommended storage conditions of oat flakes include: relative air humidity of 50% between 5 and 25°C and of 38% up to 37°C, which will prevent the deterioration of enzymatic reactions of carbohydrates, proteins, vitamins etc.
Conclusions
The behavior of the equilibrium moisture of oat flakes at 5, 25, and 37°C may be satisfactorily described by means of the sorption isotherm Caurie model.
The oat flake moisture sorption isotherms showed a clear dependence on temperature for the working values in this study.
Between 5 and 25°C, the equilibrium moisture decreased as the temperature increased, but, between 25 and 37°C, the increases in temperature caused a rise in the equilibrium moisture.
The recommended storage conditions of oat flakes include: a relative air humidity of 50% between 5 and 25°C and of 38% up to 37°C.
Acknowledgements
This study had financial support from the Sustainability Program 2011/2012 of the Committee for Research Development (CODI) of the Universidad de Antioquia, Colombia.
Literature cited
Aaman, P. and K. Hesselman. 1984. Analysis of starch and other main constituents of cereal grains. J. Agron. Res. 14, 135-139. [ Links ]
Al-Muhtaseb, A., W. McMinn, and T. Magee. 2004. Water sorption isotherms of starch powders. Part 1: mathematical description of experimental data. J. Food Eng. 61(3), 297-307. [ Links ]
AOAC, Association of Official Analytical Chemists. 1990. Official methods of analysis. Arlington, VA. [ Links ]
Ayala, A. 2011. Estimación de las isotermas de adsorción y del calor isostérico en harina de yuca. Biotecnol. Sector Agropec. Agroind. 9(1), 88-96. [ Links ]
Badui, S. 1993. Química de los alimentos. Alhambra Mexicana, Mexico DF. [ Links ]
Barreiro, J.A., S. Fernández, and A.J. Sandoval. 2003. Water sorption characteristics of six rowbarley malt (Hordeum vulgare). Lebensm.-Wiss. U.-Technol. 36(1), 37-42. [ Links ]
Bizot, H. 1983. Using the GAB model to construct sorption isotherms. pp. 43-54. In: Jowit, R., F. Escher, B. Hallstrom, H.F.T. Meffert, W.E.L. Spiess, and G. Vos (eds.). Physical properties for foods. Applied Science Publishers, London. [ Links ]
Boquet, R., J. Chirife, and H. Iglesias. 1978. Equations for fitting water sorption isotherms of foods: II. Evaluation of various two-parameter models. Int. J. Food Sci. Technol. 13(4), 319-327. [ Links ]
Brett, B., M. Figueroa, A.J. Sandoval, J.A. Barreiro, and A.J. Müller. 2009. Moisture sorption characteristics of starchy products: oat flour and rice flour. Food Biophys. 4(3), 151-157. [ Links ]
Cassini, A.S., L.D.F. Marczak, and C.P.Z. Noreña. 2006. Water adsorption isotherms of texturized soy protein. J. Food Eng. 77(1), 194-199. [ Links ]
Chirife, J. and H. Iglesias. 1978. Equations for fitting water sorption isotherms of foods: A review. Int. J. Food Sci. Technol. 13(3), 159-174. [ Links ]
Correa, P., P. Da Silva, and L. Almeida. 2004. Estudo das propriedades físicas e de transporte na secagem de cebola (Allium cepa L) em camada delgada. Ciênc. Tecnol. Aliment. 24(3), 319-326. [ Links ]
Corzo, O. and A. Fuentes. 2004. Moisture sorption isotherms and modeling for precooked flours of pigeon pea (Cajanus cajans L. Millsp.) and lima bean (Canavalia ensiformis). J. Food Eng. 65(3), 443-448. [ Links ]
Damodaran, S., K.L. Parkin, and O.R. Fennema. 2007. Fennema's food chemistry. 4th ed. CRC, Boca Raton, FL. [ Links ]
Debnath, S., J. Hemavathy, and K.K. Bhat. 2002. Moisture sorption studies on onion powder. Food Chem. 78(4), 479-482. [ Links ]
Foster, K., J. Bronlund, and A. Paterson. 2005. The prediction of moisture sorption isotherm for dairy powder. Int. Dairy J. 15(4), 411-418. [ Links ]
Gálvez, V., L. Aravena, and L. Mondaca. 2006. Isotermas de adsorción en harina de maíz. Ciênc. Tecnol. Aliment. 26, 821-823. [ Links ]
Gates, F. 2007. Role of heat treatment in the processing and quality of oat flakes. Academic Dissertation. University of Helsinki, Helsinki. [ Links ]
Henderson, S. 1952. A basic concept of equilibrium moisture. Agric. Eng. 33, 29-32. [ Links ]
Iglesias, H. and J. Chirife. 1995. An alternative to the GAB model for the mathematical description of moisture sorption isotherms of foods. Food Res. Int. 28(3), 317-321. [ Links ]
Iglesias, H., J. Chirife, and J. Lombardi. 1975. Water sorption isotherms in sugar beet root. Int. J. Food Sci. Technol. 10(3), 299-308. [ Links ]
Johnson, T. and G. Brennan. 2000. Moisture sorption isotherm characteristics of plantain (Musa AAB). J. Food Eng. 44(2), 79-84. [ Links ]
Kiranoudis, T., B. Maroulis, E. Tsami, and D. Marinos-Kouris. 1993. Equilibrium moisture content and heat of desorption of some vegetables. J. Food Eng. 20(1), 55-74. [ Links ]
Labuza, P., A. Kaanane, and Y. Chen. 1985. Effect of temperature on the moisture sorption isotherm and water activity shift of two dehydrated food. J. Food Sci. 50(2), 385-392. [ Links ]
Martínez N., N., A.M. Andrés G., A. Chiralt B., and P. Fito M. 1998. Termodinámica y cinética de sistemas alimento entorno. Universidad Politécnica de Valencia. Valencia, Spain. [ Links ]
Montes, E., R. Torres, R. Andrade, O. Pérez, J. Marimon, and I. Meza. 2009. Modelado de las isotermas de desorción del ñame (Dioscorea Rotundata). Dyna 76(157), 145-152. [ Links ]
Ocampo, A. 2006. Modelo cinético de secado de la pulpa de mango. EIA 5, 119-128. [ Links ]
Perdomo, J., A. Cova, J. Sandoval, L. García, E. Laredo, and J. Müller. 2009. Glass transition temperatures and water sorption isotherms of cassava starch. Carbohyd. Polym. 76, 305-313. [ Links ]
Peterson, D. 2004. Oat a multifunctional grain. pp. 21-26. In: Peltonen-Sainio, P. and M. Topi-Hulmi (eds.). Proc. 7th Int. Oat Conf. Agrifood Research Reports 51. Agrifood Research, Jokioinen, Finland. [ Links ]
Prieto, G., A. Gordillo, J. Prieto, C. Gómez, and A. Román. 2006. Evaluación de las isotermas de sorción en cereales para desayuno. Superf. Vacío 19, 12-19. [ Links ]
Rizvi, H. 1995. Thermodynamics properties of food in dehydration. pp. 223-309. In: Rao, M.A. and S.S.H. Rizvi (eds.). Engineering properties of foods. Marcel Dekker, New York. [ Links ]
Saravacos, D., A. Tsiourvas, and E. Tsami. 1986. Effect of temperature on the water adsorption isotherms of sultana raisins. J. Food Sci. 51, 381-383. [ Links ]
Smith, S. 1947. The sorption of water vapour by hight polymers. J. Amer. Chem. Soc. 69(3), 646. [ Links ]
Timmermann, E. 1989. A BET-like three sorption stage isotherm. J. Chem. Soc. Faraday Trans. 85(7), 1631-1645. [ Links ]
Timmermann, E., J. Chirife, and H. Iglesias. 2001. Water sorption isotherms of foods and foods stuffs: BET or GAB parameters? J. Food Eng. 48, 19-31. [ Links ]
Tolaba, P., M. Peltzer, N. Enríquez, and L. Pollio. 2004. Grain sorption equilibrium of quinoa grains. J. Food Eng. 61(3), 365-371. [ Links ]
Van den Berg, C. 1981. Vapour sorption equilibrium and other water-starch interactions: a physico-chemical approach. Ph.D. thesis. Wageningen Agricultural University, Wageningen, The Netherlands. [ Links ]
Weisser, H. 1985. Influence of temperature on sorption equilibrium. pp. 95-118. In: Simatos, D. and J.L. Multon (eds.). Properties of water in foods in relation to quality and stability. Martinus Nijhoff Publishers, Dordrecht, The Netherlands. [ Links ]
Wolf, W., W.E.L. Spiess, and J. Jung. 1985. Standardization of isotherms measurements (COST Project 90 and 90 bis). pp. 661-679. In: Simatos, D. and J.L. Multon (eds.). Properties of water in foods in relation to quality and stability. Martinus Nijhoff Publishers, Dordrecht, The Netherlands. [ Links ]
Zhang, X., L. Xie, G. De-Xiang, Z. Wei, W. Ren-li, and L. Pen. 1996. Desorption isotherms of some vegetables. J. Sci. Food Agric. 70(3), 303-306. [ Links ]
Zobel, F. 1988. Molecules to granules: a comprehensive starch review. Starch/Stärke 40(2), 44-50. [ Links ]
