


Serviços Personalizados
Journal
Artigo
 Inglês (pdf)
 Artigo em XML
 Referências do artigo
 Enviar este artigo por email
Indicadores
-
 Citado por SciELO
 -
 Acessos
Links relacionados
-
 Citado por Google
 -
 Similares em
SciELO
Similares em
SciELO -
 Similares em Google
Compartilhar

 Permalink
Agronomía Colombiana
versão impressa ISSN 0120-9965
Agron. colomb. vol.32 no.3 Bogotá set./dez. 2014
https://doi.org/10.15446/agron.colomb.v32n3.45939
Doi: 10.15446/agron.colomb.v32n3.45939
1 Faculty of Agricultural Sciences, Universidad de Nariño. San Juan de Pasto (Colombia). javier@udenar.edu.co
2 Plant Physiology, Centro Nacional de Investigaciones de Cafe (Cenicafe). Chinchina (Colombia).
3 Department of Agronomy, Faculty of Agricultural Sciences, Universidad Nacional de Colombia, Bogota (Colombia).
Received for publication: 2 October, 2014. Accepted for publication: 27 November, 2014.
ABSTRACT
Due to climate changes and increasing food needs, it is important to develop simple models of wide application to determine the irrigation needs. The aim of this study was to calibrate and validate the AquaCrop model in maize crop of the variety ICA V156 in different locations of Colombia, such as Chinchina (Caldas), Palmira (Valle del Cauca) and Cerete (Cordoba), situated at altitudes of 20, 900, and 1,340 m a.s.l., respectively. As part of the model calibration, the biomass, harvest index, and grain yield were recorded. After the calibration, the Pearson correlation coefficient and the respective analysis of variance were calculated for each variable. The biomass, harvest index and grain yield were different in each study site, with the highest grain obtained in Cerete, followed by Chinchina and, finally, Palmira. The modeling in each of the locations showed similarity between the field data and the simulated data in each of the sites. In the calibration, Palmira had the highest grain yield (4.9 t ha-1), followed by Chinchina (4.83 t ha-1) and Cerete (4.15 t ha-1). The validation in each location allowed for the determination of the grain yield, harvest index, biomass and the amount of water needed for crop growth, which averaged 3.45 kg of biomass per m3 of evapotranspired water and was reflected in an average yield of 1.26 kg of grain per m3 of evapotranspired water.
Key words: irrigation, crop growth, yield, soil water, simulation.
RESUMEN
Debido al cambio climático y el aumento de las necesidades de alimentos, es importante desarrollar modelos simples de amplia aplicación para determinar las necesidades de riego. El objetivo del estudio fue calibrar y validar el modelo AquaCrop en el cultivo de maíz de la variedad ICA V156 en las condiciones de tres localidades de Colombia: Chinchiná (Caldas), Palmira (Valle del Cauca) y Cereté (Córdoba), ubicadas a las altitudes de 20, 900 y 1.340 msnm, respectivamente. Como parte de la calibración del modelo se registró la biomasa, el índice de cosecha y el rendimiento. Después del calibrado, se realizó el cálculo de coeficiente de correlación de Pearson y los respectivos análisis de varianza para cada una de las variables. La biomasa, el índice de cosecha y el rendimiento del grano fueron diferentes en cada sitio de estudio, siendo la localidad de Cereté (Córdoba) la de mejor rendimiento de grano, seguida de Chinchiná y por último Palmira. La modelación en cada una de las localidades mostró similitud entre la información de campo y la simulación en cada uno de los sitios evaluados. En la calibración, Palmira mostró el mayor rendimiento de grano (4,9 t ha-1), seguido por Chinchiná (4,83 t ha-1) y por último Cereté (4,15 t ha-1). La validación en cada una de las localidades permitió determinar el rendimiento, el índice de cosecha, la biomasa y la cantidad de agua necesaria para el desarrollo del cultivo, la que fue en promedio de 3,45 kg de biomasa por m3 de agua evapotranspirada, la que se reflejó en un rendimiento medio de 1,26 kg de grano por m3 de agua evapotranspirada.
Palabras clave: riego, crecimiento del cultivo, rendimiento, agua del suelo, simulación.
Introduction
According to Fenalce (2013), corn is the cereal crop which occupies the second largest area in Colombia, with 538,569 ha and a production of around 1.8 million t. The area occupied by white maize corresponds to 33.2% and yellow corn occupies 66.8%; the 50% of these crops use technified production (use of certified seeds, application of agrochemicals and fertilizers) and the remaining area employs the traditional method (Fenalce, 2013). Technified production had a minor extension of its area, with a national average yield of 4.9 t ha-1, while the yields in traditional production were not higher than 1.5 t ha-1. Therefore, it is important to increase production in traditional method areas. That is why it is necessary to find the causes of production decline with the support of mathematical models that determine the factors that influence yield.
The first models of agricultural prediction were used for the yield analysis of different crops (Porter et al., 2010). Over time, the models increased their complexity by including not only the deficiencies of nutrients and water but also the damage caused by pests, diseases, and abiotic processes that affect the dynamics of the nutrients in soil (Smith et al., 2010) and influence plant development (Porter et al., 2010). With the use of modeling in Albacete (Spain), the importance of the irrigation water level for yield was demonstrated, where the water level was able to increase yield performance by between 4 and 6.8% when the irrigation was modeled (López-Mata et al., 2010). Given that freshwater is important in agriculture and the role of irrigation is projected to increase in view of climate changes and increasing food needs, it is important to develop simple models of wide application to determine the irrigation needs over the short term and improve the management of water resources, a key factor in irrigation. For irrigation, modeling is necessary to determine corn development in many areas of the world (Grassini et al., 2009).
Climate changes impact crop production; crop management has to adapt to these new conditions and models can be used to mitigate this situation. The inaccuracy of input data, such as precipitation values, implies that models do not work well and provide erroneous data. Therefore, to be used properly, models must proceed through various stages, such as calibration and validation with experimental data (Abedinpour et al., 2012). With the support of modeling, yield and water use by crops over time were determined (López-Mata et al., 2010; Ma et al., 2012). Typically, grower-generated data are very inaccurate, which makes the use of models a tool to observe the actual information, for which calibration and adjustment (Raman et al., 2011) are necessary. The aim of this study was to calibrate and validate the AquaCrop model for maize var. ICA V156 (Zea mays L.) crops under the conditions of Colombia.
Materials and methods
The data used to run this model were obtained from corn (Zea mays L.) cultures of variety ICA V156 in three locations in Colombia, i.e. Chinchina (Caldas), Palmira (Valle del Cauca), and Cerete (Cordoba), selected for having different altitudes, light conditions, temperatures, relative humidity, and soils. Plants were sown in the field at a rate of 44,444 plants/ha. The plant agronomic management involved timely phytosanitary control and plant nutrition, consistent with the results of foliar and soil analyzes in each site. The daily climate information during the crop development was taken from the Corpoica (Cerete, Palmira) and Cenicafe (Chinchina) weather stations for the years 2003 and 2004. With the obtained agro-climatic information, this model was calibrated and validated in each location.
The producing areas in Chinchina, Palmira, and Cerete were located at altitudes of 20, 900, and 1,340 m a.s.l. The experimental plots consisted of plants sown under a split-plot design at each altitude with four replicates and two treatments that consisted of a combination of two genotypes and one sowing density.
At each site, the phenological development of maize was studied by recording the days to plant emergence and time for vegetative and reproductive development, for which destructive and non-destructive samplings were performed weekly. The phenological characterization in marked plants was determined in days to plant emergence (50% of the population), days to male and female fertility (50% of flowering plants with spikes and stigmas emitted), days of grain filling, and days of harvest. To establish the rate of growth and development, plant height from the ground to the point of insertion of last two leaves and upper ear (cm), stem diameter (at 20 cm from the ground), canopy diameter (cm), leaf area (cm), and total number of leaves were measured. The leaves (including leaf sheath and blade), stem, cob (including bracts and calyx weight, cobs, and grains), and spike were dried at 60°C and their dry weight was obtained. The yield (kg ha-1) of dry grains (11% water content) was measured at physiological maturity. To estimate the yield components, rows per ear, kernels per row, kernels per ear, kernels per plant, and dry weight of 100 grains were measured and the data were used to find the grain:cob ratio. The management of pests, diseases, and weeds was undertaken according to the local practices.
The data were subjected to analysis of variance; the method used to compare the mean was the Fisher significant difference (LSD) at 95% and the final data modeling was correlated by the Spearman method. The Pearson test (P≤0.05) was applied to determine the correlations between the experimental data and the data obtained from the model.
For validation, different weather conditions and production were taken at the three altitudes. Likewise, AquaCrop (FAO-Italy) analyzed the canopy development starting from seedling emergence and lasting until the end of the cycle or harvest (Raes et al., 2011). The starting point for calculation of the physiological development of corn, according AquaCrop, was 8°C, as it was below this temperature that the growth and development of the plants were inhibited (Steduto et al., 2009).
Results and discussion
Calibration-biomass
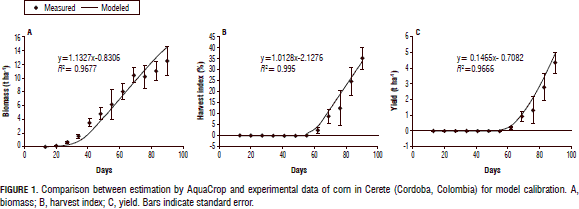
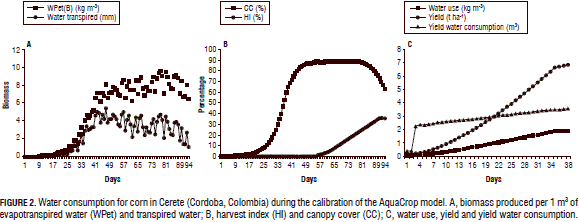
Figure 1A shows the biomass in Cordoba for the experimental and modeled data, with the experimental data of the final biomass at 12.48 t ha-1, whereas the model presented 14.49 t ha-1. The biomass increased daily until flowering, which ceased vegetative growth and started reproductive growth. The measured and modeled biomass were not statistically different at the 5% level, which shows that the calibration was performed successfully (Tab. 1). According to the experimental data and simulation of the biomass, the biomass increased at the final period of grain filling. It was found that AquaCrop adequately simulated the biomass for the tested conditions, but a higher biomass performance could be possible with increased irrigation (Araya et al., 2010).
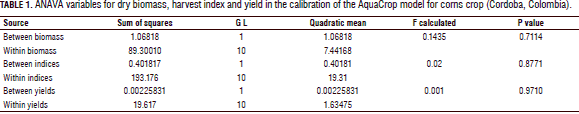
The relationship between biomass, yield and amount of water used to produce the grain for Cerete indicated an increase in water consumption at the start of grain formation (Fig. 2A). In maize, the AquaCrop model, under conditions of drought and high soil moisture, showed that the highest water use efficiency by the plants was found in drought conditions (Stricevic et al., 2011) and the higher variability was found with excessive moisture levels in the soil (Salemi et al., 2011). The simulation provided a biomass potential of 16,248 t ha-1, which, possibly, could be reflected in a higher yield. At the same time, the high amounts of biomass did not always result in a higher yield, as was found by Salmerónet al. (2012), who simulated plant densities in maize and obtained an increase of biomass per unit of area, but the yield was not increased.
Similarly, García-Vila and Fereres (2012) calibrated AquaCrop in southwestern Spain for corn and found that the biomass produced by corn ranged between 25.07 and 30.94 t ha-1 for the observed values and between 28 and 30 t ha-1 for the simulated values, which differed from the observed values and showed a potential for biomass production that, possibly, reflects a higher yield potential.
Calibration-harvest index
The harvest index showed (Figs. 1B, 2B) the affinity between the modeled and field data, giving rates of 33.9% (simulation) and 35.2% (obtained) of the final harvest. The calibration for the harvest index was confirmed with the analysis of variance, where no statistical difference between the measured and modeled values was found (Tab. 1). Likewise (Fig. 2B), the appearance of inflorescences coincided with the cessation of canopy development, indicating the starting point for the formation of harvest index; for the current year, this value was obtained at day 62 after emergence. This information coincides with the start of the harvest index and the cessation of the leaf emission rate in plants of determinate growth, such as maize (Fageria et al., 2006). Equally, it was observed in maize that a longer grain filling was associated with a higher yield (Bolaños, 1995).
Calibration-yield
The calibrated and experimental values of yield were on average 4.9 and 4.3 t ha-1, respectively, in Cerete (Fig. 1C). The statistical analysis showed no difference between the yields (Tab. 1). The modeling indicated a potential yield that could be obtained through crop management and fertilization, which is one of the advantages of the model, as suggested by Sommer et al. (2007), who evaluated the importance of different forms of soil preparation and fertility for maize production in Mexico.
The modeling suggested potential increases in the biomass and harvest index consistent with the efficient use of water for conversion in the biomass (Fig. 2C), with 3.45 kg of biomass produced per 1 m3 of evapotranspired water, this, in turn, resulted in an average yield of 1.26 kg grain per 1 m3 of evapotranspired water (Figs. 2A, 2C). Similarly, Garcia and Garcia et al. (2008), calibrating AquaCrop for corn in Spain, found that the observed yield varied between 12.7 and 16.9 t ha-1 and the yield simulated by the model was between 12.9 and 17 t ha-1, which indicated a potential production.
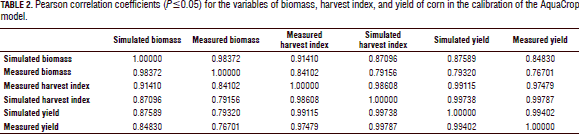
Table 2 shows the Pearson rank correlations between each pair of variables, measured and modeled. The correlation coefficient ranged from 0.76 to 1.00 and measured the strength of the association between the variables (Wilks, 2011), yielding positive values close to 1.00, which indicated that both variables (measured and simulated) were positively correlated with time. Likewise, its proximity to 1.00 showed the high correlation between the field data and the data obtained in the calibration exercise for the variables of biomass, harvest index, and yield (Tab. 2).
Validation-biomass
Figure 3A shows the development of corn biomass in the validation exercise in Cordoba. The modeled biomass was high in both the calibration and validation, with values during the production cycle of 14.7, 14.48, and 12.49 t ha-1 for validated, calibrated, and measured biomass, respectively. In Chinchina, which had a higher availability of soil water during the crop cycle, the highest biomass varied between 13.6 and 15.18 t ha-1 (Fig. 3B), presenting, possibly, a more than sufficient consumption of water as found by Steduto et al. (2009) in corn and other plant species with a high availability of water in the medium.
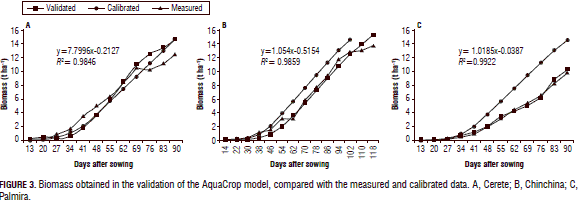
The biomass validated for Palmira was 10.2 t ha-1, while the measured and calibrated biomass were 9.73 and 14.48 t ha-1, respectively (Fig. 3C). As seen in the validation, the biomass was lower, possibly, because of a water shortage observed in Palmira at that time, with only 293 mm of rainfall, defining a low biomass as found by Pérez et al. (2009). The trend in the validation and calibration was overestimating the biomass, possibly because the mathematical structure of the model assumes that the plant is constantly growing, even after the emission of the inflorescence, which stops the leaf emission rate; the results were obtained not with AquaCrop but with Apex (Wang et al., 2008) and other models (Geerts et al., 2010; Zhang et al., 2010; Powers et al., 2011; Coll et al., 2012).
Validation-harvest index
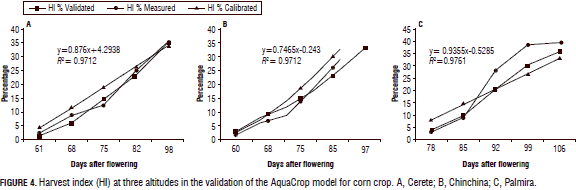
The harvest index for Cerete (Cordoba) was 33.9% (validated), 35.2% (measured) and 34.9% (calibrated) (Fig. 4A). Echarte et al. (2011) mentioned that the harvest index depends on different factors, primarily genetic conditions of seed material and, secondly, the amount of soil water, so that a higher amount of water in the soil is very likely to result in a lower harvest index; situations that may be associated with the validating data for Cerete (Cordoba). The harvest index in the validation for Chinchina (Caldas) was 35.9%, which is comparable with the calibrated (35.23%) and the measured harvest indexes (33.9%) (Fig. 4B). Also, the validation harvest index was 34.6% for Palmira (Fig. 4C), while the calibrated and measured ones were 35.23 and 33.9%, respectively, a trend that has been presented in each of the evaluated locations. It is possible that, according to Gambín et al. (2006), the amount of water available in the soil, at the time of flowering and the start of grain filling, was sufficient to completely form the ear and did not affect the harvest index.
Validation-yield
The yield obtained in Cerete during the validation was 4.15 t ha-1, less than the calibrated value of 4.9 t ha-1 and intermediate to the measured yield of 4.3 t ha-1 (Fig. 5A). Our results are similar to those reported by Abedinpour et al. (2012), who evaluated various corn hybrids and varieties and found that the yields obtained in the validation were similar to the yields from both the modeled and measured data. Additionally, Domínguez et al. (2012), in a corn crop in Spain, found that the Mopeco model simulated the yield and water use by the crop equal to AquaCrop.
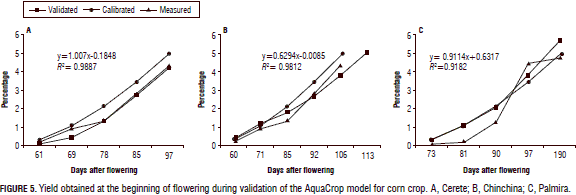
The yield obtained when validating the model in Chinchina was 5.06 t ha-1, the calibrated yield was 4.9 t ha-1 and the measured yield was 4.34 t ha-1 (Fig. 5B). The harvest values showed that it is possible to reach a higher yield, although Sadras and Slafer (2012) suggested that it is necessary to consider grain size when evaluating the yields in the modeling.
In the validation of the model for Palmira (Valle de Cauca), the yield was 5.69 t ha-1, the measured yield was 4.7 t ha-1, and the calibration yield was 4.9 t ha-1 (Fig. 5C). It is likely that the water deficit that occurred in this location affected the yield and canopy development.
Water use-Cerete
The amount of water used in Cerete (Tab. 3) to form 1 kg of biomass was 2.5 kg m3. This value can be considered a high one, possibly because corn plants use more water for the formation of biomass than other species, as reported by Singh and Singh (1995) and Echarte et al. (2011), who studied maize, sorghum, and millet, and observed that maize used more water to form 1 kg of biomass than sorghum under the same conditions.
For yield formation, 1 m3 of water was used to form 0.34 kg of dry grain (Tab. 3); however, the amount of water in plants at grain filling is a determining factor for yield and might have more effect on yield formation than soil water level or fertilization (Fernández et al., 1996). The amount of water in a plant allows for the development of biomass that ultimately will be reflected in better grain filling (Gambín et al., 2006). Likewise, the density and the amount of water presented in the soil can directly influence the development and production of maize as found by Salmerón et al. (2012) in a simulation of model DSSAT-CERES-Maize in dry soil conditions in Zaragosa (Spain), where the population density and depth of irrigation influenced the grain yield at between 28 and 77%.
Part of the water used by the plants participates in the process of respiration; we found that plants consumed about 2.13 mm of water per day for this purpose (data not shown), with a low water consumption at the initial stages, probably due to a lack of canopy development and increased solar radiation above the ground. After flowering and up to 63 d, there was a water deficit (Fig. 6A) that was repeated between 65 and 80 d, which affected the formation of biomass (Steduto and Albrizio, 2005).
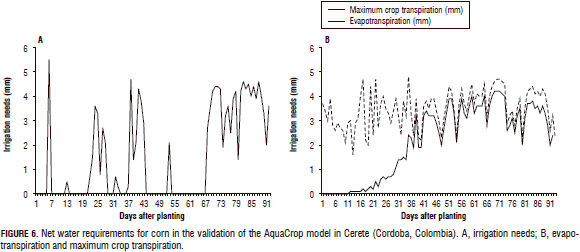
To calculate a balance, the amount of rainfall throughout the crop cycle was taken into account, with 311.9 mm of rainfall during the crop cycle and a crop requirement of 134.9 mm of water to complete the cycle. Consequently, the required water amounts should be applied on days 6, 13, and starting from days 22 to 28, 34 to 35, 37 to 45, 55; 70 to 94, to avoid affecting the yield (Fig. 6A). In that sense, Ma et al. (2012), in Colorado (USA), found, when calibrating a RZWQM2 model for corn, that evapotranspiration data was a tool to determine irrigation schedules for corn and to increase yield.
The database generated by AquaCrop showed that the total crop transpiration was 198.6 mm during the crop cycle, with an average of 2.13 mm d-1, and the total evapotranspiration was 342.2, with an average of 3.49 mm d-1 (Fig. 6B). Ding et al. (2013) and Fernández et al. (1996) estimated the evapotranspiration of maize in a semi-arid area and found that the highest values of evapotranspiration corresponded to those periods when direct solar radiation was higher and crop development was less. The results of these authors coincide with the findings of the present study, where a lower altitude area had the highest values of solar radiation (data not shown).
Water use-Chinchina
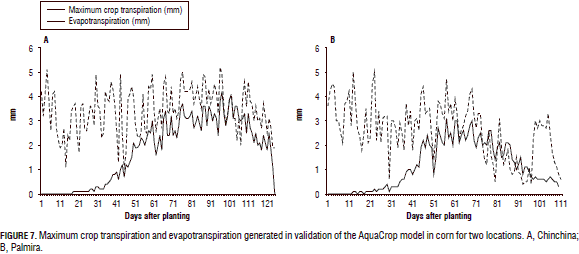
Based on the output from the AquaCrop model in the validation, no additional water requirements were shown, since the amounts of rainfall were sufficient for the development and productivity of plants in this location. The amount of biomass formed per 1 m3 of used water was 1.79 kg, so the total biomass was 16.2 t ha-1 and the water used to form the yield was 0.63 kg m-3 (Tab. 3). The database showed that the overall transpiration of the plants was 222.4 mm during the cycle, with an average of 1.78 mm d-1 (Fig. 7); similarly, the total evapotranspiration was 212.9 mm.
Water use-Palmira
Although rainfall for this area during the crop cycle was 296.3 mm of water (less than for Chinchina), it was sufficient for crop development and yield; therefore, a water need for these growth conditions was not reported by the modeling. The relationship between evapotranspiration and crop transpiration in this area had the same behavior as observed in the other locations (Fig. 7), despite having different temperatures and rainfall regimes. At the beginning of crop cycle, the evapotranspiration exceeded the transpiration (Fig. 7A and B) due to the lack of soil cover by the crop, allowing solar radiation to directly reach the ground, evaporating more water. In Palmira (Fig. 7B), the high evapotranspiration by the plants in the final third of the crop cycle was possibly due to high temperatures and low rainfall, which could indicate less time between physiological maturity and harvest maturity.
Our study showed that AquaCrop can be applied from two perspectives; assessment of crop yields in monitoring and evaluating crop development daily, weekly, decadal, monthly, or as desired, since the model allows for modeling of these situations. For the first case, one can get results from simulations of biomass production and final crop yield and adjustment of some non-conservative parameters. For the second case, simulation parameters can be adjusted from a statistical evaluation which refers to the actual agronomic performance of the crop; for example, monitoring the development of the canopy cover or canopy, dry biomass, and grain yield throughout the growth season.
Conclusions
Using secondary information, AquaCrop described the behavior of corn var. ICA V156 evaluated under Colombian conditions well, showing a yield similar to that measured.
AquaCrop is a robust model, with relatively few parameters; it is intuitive and has a wide spectrum of applications that can help optimize agricultural production.
This model permits the determination of the water deficit and schedule for supplemental irrigation, and facilitates the evaluation of the irrigation impact, fixed level of irrigation water and fixed intervals under different irrigation methods.
This model focuses on the efficiency of the water requirement of the plants because it is the key driver of agricultural production as it tracks the continuous movement of water from the absorbing roots to the leaves.
Acknowledgments
The authors wish to acknowledge the support of the National Federation of Coffee Growers of Colombia - Cenicafe, the National Federation of Cereal Producers of Colombia, Universidad de Nariño and Universidad de Cauca, as well as the contributions of FAO and its consultants during the development of this research.
Literature cited
Abedinpour, M., A. Sarangi, T.B.S. Rajput, Man Singh, H. Pathak, and T. Ahmad. 2012. Performance evaluation of AquaCrop model for maize crop in a semi-arid environment. Agr. Water Manage. 110, 55-66. Doi: 10.1016/j.agwat.2012.04.001 [ Links ]
Araya, A., S.D. Keesstra, and L. Stroosnijder. 2010. Simulating yield response to water of Teff (Eragrostis tef) with FAO's AquaCrop model. Field Crops Res. 116, 196-204. Doi: 10.1016/j.fcr.2009.12.010 [ Links ]
Bolaños, J. 1995. Physiological bases for yield differences in selected maize cultivars from Central America. Field Crops Res. 42, 69-80. Doi: 10.1016/0378-4290(95)00022-I [ Links ]
Coll, L., A. Cerrudo, R. Rizzalli, J.P. Monzon, and F.H. Andrade. 2012. Capture and use of water and radiation in summer intercrops in the south-east Pampas of Argentina. Field Crops Res. 134, 105-113. Doi: 10.1016/j.fcr.2012.05.005 [ Links ]
Ding, R., S. Kang, F. Li, Y. Zhang, and L. Tong. 2013. Evapotranspiration measurement and estimation using modified Priestley-Taylor model in an irrigated maize field with mulching. Agric. Forest Meteor. 168, 140-148. Doi: 10.1016/j.agrformet.2012.08.003 [ Links ]
Domínguez, A., R.S. Martínez, J.A. de Juan, A. Martínez-Romero, and J.M. Tarjuelo. 2012. Simulation of maize crop behavior under deficit irrigation using MOPECO model in a semi-arid environment. Agr. Water Manage. 107, 42-53. Doi: 10.1016/j.agwat.2012.01.006 [ Links ]
Echarte, L., A. Della Maggiora, D. Cerrudo, V.H. Gonzalez, P. Abbate, A. Cerrudo, V.O. Sadras, and P. Calviño. 2011. Yield response to plant density of maize and sunflower intercropped with soybean. Field Crops Res. 121, 423-429. Doi: 10.1016/j.fcr.2011.01.011 [ Links ]
Fageria, N.K., V.C. Baligar, and R.B. Clark. 2006. Physiology of crop production. CRC Press, New York, NY. [ Links ]
Fenalce. 2013. Indicadores cerealistas. In: http://www.fenalce.org/nueva/index.php; consulted: November, 2014. [ Links ]
Fernández, J.E., F. Moreno, J.M. Murillo, J.A. Cayuela, E. Fernández-Boy, and F. Cabrera. 1996. Water use and yield of maize with two levels of nitrogen fertilization in SW Spain. Agr. Water Manage. 29, 215-233. Doi: 10.1016/0378-3774(95)01192-7 [ Links ]
Gambín, B.L., L. Borrás, and M.E. Otegui. 2006. Source-sink relations and kernel weight differences in maize temperate hybrids. Field Crops Res. 95, 316-326. Doi: 10.1016/j.fcr.2005.04.002 [ Links ]
Garcia and Garcia, A., L.C. Guerra, and G. Hoogenboom. 2008. Impact of generated solar radiation on simulated crop growth and yield. Ecol. Model. 210, 312-326. Doi: 10.1016/j.ecolmodel.2007.08.003 [ Links ]
García-Vila, M. and E. Fereres. 2012. Combining the simulation crop model AquaCrop with an economic model for the optimization of irrigation management at farm level. Eur. J. Agron. 36, 21-31. Doi: 10.1016/j.eja.2011.08.003 [ Links ]
Geerts, S., D. Raes, and M. Garcia. 2010. Using AquaCrop to derive deficit irrigation schedules. Agr. Water Manage. 98, 213-216. Doi: 10.1016/j.agwat.2010.07.003 [ Links ]
Grassini, P., H. Yang, and K.G. Cassman. 2009. Limits to maize productivity in the Western Corn-Belt: a simulation analysis for fully irrigated and rainfed conditions. Agric. Forest Meteor. 149, 1254-1265. Doi: 10.1016/j.agrformet.2009.02.012 [ Links ]
López-Mata, E., J.M. Tarjuelo, J.A. de Juan, R. Ballesteros, and A. Domínguez. 2010. Effect of irrigation uniformity on the profitability of crops. Agric. Water Manag. 98, 190-198. Doi: 10.1016/j.agwat.2010.08.006 [ Links ]
Ma, L., T.J. Trout, L.R. Ahuja, W.C. Bausch, S.A. Saseendran, R.W. Malone, and D.C. Nielsen. 2012. Calibrating RZWQM2 model for maize responses to deficit irrigation. Agr. Water Manage. 103, 140-149. Doi: 10.1016/j.agwat.2011.11.005 [ Links ]
Pérez, J.C., R. Urrea, U. Caraballo, and A. Navas. 2009. Manejo del cultivo del maíz en la costa atlántica de Colombia. Corpoica, Cerete, Colombia. [ Links ]
Porter, C.H., J.W. Jones, S. Adiku, A.J. Gijsman, O. Gargiulo, and J.B. Naab. 2010. Modeling organic carbon and carbon-mediated soil processes in DSSAT v4.5. Oper. Res. Int. J. 10, 247-278. Doi: 10.1007/s12351-009-0059-1 [ Links ]
Powers, S.E., J.C. Ascough II, R.C. Nelson, and G.R. Larocque. 2011. Modeling water and soil quality environmental impacts associated with bioenergy crop production and biomass removal in the Midwest USA. Ecol. Model. 222, 2430-2447. [ Links ]
Raes, D., P. Steduto, T.C.Hsiao, and E. Fereres. 2011. AquaCrop version 3.1plus: FAO cropwater productivity model to simulate yield response to water. Reference Manual. FAO, Rome. [ Links ]
Raman, A., J.K. Ladha, V. Kumar, S. Sharma, and H.P. Piepho. 2011. Stability analysis of farmer participatory trials for conservation agriculture using mixed models. Field Crops Res. 121, 450-459. Doi: 10.1016/j.fcr.2011.02.001 [ Links ]
Sadras, V.O. and G.A. Slafer. 2012. Environmental modulation of yield components in cereals: heritabilities reveal a hierarchy of phenotypic plasticities. Field Crops Res. 127, 215-224. Doi: 10.1016/j.fcr.2011.11.014 [ Links ]
Salemi, H., M.A.M. Soom, T.S. Lee, S.F. Mousavi, A. Ganji, and M.K. Yusoff. 2011. Application of AquaCrop model in deficit irrigation management of Winter wheat in arid region. Afr. J. Agric. Res. 6, 2204-2215. Doi: 10.5897/AJAR10.1009 [ Links ]
Salmerón, M., Y.F. Urrego, R. Isla, and J. Cavero. 2012. Effect of non-uniform sprinkler irrigation and plant density on simulated maize yield. Agr. Water Manage. 113, 1-9. Doi: 10.1016/j.agwat.2012.06.007 [ Links ]
Singh, B.R. and D.P. Singh. 1995. Agronomic and physiological responses of sorghum, maize and pearl millet to irrigation. Field Crops Res. 42, 57-67. Doi: 10.1016/0378-4290(95)00025-L [ Links ]
Smith, W.N., B.B. Grant, R.L. Desjardins, D. Worth, C. Li, S.H. Boles, and E.C. Huffman. 2010. A tool to link agricultural activity data with the DNDC model to estimate GHG emission factors in Canada. Agric. Ecos. Environ. 136, 301-309. Doi: 10.1016/j.agee.2009.12.008 [ Links ]
Sommer, R., P.C. Wall, and B. Govaerts. 2007. Model-based assessment of maize cropping under conventional and conservation agriculture in highland Mexico. Soil Till. Res. 94, 83-100. Doi: 10.1016/j.still.2006.07.007 [ Links ]
Steduto, P. and R. Albrizio. 2005. Resource use efficiency of field-grown sunflower, sorghum, wheat and chickpea. II. Water use efficiency and comparison with radiation use efficiency. Agric. Forest. Meteor. 130, 269-281. Doi: 10.1016/j.agrformet.2005.04.003 [ Links ]
Steduto, P., T.C. Hsiao, D. Raes, and E. Fereres. 2009. AquaCrop-The FAO crop model to simulate yield response to water. I. Concepts and underlying principles. Agron. J. 101, 426-467. Doi: 10.2134/agronj2008.0139s [ Links ]
Stricevic, R., M. Cosic, N. Djurovic, B. Pejic, and L. Maksimovic. 2011. Assessment of the FAO AquaCrop model in the simulation of rainfed and supplementally irrigated maize, sugar beet and sunflower. Agric. Water Manag. 98, 1615-1621. Doi: 10.1016/j.agwat.2011.05.011 [ Links ]
Wang, X., P.W. Gassman, J.R. Williams, S. Potter, and A.R. Kemanian. 2008. Modeling the impacts of soil management practices on runoff, sediment yield, maize productivity, and soil organic carbon using APEX. Soil Till. Res. 101, 78-88. Doi: 10.1016/j.still.2008.07.014 [ Links ]
Wilks, D.S. 2011. Statistical methods in the atmospheric sciences. 3th ed. Academic Press, Ithaca, NY. [ Links ]
Zhang, K., I.G. Burns, D.J. Greenwood, J.P. Hammonda, and P.J. White. 2010. Developing a reliable strategy to infer the effective soil hydraulic properties from field evaporation experiments for agro-hydrological models. Agr. Water Manage. 97, 399-409. Doi: 10.1016/j.agwat.2009.10.011 [ Links ]
