Services on Demand
Journal
Article
Indicators
-
 Cited by SciELO
 -
 Access statistics
Related links
-
 Cited by Google
 -
 Similars in
SciELO
 -
 Similars in Google
Share
Agronomía Colombiana
Print version ISSN 0120-9965
Agron. colomb. vol.33 no.2 Bogotá May/Aug. 2015
https://doi.org/10.15446/agron.colomb.v33n2.49324
Doi: 10.15446/agron.colomb.v33n2.49324
1 Area of Agriculture and Food Sovereignty, Fundacion Instituto de Estudios Avanzados (IDEA). Caracas (Venezuela, República Bolivariana de). ramonrea@hotmail.com
2 Department of Sugarcane, Local Station Yaracuy, Instituto Nacional de Investigaciones Agrícolas (INIA). Yaritagua (Venezuela, República Bolivariana de)
3 Department of Sugarcane, Local Station Portuguesa, Instituto Nacional de Investigaciones Agrícolas (INIA). Araure (Venezuela, República Bolivariana de)
4 Faculty of Natural Sciences and Mathematics, Escuela Superior Politécnica del Litoral (ESPOL). Guayaquil (Ecuador)
Received for publication: 24 February, 2015. Accepted for publication: 30 June, 2015.
ABSTRACT
The evaluation of performance stability and high yields is essential for yield trials in different environments. This study was carried out to identifysugarcane genotypesthat have both a high mean cane yield, mesured in tons of cane per hectare (TCH), and stability across seven different environments, using 11 non-parametric statistical methods: Si(1), Si(2), Si(3), Si(6), NPI(1), NPI(2), NPI(3), NPI(4), RS, TOP and DE. The data came from acane yield of 20 genotypes, as measured at seven locations over three crop-years in the sugarcane regional trials of the Instituto Nacional de Investigaciones Agrícolas (INIA) of Venezuela. The genotypes V99-213, V99-236 and V00-50 showed promising yields and stability according to all of the non-parametric statistics. The TCH presented a positive association with the TOP, NPI(2), NPI(3) and Si(6) statistics. The analysis distinguished two groups of statistics using a principal component analysis (PCA). The first group (G1) was composed of the TOP, NPI(4), NPI(2), NPI(3), Si(3) and Si(6) statistics, which were located under the concept of dynamic or agronomic stability because they are associated with yield. The other group (G2) was composed of the NPI(1), Si(1), Si(2), DE and RS statistics, which fell within the static or biological stability concept.
Keywords: adaptability, genotype × environment interaction, Saccharum sp., dynamic stability, static stability.
RESUMEN
La evaluación de la estabilidad y el alto rendimiento es esencial en los ensayos varietales de caña de azúcar conducidos en diferentes ambientes. Este trabajo fue realizado con el objeto de identificar genotipos de caña de azúcar de alto rendimiento, medido en toneladas de caña por hectárea (TCH), y estables en siete diferentes ambientes mediante el uso de 11 métodos estadísticos no paramétricos: Si(1), Si(2), Si(3), Si(6), NPI(1), NPI(2), NPI(3), NPI(4), RS, TOP y DE. Los datos provienen del rendimiento en caña de 20 genotipos medido en siete localidades durante tres años en los ensayos regionales del Instituto Nacional de Investigaciones Agrícolas (INIA) de Venezuela. Los genotipos V99-213, V99-236 y V00-50 mostraron ser promisorio por su rendimiento y estabilidad de acuerdo a todos los estadísticos no paramétricos. TCH presentó asociación positiva con los estadísticos TOP, NPI(2), NPI(3) y Si(6). El análisis de componentes principales (CP) distinguió dos grupos. El primer grupo (G1) formado por los estadísticos TOP, NPI(4), NPI(2), NPI(3), Si(3) y Si(6) que se encuentran bajo el concepto de estabilidad dinámica o agronómica puesto que están asociados con el rendimiento. El otro grupo (G2) formado por NPI(1), Si(1), Si(2), DE y RS que ubican dentro del concepto de estabilidad estática o biológica.
Palabras clave: adaptabilidad, interacción genotipo × ambiente, Saccharum sp., estabilidad dinámica, estabilidad estática.
Introduction
In Venezuela, sugarcane is cultivated under different soil conditions, fertility levels and humidity. The selection of new sugarcane genotypes in breeding programs has been evaluated in different environments to determine its degree of adaptability and stability (Rea et al., 2014). There are different methodologies for the study of the genotype × environment interaction (GEI). The most common approach uses parametric analyses, which are based on statistical assumptions about the distribution of genotypic, environmental and GEI effects (Akcura and Kaya, 2008). Two frequently used parametric statistical analyses are the additive main effects and multiplicative interaction (AMMI) model and the genotype main effects and genotype × environment interaction effects (GGE) model (Gauch, 2006). This type of estimated stability may not behave well if the statistical assumptions are violated by such factors as outliers. Another approach uses non-parametric procedures that are easy to interpret and do not require assumptions in the distribution of the observed values; the addition or deletion of one or a few genotypes does not cause much variation in results (Huehn, 1990; Segherloo et al., 2008; Balalić et al., 2011; Parmar et al., 2012).
For an initial look, the non-parametric methods, based on the order of merit of the genotypes, constitute a valid and useful tool (Sabaghnia et al., 2012). A genotype will be stable if its position in the general order of all the genotypes is similar across different environments. Several non-parametric methods have been used for the interpretation of GEI (Delić et al., 2009; Sabaghnia et al., 2014; Sadeghi and Farshadfar, 2014). Nassar and Hühn (1987) and Hüehn (1990) proposed four non-parametric measurements for phenotypic stability:Si(1) calculates the average of the absolute differences in the orders of a genotype in all environments, Si(2) is the variance between the ranks in all environments, and Si(3) and Si(6) are the sum of the absolute deviation and sum of squares of ranks for each genotype relative to the average of the ranks, respectively. With these indices, a variety is classified as stable if their ranks are similar across environments and have minimal variance. Thennarasu (1995) proposed the following non-parametric statisticsas a measure of stability: NPI(1), NPI(2), NPI(3), and NPI(4), which are based on orders or ranks of adjusted mean of the genotypes in each environment. Stable genotypes are defined according to the methodology of Nassar and Hühn (1987). Fox et al. (1990) proposed a non-parametric superiority method for general adaptability using stratified ranking of cultivars. A genotype that occurred mostly in the top third (high TOP-value) was considered a widely-adapted cultivar. Kang's (1988) rank-sum (RS) is another non-parametric stability procedure where both yield and Shukla's (1972) stability variance were used as selection criteria. In this method, both the highest yielding genotype and the genotype with the lowest stability variance are ranked 1 and the genotype with the lowest RS value is considered the most desirable (Akcura and Kaya, 2008; Farshadfar et al., 2012).
The non-parametric technique, called relative consistency performance and proposed by Ketata et al. (1989), represents an option for the behavior interpretation of genotypes in different environments. This method is based on the simultaneous use of the mean and standard deviation of the genotypic ranks from different locations.
There is an increasing number of non-parametric stability methods to evaluate genotypes grown in different environments. It is therefore useful to study the statistical relationships between these parameters to find the most appropiate one for testing genotypes in breeding programs. One approach is to calculate the rank correlations between different stability stastitics on the basis of empirical data sets (Mohammadi and Amri, 2008).
The objectives of this study were to evaluate the stability of the performance of twenty sugarcane genotypes, seventeen experimental and three commercial, in seven locations in Venezuela, using methods of non-parametric stability and Spearman's rank correlation coefficients between the different nonparametric stability statistics for the mean yield.
Materials and methods
Genetic material and experimental locations
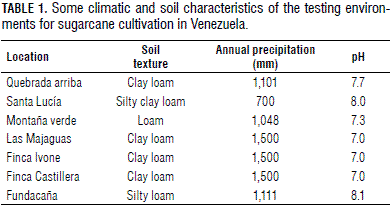
Evaluations of the genotypes were conducted in regional trials of the sugarcane breeding program from the Instituto Nacional de Investigaciones Agrícolas (Spanish acronym INIA). The experimental design used in each trial was a randomized complete block with three replicates. The plots were three rows wide, which were 10.0 m long with 1.5 m between the rows. The evaluated experimental genotypes were: V91-1, V91-2 , V91-6, V91-8, V91-15, V98-62, V98-86, V98-120, V99-117, V99-190, V99-203, V99-208, V99-213, V99-217, V99-236, V99-245 and V00-50. The control cultivars were: B80-408, C323-68, and CP74-2005. All of the materials were evaluated at seven locations: Carora and Montaña Verde in the State of Lara; Majagua, Finca Ivonne and Finca Castillera in the State Local of Portuguesa; and Santa Lucia and Fundacaña in the State of Yaracuy, each with three crop-years (plant crop, first and second ratoon) during 2008-2010. Some environmental conditions of the seven experimental sites of Venezuela can be seen in Tab. 1. The plots had conventional managment and followed the established local practices. All three rows were harvested to measurethe cane yield (TCH). The cane was burned, cut by hand and weighed.
Statistical analysis
The non-parametric statistics Si(1), Si(2), Si(3) and Si(6) (Nassar and Hühn, 1987; Sabaghnia et al., 2006; Mohammadi et al., 2007), NPI(1), NPI(2), NPI(3), and NPI(4) (Thennarasu, 1995; Mohammadi et al., 2007), RS (Kang, 1988), TOP (Fox et al., 1990) and relative consistency performance (Ketata et al., 1989 and Ostengo et al., 2011) were used. Rank measurements and means of the cane yields were used for the graphical depiction. Additionally, the stability parameters were compared using Spearman's rank correlation and principal component analysis (PCA). All of the analyses were performed using InfoStat software (Di Rienzo et al., 2015).
Results and discussion
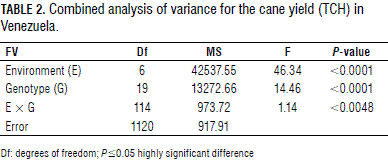
The analysis of variance showed that the genotypic, environmental effects, and GEI were significant. The significance of the GEI indicated that the response of the genotypes was variable, depending on the environmental conditions (Tab. 2). Since the GEI interaction was significant, it was possible to proceed and calculate the phenotypic stability.
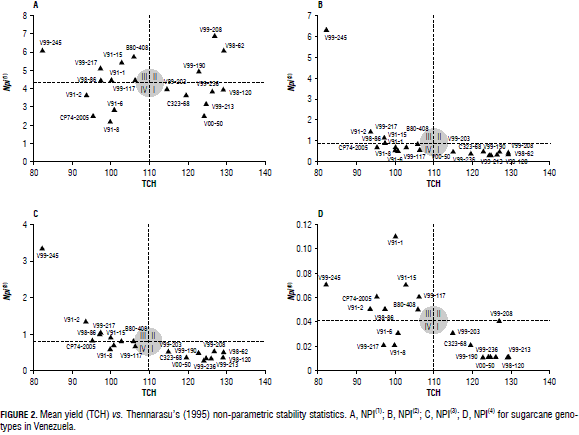
The graphs of the TCH vs. non-parametric measurements were used to improve the efficiency for the visual selection and recommendation of genotypes across the locations (Balalić et al., 2011). Each graph was divided into four sectors: (i) sector I (high yield and stable); (ii) sector II (high yield and unstable); (iii) sector III (low yield and unstable) and (iv) sector IV (low yield and stable). Low values for the "ranking" statistical stability and high cane yield in the genotypes indicated better positioning in the yield.
The Fig. 1 presents the results of the parameters Si(1), Si(2), Si(3) and Si(6) vs. the mean yield of the genotypes. The genotypes were distributed in the different sectors. In Fig. 1A, for the Si(1) statistic, section 1 contained the following genotypes: V99-236, V98-62, V00-50, V99-190, V99-213 and V98-120, which are considered clones with high yield and high adaptability. For the statistic Si(2), the genotypes V00-50, V99-213, C323-68, V99-236, V98-120 and V99-120 were found in section 1 (Fig. 1B). The Si(1) statistic is preferred for practical applications because it is very easy to calculate and allows a clear and objective interpretation. It represents the mean absolute rank difference between the environments. Furthermore, an efficient test of significance is available for this statistic (Farshadfar et al., 2012).
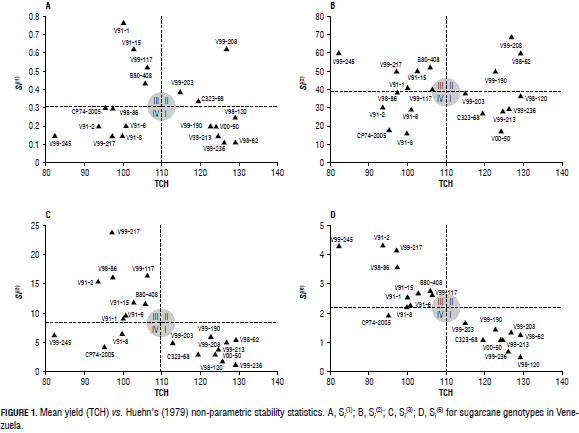
Two other non-parametric statistics described by Huehn (1990), Si(3) and Si(6), combine yield and stability based on the yield ranks of genotypes in each environment. These statistics measure stability in units of the mean rank of each genotype, described in more detail in the original paper by Huehn (1990) with the lowest value for each of these statistics indicating maximum stability for a certain genotype. The genotypes V98-120, V99-236, V00-50, V98-62, C323-62, V99-213, V99-208 and V99-203, based on the parameters Si(3) and Si(6) and cane yield, were identified similarly as the best in section 1. The clones seen in section 2 are assumed to be sensitive to environmental changes or to have specific adaptability. In these cases, it is necessary to check the ranking that occupied the genotype in that specific environment to make a more precise recommendation (Akcura and Kaya, 2008). The clones cited in sections 3 and 4 have low-yields. Kang and Pham (1991) reported that Si(6) isstrongly correlated with the mean yield.
The results of Thennarasu's non-parametric stability statistic (Thennarasu, 1995), which were calculated from the ranks of the adjusted yield means (Fig. 2). According to the first method, NPI(1) (Fig. 2A), the genotypes V00-50, V99-213, V98-120, V99-236, C32-369 and V99-203 were stable, with high yield. In section 2, for this statistic, there was a concentration of three genotypes: V99-190, V98-62 and V99-208, with high yields but unstable behaviors. The parameters NPI(2), NPI(3), and NPI(4), for section 1, had the following clones: V99-203, V99-208, C323-68, V98-62, V00-50, V99-213, V98-120, V99-190 and V99-236 (Fig. 2B, C and D). These genotypes expressed good yield and stability. The coincidence of the NPI(2), NPI(3), and NPI(4) parameters was also seen by Sabaghnia et al. (2006) and Farshadfar et al. (2014) in wheat and lentils, respectively. Figure 3 presents four graphs: 3A, maximum index of superiority (TOP); 3B, statistical rank sum (RS); 3C, relative consistency performance (Ketata et al., 1989) and 3D, principal component analysis (PCA).
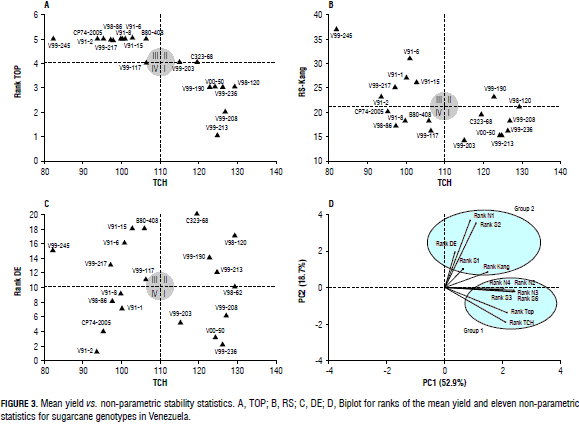
According to the non-parametric (TOP) superiority index (Fox et al., 1990), the better genotypes were V99-208, V98-62, V00-50, V99-213, V98-120, V99-190 and V99-236 (Fig. 3A). These genotypes ranked in the top-third of the genotypes in a high percentage of the environments. This method is very simple and independent of any scale that sorts individuals according to their adaptation to all environments. This statistic has been related to the concept of dynamic stability (Kaya and Taner, 2003).
According to the rank-sum (RS) statistic (Kang, 1988), the genotypes V00-50, V99-213, V99-236, V99-208 and V99-213 presented a low rank-sum and, therefore, were regarded as more desirable. This method has been recommended for selecting cultivars with a good yield and stability in several crops (Kang and Pham, 1991; Abdulahi et al., 2007; Kiliç, 2010). This procedure also has been employed for screening stability criteria and quantitative indicators for drought tolerance in wheat (Mohammadi et al., 2007; Farshadfar et al., 2012) and in chickpeas (Zali et al., 2011; Mahtabi et al., 2013). The results of this method for stable and unstable genotypes are in relative agreement with the TOP procedure. Kang and Pham (1991) and Sabaghnia et al. (2014) reported that RS statistics study the dynamic aspect of stability because it is related to high yield. Because of integrating yield and stability, RS is probably one of the more important criteria for selecting varieties, as compared with other methods under low-intensity humidity stresses (Sabaghnia et al., 2014).
The method of relative stability consistency performance, based on both the mean yield and the standard deviation of each individual rank (Fig. 3C). The genotypes V99-203, V99-208, V99-236 and V00-50 were grouped in sector 1, classified by Ketata et al. (1989) as superior consistency, which had the more stable and better yields, followed by a group in sector 2 with superior inconsistency (V98-62, V99-213, V99-190, V98-120 and C323-62) of high yield but unstable behavoirs, which can be adapted to favorable or specific locations. Ostengo et al. (2011) recommended this method as a further measure in trials of sugarcane varieties in order to quickly and easily assess the behavior of genotypes in different environments. Simultaneous consideration of both the mean yield and stability would be useful for selecting the most favorable genotypes (Kang, 1998; Sabaghnia et al., 2012). It seems that plotting the mean yield versus each of the non-parametric stability statistics helps to identify high mean yield and stable genotypes. Our results demonstrated the utility of this hypothesis and determined the most favorable genotypes. In each graph, the studied genotypes were classified into four distinct groups, with only one group that could be regarded as the most favorable genotype (high mean yield and most stable genotype). This study suggested that the non-parametric stability analysis could contribute to supplementary information on the performance of genotypes and enable their recommendation to sugarcane producers.
Association between non-parametric statistical methods
Spearman's coefficient of rank correlation was employed to statistically compare the stability indices used in this study. All of the evaluated genotypes were respectively assigned stability values according to the procedure and definitions that were used and then ranked in order to determine Spearman's rank correlation coefficient between the different procedures (Tab. 3). The TCH ranks were significantly correlated with the statistics TOP, NPI(2), NPI(3), and Si(6) (P≤0.01) and associated with NPI(1) and Si(2); Si(3) and Si(6); NPI(3) and NPI(4) (P≤0.01). These types of associations have also been reported by Akcura and Kaya (2008); Kiliç et al. (2010) in wheat. Sabaghnia et al. (2006) and Mohammadi and Amri (2008) indicated that the TOP procedure is associated with yield and the concept of dynamic stability and, therefore, can be used to recommend cultivars adapted to favorable conditions. Significant and positive correlations between Si(3) and Si(6); Si(6) with NPi(2) and NPi(3) were also reported by Kang and Pham (1991), Segherloo et al. (2008) and Mohammadi et al. (2007). Statistics with positive and significant correlation between them, selected genotypes stable and high yield in the same way (Farshadfar et al., 2014).
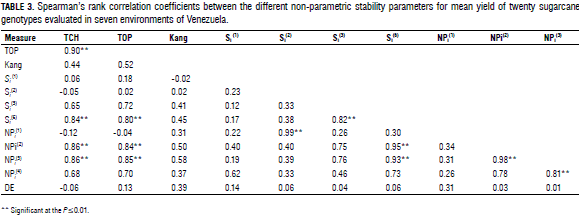
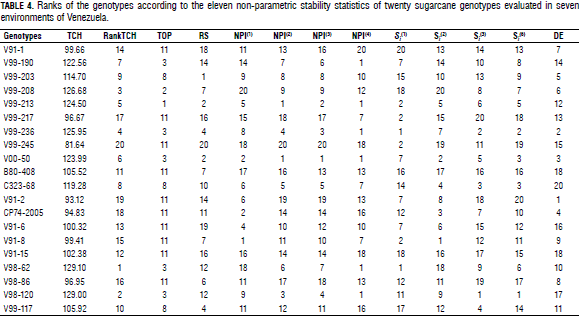
To better understand the relationships between the rank-based statistics, a principal component analysis (PCA) was performed on the rank correlation matrix (Tab. 4). The first two components accounted for 62.8% (CP1 = 43.9, and CP = 18.9%) of the variances of the original variables. These relationships between the statistics are represented in a biplot (Fig. 3D). There, we can distinguish two groups of statistics: the first group (G1) formed by the TOP, NPI(4), NPI(2), NPI(3), Si(3) and Si(6) statistics were located under the concept of dynamic or agronomic stability since they are associated with yield (Sabaghnia et al., 2006; Mohammadi et al., 2007). The other group (G2), formed by the NPI(1), Si(1), Si(2), DE and RS statistics, fell within the static or biological stability concept. This concept of stability is based on the idea that a genotype is stable if it has minimum variance for yield throughout different environments (Akcura and Kaya, 2008). This concept of static stability is not acceptable for the majority of breeders and agronomists who prefer high yield genotypes that have the potential to respond to inputs or environmental conditions (Farshadfar et al., 2012). The stability estimators of each group discriminated on the basis of stable genotypes in the same manner. This study demonstrated that simultaneously considering both yield and stability in a graph helps to identify genotypes with high yield and a stable behavior, as Kang (1998) and Karimizadeh et al. (2012) pointed out. The non-parametric methods used here can be used in any other crop where genotypes are evaluated in different environments (locations or years).
Conclusions
The genotypes V99-213, V99-236 and V00-50 proved to be promising due to their yield and stability according to all of the non-parametric statistics.
The mean cane yield (TCH) presented a positive association with the TOP, NPI(2), NPI(3) and Si(6) stastitics.
The principal component analysis grouped the statistics into two groups. The first group (G1), formed by the TOP, NPI(4), NPI(2), NPI(3), Si(3) and Si(6) statistics, was located under the concept of dynamic or agronomic stability since they are associated with yield. The other group (G2), formed by the NPI(1), Si(1), Si(2), DE and RS statistics, fell within the static or biological stability concept.
Literature cited
Abdulahi, A., R. Mohammadi, and S.S. Pourdad. 2007. Evaluation of safflower (Carthamus spp.) genotypes in multi-environments trials by nonparametric methods. Asian J. Plant Sci. 6, 827-832. Doi: 10.3923/ajps.2007.827.832 [ Links ]
Akcura, M. and Y. Kaya. 2008. Nonparametric stability methods for interpreting genotype by environment interaction of bread wheat genotypes (Triticum aestivum L.). Genet. Molec. Biol. 4, 906-913. Doi: 10.1590/S1415-47572008005000004 [ Links ]
Balalić, I., M. Zorić, V. Miklič, N. Dušanić, S. Terzić, and V. Radić. 2011. Nonparametric stability analysis of sunflower oil yield trials. Helia 34, 67-77. Doi: 10.2298/HEL1154067B [ Links ]
Delić, N., G. Stanković, and K. Konstatinov. 2009. Use of non parametric statistics in estimation of genotypes stability. Maydica 54, 155-160. [ Links ]
Di Rienzo, J.A., F. Casanoves, M.G. Balzarini, L. González, M. Tablada, and C.W. Robledo. 2015. InfoStat versión 2014. In: Grupo InfoStat, FCA, Universidad Nacional de Córdoba, www.infostat.com.ar; consulted: May, 2015. [ Links ]
Farshadfar, E., N. Mahmudi, and A. Sheibanirad. 2014. Nonparametric methods for interpreting genotype×environment interaction in bread wheat genotypes. J. Bio. & Env. Sci. 4, 55-62. [ Links ]
Farshadfar, E., S.H. Sabaghpour, and H. Zali. 2012. Comparison of parametric and non-parametric stability statistics for selecting stable chickpea (Cicer arietinum L.) genotypes under diverse environments. Aust. J. Crop Sci. 6, 514-524. [ Links ]
Fox, P.N., B. Skowmand, B.K. Thompson, H.-J. Braun, and R. Cormier. 1990. Yield adaptation of hexaploid spring triticale. Euphytica 47, 57-64. Doi: 10.1007/BF00040364 [ Links ]
Gauch, H.G. 2006. Statistical analysis of yield trials by AMMI and GGE. Crop Sci. 46, 1488-1500. Doi: 10.2135/cropsci2005.07-0193 [ Links ]
Huehn, M. 1990. Nonparametric measures of phenotypic stability: II. Applications. Euphytica 47, 195-201. Doi: 10.1007/BF00024242 [ Links ]
Kang, M.S. 1988. A rank-sum method for selecting high-yielding, stable corn genotypes. Cereal Res. Comm. 16, 113-115. [ Links ]
Kang, M.S. and H.N. Pham. 1991. Simultaneous selection for high yielding and stable crop genotypes. Agron. J. 83, 161-165. Doi: 10.2134/agronj1991.00021962008300010037x [ Links ]
Karimizadeh, R., M. Mohammadi, N. Sabaghnia, and M.K. Shefazadeh. 2012. Using Huehn's nonparametric stability statistics to investigate genotype × environment interaction. Not. Bot. Horti. Agrobo. 40, 195-200. [ Links ]
Kaya, Y. and S. Taner. 2003. Estimating genotypic ranks by nonparametric stability analysis in bread wheat (Triticuma estivum L.). J. Central Eur. Agric. 4, 47-54. [ Links ]
Ketata, H.Y., S.K. Yau, and M. Nachit. 1989. Relative consistency performance across environments. pp. 391-400. In: Proc. International Symposium on Physiology and Breeding of Winter Cereals for Stressed Mediterranean Environments. Montpellier, France. [ Links ]
Kiliç, H., M. Akçura, and H. Aktaş. 2010. Assessment of parametric and non-parametric methods for selecting stable and adapted durum wheat genotypes in multi-environments. Not. Bot. Horti. Agrobo. 38, 271-279. [ Links ]
Mahtabi, E., E. Farshadfar, and M.M. Jowkar. 2013. Non parametric estimation of phenotypic stability in chickpea (Cicer arietinum L.). Intl. J. Agri. Crop Sci. 5, 888-895. [ Links ]
Mohammadi, R. and A. Amri. 2008. Comparison of parametric and nonparametric methods for selecting stable and adapted durum wheat genotypes in variable environments. Euphytica 159, 419-432. Doi: 10.1007/s10681-007-9600-6 [ Links ]
Mohammadi, R., A. Abdulahi, R. Haghparast, M. Aghaee, and M. Rostaee. 2007. Nonparametric methods for evaluating of winter wheat genotypes in multi-environment trials. World J. Agric. Sci. 3, 137-142. [ Links ]
Nassar, R. and M. Hühn. 1987. Studies on estimation of phenotypic stability: tests of significance for nonparametric measures of phenotypic stability. Biometrics 43, 45-53. Doi: 10.2307/2531947 [ Links ]
Parmar, D.J., J.S. Patel, A.M. Mehta, M.G. Makwana, and S.R. Patel. 2012. Non - parametric methods for interpreting genotype x environment interaction of rice genotypes (Oryza sativa L.) J. Rice Res. 5, 17-25. [ Links ]
Ostengo, S., M.B. García, C. Díaz R., N. Delgado, J.V. Díaz, and M.I. Cuenya. 2011. Evaluación de la estabilidad de un cultivar de caña de azúcar (Saccharum spp.) en diferentes ambientes agroecológicos a través de una técnica no paramétrica en Tucumán, R. Argentina. Rev. Ind. Agric. Tucumán 88, 21-26. [ Links ]
Rea, R., O. De Sousa-Vieira, A. Díaz, M. Ramón, R. Briceño, J. George, and M. Niño. 2014. Interacción genotipo-ambiente en caña de azúcar mediante los modelos AMMI y regresión de sitios en Venezuela. Rev. Fac. Agron. (LUZ) 31, 362-376. [ Links ]
Sabaghnia, N., H. Dehghani, and S.H. Sabaghpour. 2006. Nonparametric methods for interpreting genotype × environment interaction in lentil genotypes. Crop Sci. 46, 1100-1106. Doi: 10.2135/cropsci2005.06-0122 [ Links ]
Sabaghnia, N., R. Karimizadeh, and M. Mohammadi. 2012. The use of corrected and uncorrected nonparametric stability measurements in durum wheat multi-environmental trials. Span. J. Agric. Res. 10, 722-730. Doi: 10.5424/sjar/2012103-384-11 [ Links ]
Sabaghnia, N., R. Karimizadeh, and M. Mohammadi. 2014. Graphic analysis of yield stability in new improved lentil (Lens culinaris Medik.) genotypes using nonparametric statistics. Acta Agric. Slov. 103, 113-127. Doi: 10.14720/aas.2014.103.1.12 [ Links ]
Sadeghi, M. and E. Farshadfar. 2014. Locating QTLs controlling adaptation in Agropyron using nonparametric stability statistics. Int. J. Biosci. 4, 208-216. [ Links ]
Segherloo, A.E., S.H. Sabaghpour, H. Dehghani, and M. Kamrani. 2008. Non-parametric measures of phenotypic stability in chickpea genotypes (Cicer arietinum L.). Euphytica 162, 221-229. Doi: 10.1007/s10681-007-9552-x [ Links ]
Shukla, G.K. 1972. Some aspects of partitioning genotype-environmental components of variability. Heredity 28, 237-245. Doi: 10.1038/hdy.1972.87 [ Links ]
Thennarasu, K. 1995. On certain non-parametric procedures for studying genotype-environment interactions and yield stability. Indian J. Genet. 60, 433-439. [ Links ]
Zali, H., E. Farshadfar, and S.H. Sabaghpour. 2011. Non-parametric analysis of phenotypic stability in chickpea (Cicer arietinum L.) genotypes in Iran. Crop Breed. J. 1, 85-96. [ Links ]


