


 Inglés (pdf)
 Articulo en XML
 Referencias del artículo
 Enviar articulo por email
 Citado por SciELO
  Citado por Google
  Similares en
SciELO
Similares en
SciELO  Similares en Google
 Permalink
Introduction
The physical properties of soils have high spatial vari ability, both horizontally and vertically, and are subject of continuous changes in natural conditions (Bravo and Andreu, 2011). Similarly, a need to know soil properties and changes in detail, make of tools such like geostatistics very relevant (Marques et al., 2014) as they allow the study of the spatial distribution of soil properties such as moisture and compaction (Zucco et al., 2014), because changes in cover and land use cause changes in these properties (Rojas and Ibarra, 2013). Understanding this variability will define limiting factors and establish practices for the management and conservation of soil (Muñoz et al., 2006).
Despite the increase in research on soil properties, the water distribution process and methods to predict the content of soil moisture remain open to study because of the high spatial and temporal variability, along with some factors that determine and are correlated with it (Brocca et al., 2012), such as topography, parent material, plant cover and land use. These in turn affect soil processes such as oxygen circulation, temperature and mechanical strength and very important properties such as particle size, soil structure, hydraulic conductivity, infiltration, runoff, and erosion (Zucco et al., 2014), making moisture one of the more important factors that affect soil compaction processes (Vaca et al., 2014).
Soil compaction is an important factor in the degradation of soils, it is manifested as a reduction in the volume of soil and an increase in bulk density, decreasing the porosity of the soil and affecting the shape and size distribution of the pores (Barik et al., 2014). Hamza and Anderson (2005) considered certain physical properties of soils as the main parameters used to characterize compaction, these are bulk density, resistance to penetration and water infiltration into the soil. The determination of the resistance to pene tration is currently the most widely used one in assessing the state of soil compaction and is also the best estimate of mechanical difficulty for the root growth of plants in soil (González et al., 2015); knowledge on the spatial variability of penetration resistance is useful for identifying problems of soil compaction in specific places Also, it allows the development of management options to minimize the negative impact on the environment generated by land use and use conflicts (Usowicz and Lipiec, 2009).
Similarly, Rojas and Ibarra (2013) concluded that a mulched soil directly influences the variability of soil properties, with soils with a forest cover having lower values of bulk density and increased amounts of bases and organic matter, as compared to agricultural land use. Likewise, Fang et al. (2016) found that different land uses had varying moisture; however, they mentioned that the climate factor greatly determines the moisture content.
Therefore, the objective of this study was to evaluate the spatial variability of moisture and soil compaction in the Ombachita District of the municipality of Sogamoso (Boyaca, Colombia) according to the different covers, in order to establish the impact of the soil use on these physi cal properties.
Materials and methods
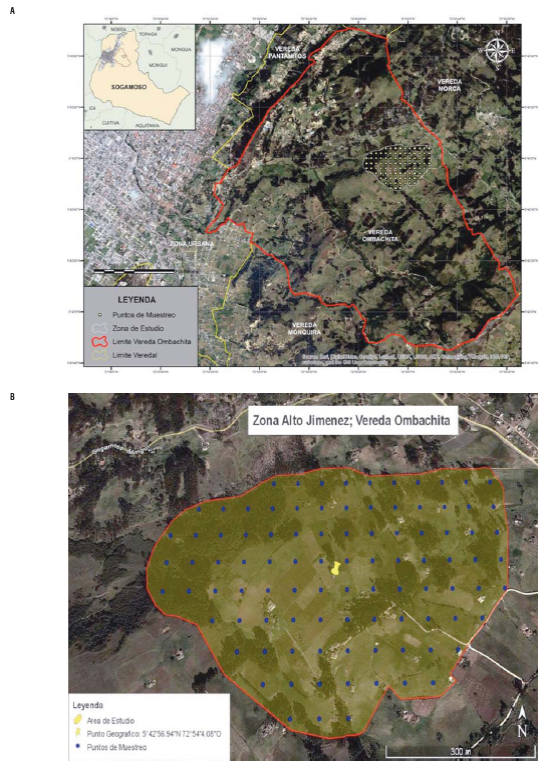
The study was conducted in the department of Boyaca (Colombia), municipality of Sogamoso, Ombachita Dis trict in the high Jimenez sector, located at the geographic coordinates 5°48'58" N, 72°53'57" W. The study area had 34.18 ha (Fig. 1a). For the methodological design, a sample of 95 georeferenced points was taken and placed in a mesh with a distance of 60 m between points (Fig. 1b). The points were taken following a rigid network methodology, so that the location was a representative value of the plant cover in the sampling area.
The soil description was done using the cartographic da tabase of the Sistema de Información Ambiental Territorial (SIAT) 2012 and soils general study in Boyaca (IGAC, 2005), seeking the plate and placing the sampling area in order to determine the representative soils of the study area. As for the cover, the description was done using the Corine Land Cover methodology, which describes, characterizes, classifies and compares the characteristics of the plant cover, interpreted with the use of spatial resolution satellite image of 30 x 30 m.
The variables were measured directly in the field. At each selected sampling point, the volumetric moisture and compaction were measured and expressed as the penetra tion resistance of the soil. The moisture was measured at different depths (4, 8, 12, 20 cm) using a portable moisture soil sensor FieldScout TDR 100 (Spectrum Technologies, Aurora, IL). For the determination of the penetration resistance, a digital cone penetrometer FieldScout SC 900 (Spectrum Technologies, Aurora, IL) was used, which relates the force necessary to introduce into the ground a conical tip normalized by the section of the base of the cone to a depth limit, recording the pressure applied in Pascals every 2.5 cm, in this case to a depth of 20 or 30 cm depending on the soil resistance.
With the data, a descriptive statistical analysis was carried out, which evaluated the mean, median, variance, covari-ance, standard deviation, coefficient of variation (CV) and kurtosis. Similarly, a normality test was done using the Kolmogorov-Smirnov goodness of fit test for each variable in order to determine the degree of central tendency of the data. A CV analysis was performed based on the scale used by Garzón et al. (2010), which indicates low variability for CV values below 12%, average variability for CV between 12% and 60% and high variability for CV over 60%. The linear correlation analysis was done with Pearson's correla tion. For the above, SAS® v.9.4 (SAS Institute Inc., Cary, NC) was used.
To determine the spatial variability of the evaluated soil properties, a geostatistical analysis, which included fitting the data to semivariogram theoretical models, normalization and kriging interpolation was used. GS+™ 5 (Gamma Design Software, Plainwell, MI) was used for the semivariograms and maps.
The spatial autocorrelation of the variables and the correla tion between the variables were performed using the theory of regionalized variables proposed by Oliver and Webster (2015), in which a data group is fit to a semivariogram theoretical model y (h), defined by the following equation:
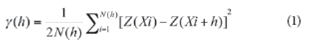
Where
j(h): semivariance
N(h): number of separated point pairs at a h distance
Z(Xi): attribute value at the Xi location
Z(Xi+h): attribution value at a h distance at the Xi +h location
Results and discussion
Descriptive analysis
The penetration resistance (PR) showed an abnormal beha vior at depths of 0 cm and 2.5 cm (Tab. 1) according to the Kolmogorov-Smirnov normality test; however, normality is not a mandatory requirement for the analysis of geostatistical data. Nevertheless, if the data are normal, they provide Kriging estimates with best fit (Glendell, 2014). The PR at these two depths (0 and 2.5 cm) showed a platykurtic data distribution with positive skewness and higher coefficients of variation 85.41 and 59.86%, respectively, which is similar to the CV reported by Cortes et al. (2013), who found values of 88.25% at a depth of 1 cm. This variation in the PR is attributed to the influence of the moisture content on the soil (r2=0.37) and the particle size (Zhao et al., 2007), resul ting in different CVs, depending on the area and moisture content. The mean values ranged from 0.717 MPa to 1.385 MPa, lower than what was found by Villazón et al. (2015), who found higher values (3 MPa) at depths of 0 to 10 cm and pointed out that this variation is due to the different uses and management of the soils.
TABLE 1 Descriptive statistics of the variables measured.
| Parameter | Mean | Median | Minimum | Maximum | Asymmetry | Kurtosis | CV | N |
|---|---|---|---|---|---|---|---|---|
| PRO (MPa) | 0.717 | 0.482 | 0.035 | 2.229 | 0.99 | -0.22 | 85.41 | * |
| PR25 (MPa) | 1.385 | 1.219 | 0.070 | 3.964 | 0.44 | -0.38 | 59.86 | * |
| PR50 (MPa) | 2.534 | 2.597 | 0.157 | 5.116 | -0.21 | -0.03 | 40.69 | ns |
| PR75 (MPa) | 2.951 | 2.931 | 0.368 | 4.950 | -0.39 | -0.27 | 35.16 | ns |
| PR100 (MPa) | 3.042 | 3.054 | 0.105 | 5.968 | 0.06 | -0.17 | 36.31 | ns |
| H4 (%) | 42.94 | 42.00 | 15.80 | 83.10 | 0.40 | 1.16 | 25.43 | ns |
| H8 (%) | 29.79 | 29.20 | 6.60 | 64.50 | 0.45 | 1.23 | 31.42 | ns |
| H12 (%) | 18.69 | 18.50 | 1.50 | 44.20 | 0.41 | 1.17 | 36.99 | ns |
| H20 (%) | 12.19 | 12.00 | 1.00 | 31.80 | 0.46 | 1.09 | 43.38 | ns |
PRO: penetration resistance at 0 cm; PR25: penetration resistance at 2.5 cm; PR50: penetration resistance at 5.0 cm; PR75: penetration resistance at 7.5 cm; PR100: penetration resistance at 10 cm; and water content in depth (H4: moisture at 4 cm; H8: moisture at 8 cm; H12: moisture at 12 cm; and H20: moisture at 20 cm). N: Normality test of Kolmogorov-Smirnov; CV: coefficient of variation; ns: not significant; *: significant for normality (P<0.01).
When analyzing the PR at 5, 7.5 and 10 cm, there was a normal behavior with a similar mean and median and a platykurtic curve and negative asymmetry for the depths of 5 and 7.5 and positive for 10 cm. There were average values of 2.53, 2.95 and 3.04 MPa, respectively, showing that as the depth increased, the PR increased, because of the presence of clay layers in the soil, which make the soil compaction increase; similarly, these variables showed an average CV variation, between 25% and 45%. Similarly, Cortés et al. (2013) found average PR values of 1.53 MPa and CV values of 46.28%, before plowing, and 2.72 MPa and 38.64% after harvesting in a corn crop, and explained that the variation could possibly be due to the intensive use of machinery and the influence exerted by rainfall and irrigation during the growing season.
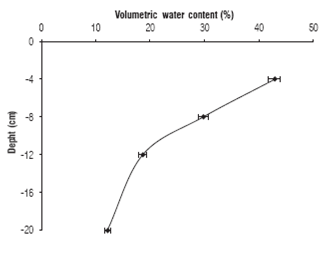
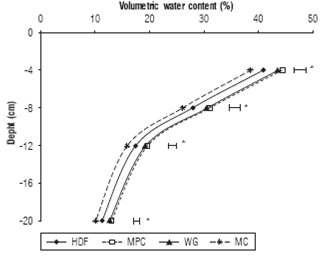
The moisture contents measured at different depths (4, 8, 12 and 20 cm) had a normal behavior, a positive skewness and a leptokurtic distribution, indicating a greater con centration of data around the average. The moisture had an inversely proportional behavior to the depth, it went from values of 42.94% at 4 cm to 12.19% at 20 cm (figure 2), contrary to the findings of Largaespada and Henriquez (2015) who reported average moisture values measured with a TDR of40.89% in the first 30 cm of the soil. The CV ranged between 25% and 45%, consistent with the findings of Guatibonza et al. (2009) and Cucunubá-Melo et al. (2011) who reported average CV values of 25.46% and 34.85%, respectively. Although, the results match those reported by other authors, it could be said that these values varied depending on the soil type and the time when this variable was measured.
Analysis by cover
29.1 ha were mapped, corresponding to the area of the sampling grid, as shown in table 2. The cover predomi nated the study area was a Mosaic of pastures and crops (MPC), 30.1%, with 8.8 ha, followed by high dense forest (HDF) with 28.1%, 8.2 ha; this cover consisted of Eucalyp tus globulus forests of different ages, whose output is sold primarily for the production of logs, which are used in the construction of scaffolding for coal mines in surrounding the area. The cover occupying the rest of the sampled area included weedy grasses (WG), 18.3%, a mosaic of crops (MC), 21.1%, and discontinuous urban sprawl (DUS), 2.4% of the total area.
TABLE 2 Description of the plant cover found in the study area.
| Cover | No. sample points | % | Area (ha) |
|---|---|---|---|
| Mosaic of pastures and crops | 31 | 30.1 | 8.8 |
| Firm soil, high, dense forest | 24 | 28.1 | 8.2 |
| Weedy grasses | 23 | 18.3 | 5.3 |
| Mosaic of crops | 19 | 21.1 | 6.2 |
| Discontinuous urban sprawl | 0 | 2.4 | 0.7 |
| Total | 97 | 100 | 29.2 |
The different evaluated variables were arranged in a completely randomized design with different repetitions depending on the number of points for each variable and the different covers in the area were established as treat ments, thereby proceeding with the analysis of variance, finding that there were only significant differences between the treatments for the PR25 variable, while for the other variables, the differences were not significant. For PR25, a Duncan test was done, taking into account that the treatments did not have the same number of repetitions or sampled points, which was not significantly different between the HDF, MPC and WG covers, which had the highest PR value, but there were significant differences for these for the MC cover, which had lower values (Fig. 3). This difference could be due to the fact that the MC cover had human intervention (mechanization, tillage and others), changing the physical properties, which is consistent with that reported by Sanchez-Saenz et al. (2010), who reported that the tillage system used on the soil influences the dis tribution of organic matter and modifies the mass-volume ratio, the amount of water in the soil and the structure and soil temperature.
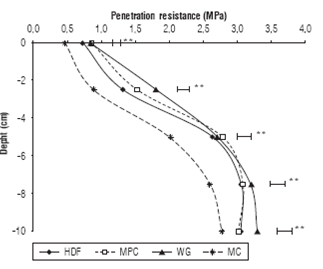
FIGURE 3 Penetration resistance for the different studied covers. Error bars indicate standard error. ** indicate significant differences accor ding to the Tukey test (P<0.01).
The moisture values were not significantly different in the research covers; however, it was evident that the lower moisture values were in the HDF cover (Fig. 4) since Eu calyptus is a species that absorbs more water, which is why the moisture was lower in those areas. Guatibonza et al. (2009) also reported lower moisture values where there Eucalyptus, finding values between 16% and 28%, likewise, González et al. (2015) also found values between 8% and 24.8% with Eucalyptus, indicating that the moisture con tents remain with low values longer probably because of the presence of trees that require a large amount of water.
Geostatistical analysis
Each variable was fit to a semivariance model; Table 3 shows the parameters of the estimated semivariograms. The classification of the spatial dependence was done ac cording to the methodology used by Garzón et al. (2010), in which the degree of dependence is determined by the relationship between the nugget effect and the plateau [C0/ (C0+C)], so that it is strong when it is less than 25%, mode rate between 25% and 75% and weak when it is greater than 75%. Thus, the PR0 and PR100 variables had a weak spatial dependence; PR25, PR50 and PR75 strong dependence and moisture at the different depths, demonstrating moderate dependency. Similarly, Usowicz and Lipiec (2009) found a degree of weak spatial dependence in the first cm of the soil, while at a deeper depth, the degree of spatial dependence was stronger, which was attributed to frequent trampling by livestock, increased mechanical traffic and presence of roots in this zone, which helps the data observed for the PR that was more heterogeneous than at other depths.
TABLE 3 Semivariogram parameters fit for the measured variables.
| Parameter | Model | Co | Co + C | Range (m) | Co/(Co+C) | R2 | VC |
|---|---|---|---|---|---|---|---|
| PR0 (kPa) | Linear | 0.342 | 0.396 | 438.25 | 0.866 | 0.722 | x |
| PR25 (kPa) | Exponential | 0.035 | 0.682 | 106.80 | 0.051 | 0.806 | x |
| PR50 (kPa) | Exponential | 0.041 | 1.041 | 108.90 | 0.039 | 0.873 | x |
| PR75 (kPa) | Exponential | 0.072 | 1.081 | 100,80 | 0.066 | 0.390 | x |
| PR100 (kPa) | Linear | 1.229 | 1.229 | 438.16 | 1 | 0.564 | x |
| H4 (%) | Exponential | 66.60 | 158.20 | 957.30 | 0.420 | 0.948 | x |
| H8 (%) | Exponential | 48.40 | 116.78 | 933.00 | 0.414 | 0.951 | x |
| H12 (%) | Exponential | 27.30 | 64.95 | 1008.60 | 0.420 | 0.952 | x |
| H20 (%) | Exponential | 16.35 | 38.55 | 1216.50 | 0.424 | 0.947 | x |
C0: Nugget Effect; C0 + C: plateau; C/(C0+C): ratio between the covariance and the plateau; R2: adjustment coefficient model semivariogram; VC: cross-validation.
The PR value range for the different depths that had a strong spatial dependence showed lower ranges, while the PR with a weak spatial dependence had a greater range. It should be analyzed whether the spatial dependence of penetration resistance is also influenced by other soil and environmental characteristics, such as organic matter content, type of root system, and mechanization, among others; the above is consistent with that reported by Me dina et al. (2012), who evaluated resistance to penetration at different depths and found ranges between 14 and 107 m, which means that, at a greater depth, the PR will have a greater range and hence a greater spatial dependence, because there is less weathering.
The moisture measured at different depths (4, 8, 12 and 20 cm) presented a moderate spatial dependence because the ratio of the plateau and the nugget effect was between 25 and 75% and ranged between 900 and 1,200 m, contrary to that found by Cucunubá-Melo et al. (2011), who reported weak variability with values near 100% and ranges of 117 m. These moisture variables were fit to exponential semi-variogram models with correlation coefficients close to 1. Guatibonza et al. (2009) and Cucunubá-Melo et al. (2011) reported fit to spherical models, but with lower correlation coefficients. In this regard, Zucco et al. (2014) stated that the moisture contents depend on soil conditions (organic matter content, slope and particle size) that vary locally, which results in changes at a shorter distance than other characteristics.
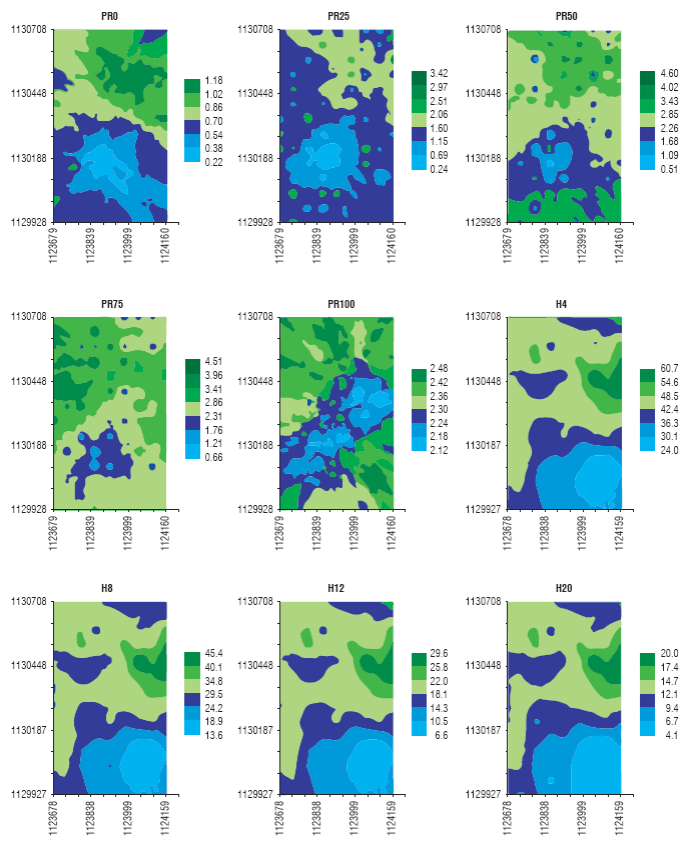
Spatial distribution
Figure 5 shows the maps of the spatial distribution for each variable, obtained with ordinary Kriging. The contour maps confirmed the relationship between the analyzed variables and the other existing spatial variability in the soil, making it necessary to use localized soil manage ment practices, according to the site conditions and crop requirements, with the aim of reducing production costs and preventing soil degradation caused by conventional management (Da Silva et al., 2010).
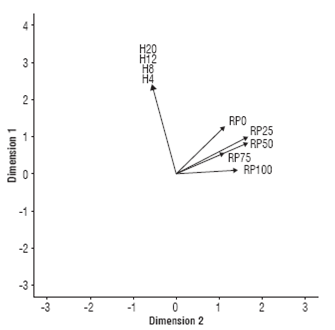
Multiple linear correlation
Figure 6 shows the correlation between the evaluated variables. The PR and moisture at different depths varied inversely with each other, i.e. a smaller amount of water in the soil means higher PR values. The PR is an indirect measure of the force exerted by the roots via the soil to grow and absorb water and nutrients, such that when the PR is low and soil conditions with excess moisture predominate, the PR may also be an indicator of the availability of oxygen to the roots, establishing whether hypoxia problems occur in the plant (Dat et al., 2004).
Conclusions
It was found that, as the depth increase, the PR increased, while the volumetric moisture presented an inversely pro portional behavior to the depth. The cover that prevailed in the study area was a mosaic of pastures and crops (MPC), 30.1%. The moisture values were lower in the area planted with eucalyptus. The PR had a higher spatial dependence at the greater depth, while the moisture had a moderate dependence at the different depths.

