


 Inglês (pdf)
 Artigo em XML
 Referências do artigo
 Enviar este artigo por email
 Citado por SciELO
  Citado por Google
  Similares em
SciELO
Similares em
SciELO  Similares em Google
 Permalink
Introduction
The increase in the frequency and intensity of extreme weather events has led to frequent conditions of water excesses and deficiencies with negative impacts upon agricultural production (IPCC, 2012) due to the reduced growth and development of plants because of water stress (Moreno, 2009; Fischer et al., 2016) and increased incidence of pests, diseases, and weeds (Seidel, 2016; Corpoica, 2013). Water deficiencies and droughts, associated to the El Niño phenomenon of 1997-1998 and considered one of the most severe in recent years, generated losses in the national economy in the order of US$563.5 million, which repre sented close to 1% of the national Gross Domestic Product (GDP) for 1998 and affected negatively close to 0.5% of the country's economic growth (UNGRD, 2014).
The Colombian Caribbean suffers even more prolonged dry periods. The most frequent occurrence of the events of warming and abnormal cooling of the surface waters of the equatorial Pacific Ocean (events known as "El Niño " and " La Niña", respectively) will also cause more frequent and severe periods of scarce or excessive rains. Repelón, located in Colombian dry Caribbean, derived much of its sustenance from agricultural activities like the tomato crop, an important and traditional product in the region, how ever the limited environmental offer of South of Atlantico department (tropical dry forest and arid soils) restrict the agricultural activities despite the existence of water sources and irrigation systems.
Given this scenario, agroclimatic zoning of the territory constitutes a risk management strategy that guides the implementation of prevention and adaptation measures upon adverse weather conditions (Brunini et al., 2010). It is a key tool to determine the agricultural potential, territorial planing, and soil management in agricultural production areas (Yazdanpanah et al., 2001; Brunini et al., 2009).
Currently, diverse agroclimatic zoning approaches has al lowed the implementation of public policy for agricultural development. Those mainly include the assesment of ag-roclimatic risk through agroclimatic indices like proposed by Zullo et al. (1999). They employed water availability in reproductive states of cotton to zone agroclimatic risk in Säo Paulo (Brazil), especially against drought conditions. Yazdanpanah et al. (2001) defined areas with higher agroclimatic suitability for rain fed almond and the ag-roclimatic zoning of the province of Azarbayjan-Sharghi (Iran) by calculating indices. White et al. (2001) considered the relationship between rain and potential evaporation, minimum and maximum temperatures within the agro-climatic characterization of areas of wheat production in Ethiopia. Geerts et al. (2006) mapped the agroclimatic suitability for the quinoa crop in the Bolivian plateau from the reference evapotranspiration, the duration of the rain season, periods of drought, and risk of frost. Moeletsi et al. (2011) introduced the Poone Agroclimatic Suitability Index (PACSI) to integrate the most important climatic risks for maize production in Free State, South Africa.
In general, most agroclimatic zoning methodologies, which consider the soil within their analysis, include information from water-storage capacity parameters or from physical-chemical aspects, but not an integration of both. Due to the aforementioned, the aim of this work was to establish an agroclimatic zoning methodology that include the crop-specific soil suitability in terms of physical-chemical offer and water balance in terms, in this case, of water defi cit for crop. Despite that the methodology was applied in the municipality of Repelón in the department of Atlantico it can use in all the territory and for different agricultural species in Colombia.
Materials and methods
Study zone
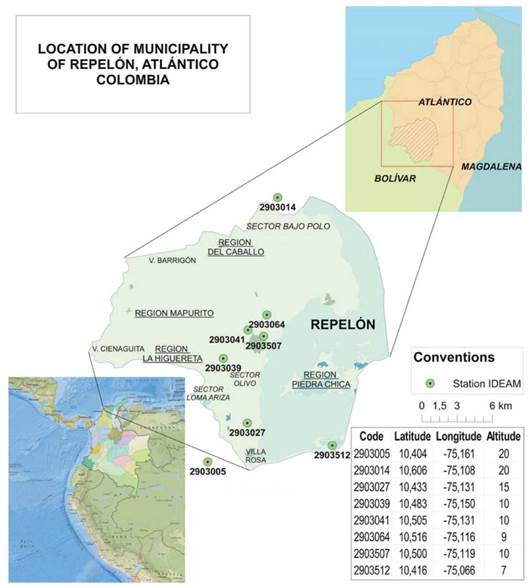
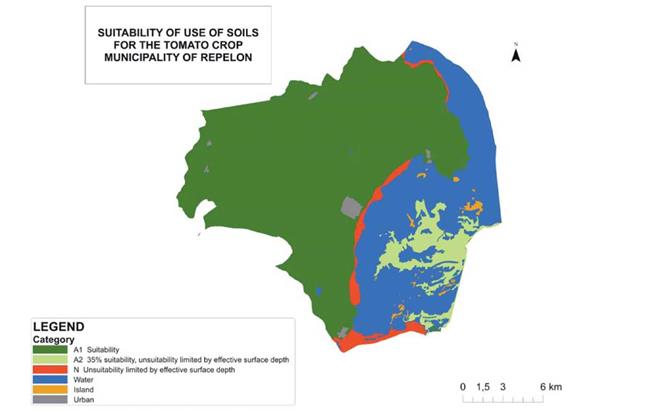
The municipality of Repelon (Fig. 1) is located to the west of the department of Atlantico, between coordinates 75°01' and 75°15' longitude west and 10°23' and 10°36' latitude north, with altitudes ranging between 30 and 540 m a.s.l. Its surface area covers 35,172 ha (10.6% of the total area of the department of Atlantico) and the predominant landscape is that of hills with 40% of the area, followed by flatlands with 31%. The Guájaro reservoir stands out, a lentic body of over 9,500 ha.
Approach
Zoning of agroclimatic suitability was conducted by bea ring in mind the definition of agroclimatic risks (IPCC, 2012), based on the crop's exposure to extreme weather events (defined by its location in the territory) and the species' sensitivity to water stress. The methodology was based on overlaying two types of analysis for the crop. The first for crop-specific soil suitability assessment (FAO, 1976) and the second for probability of occurrence of water deficit in the soil (Palmer, 1965) during the phenological stages of the crop. The areas of lower agroclimatic risk, denominated Productive Niches indicate agroclimatic characteristics (per soil and climate) of lower restriction for tomato production.
Crop-specific soil suitability assessment
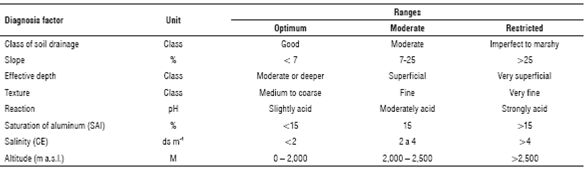
The methodology proposed by FAO (1976) was used at 1:100,000 scale, which confronted the edaphological requirements of tomato crop (Tab. 1) and the soil offer described in the units of land (UoL) presents in Repelon. Crop requirements were obtained from secondary sources and interviews with technicians, local farmers, and resear chers from the Colombian Corporation for Agricultural Research (Corpoica). The characteristics of the UoL were obtained from the general study of soils for the department of Atlantico (IGAC, 2007). Characteristics related to the genesis and evolution of the soil units were used, as well as chemical pH variables, aluminum saturation, and salinity.
TABLE 1 Edaphological requirements for the tomato crop, after Carrillo and Raish (1988) and García etal. (2004).
Thereafter, with this information decision trees were gen erated to qualify the suitability of use of the UoL for the tomato crop into three categories: "optimum" (A1): the characteristics of the soils evaluated are within adequate ranges; "moderate" (A2): the soils present one or two re quirements that do not correspond to the most adequate values; "marginal" (A3): corresponds to soils with one or more restricted characteristics to establish the crop and the class "unsuitable"; (N): soils with very restrictive conditions for the crop's establishment and adaptability.
Probability of humidity occurrence of water deficit in soil
The probability was calculated from the monthly historical series of the Palmer drought severity index (PDSI) (Palmer, 1965) during a 32-year period (1980 to 2011). The calcu lation of the Palmer index was generated by interpolating the monthly averages of precipitation and reference crop evapotranspiration rate (ETo) (FAO, 2006) calculated with the monthly historical series of the variables of mean maximum temperature, mean minimum temperature, re lative humidity, and sun shine registered by eight stations belonging to the meteorological observation network of the Institute of Hydrology, Meteorology, and Environmental Studies (IDEAM) available in the area of analysis (Fig. 1).
The series were subjected to a quality process and comple mentation of missing data that included four stages: a) verification of the physical and statistic coherence (spatial and temporal) of the climatic series (Guijarro, 2011); b) homogeneity analysis of the series (Alexandersson test); c) complementation of missing data (Guijarro, 2011), and d) validation of the general quality control process (Mc-Cuen test).
The water storage capacity in the soil (required to calculate the PDSI) was determined from the texture and depth of the profiles and modal horizons of the soil units (IGAC, 2007) where each weather station is located. With the USDA-ARS tool (Saxton and Willey, 2005) the field capacity (FC), permanent wilting point (PWP), and saturation point (SP) values were assigned to each texture and modal class identified.
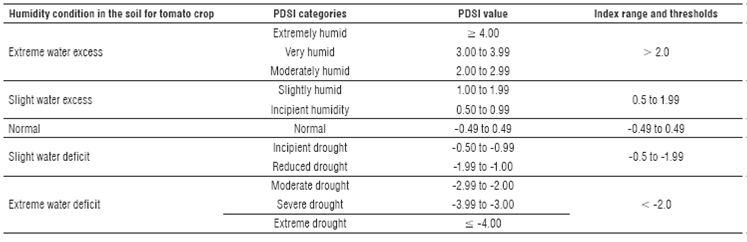
The PDSI qualifies soil humidity qualitatively at monthly level into 11 categories that range from extreme humidity to extreme drought (Tab. 2). Bearing in mind this quali fication and the crop's sensitivity to the stress caused by water deficiencies in the soil (Rao et al., 2000), the PDSI categories were defined, which indicate extreme restrictive soil humidity conditions for the crop (extreme deficiencies that cause partial or permanent damage to the crop). For tomato, it was considered that PDSI values below -2.0 indicate extreme water deficit (Tab. 2).
TABLE 2 Regrouping of PDSI categories under slightly restrictive and restrictive soil humidity conditions for tomato crop.
Monthly frequency of occurrence of extreme water deficit (PDSI < -2.0) values was determined per station for the 32 years of analysis (1980-2011) based on a sample that only included the PDSI categories corresponding to all water deficit conditions (slight and extreme water deficit, values < -0.5).
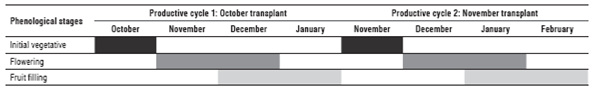
Based on the frequencies obtained per station, the monthly probabilities of occurrence of extreme water deficit in soil were determined for months corresponding to the produc tive cycles and modal phenological calendars of the tomato crop reported by technical assistants and producers from the municipality (Tab. 3).
Five levels were established to qualify the probability of occurrence of extreme condition to October-February. For each level was assigned a letter to facilitate the interpreta tion over the cartography: "A" very low (0 to 20%); "B" low (20 to 40%); "C" medium (40 to 60%); "D" high (60 to 80%), and "E" very high (80 to 100%).
Monthly agroclimatic scenarios
To know the spatial variability of the soil suitability and extreme humidity conditions in the soil for the crop, over laying was carried out of the mapping of crop-specific soil suitability assessment for tomato with the monthly proba bility mapping of occurrence of extreme water deficit. The total of cartographic outputs was established in function of the months corresponding to the productive cycles (October - February) and of the soil's humidity condition.
Zoning of the agroclimatic suitability
Of the total of monthly agroclimatic scenarios generated for water deficit in soil, areas were identified that per sistently registered: a) high probability of extreme water deficit and b) low probability of extreme water deficit in soil. One representative cartographic output was selected for extreme water deficit. Thereafter, to summarize the crop-specific soil suitability assessment outputs, three groups were established: optimum soils or with slight res trictions (A1 and A2), conditioned to practices of manage ment and/or conservation of soils (A3) and unsuitable soils (N). After selecting the map and summarize soil outputs, the municipality's agroclimatic zoning for tomato crop was conducted according to the qualification matrix of Tab. 4.
TABLE 4 Qualification matrix and categories of agroclimatic suitability in a humidity condition of restrictive soil due to extreme hydric deficit for the tomato crop.
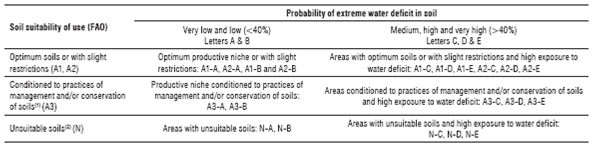
(1) Soils with severe restrictions due to slope, drainage, effective depth, risk of erosion, texture, pH, aluminum saturation.
(2) Marginal and unsuitable soils due to altitude, slope, drainage, effective depth, risk of erosion, texture, pH, aluminum saturation.
Agroclimatic zoning presents six categories of which the "optimum productive niches or with slight restrictions" and the "productive niches conditioned to practices of man agement and/or conservation of soils" represent low risk for the crop, given that they present low or very low prob abilities of water deficiencies, and optimum or moderate soils for the crop. The remaining categories indicate high agroclimatic risk because they present strong limitations due to soil and medium or high probabilities of restrictive humidity conditions for the crop.
Mapping and geo-processing
The results of crop -specific soil suitability assessment and the probability of extreme water deficit were interpreted through functions of spatial analysis of the ArcGIS® 10.1 software and the central data visualization and exploration ArcMap™ tool.
Field validation
The results obtained were validated locally with producers and technical assistants by using Participative Mapping through role play. From basic maps at 1:100,000 scale (watersheds, altitudes, landscapes, slopes, among others), producers and technical assistants zoned the crop-specific soil suitability, the susceptibility of the municipality to water deficiencies and, finally, areas of low agroclimatic risk of the prioritized production systems were identified, that is, optimum productive niches or with slight restric tions and productive niches conditioned to management practices. This methodology reflected the community's perception on the productive suitability of its territory under agroclimatic threats.
Results and Discussion
Climate characteristics
In Repelon, the average rainfall ranges between 700 and 1,300 mm year-1 and it is mainly concentrated in the se cond semester of the year. Mean maximum, mean and mean minimum average annual temperatures reach values close to 34, 30 and 24°C, respectively. The average relative humidity ranges between 75 and 80%, with approximately 2,300 h year-1 of direct sunshine.
Tomato crop-specific soil suitability
A total of 60.6% (21,334 ha) of the surface of the municipa lity of Repelon (35,172 ha) has suitability "A1" (optimum) for tomato cropping. "A2" (moderate) correspond to soils limited principally by effective surface depth (5.7%). 2.85% (1,003 ha) correspond to areas "N" (unsuitable) due to superficial soils for tomato. The municipality of Repelon did not present marginal suitability (A3) for the crop. The remaining area corresponds to bodies of water (9,657 ha) (Fig. 2).
Analysis of agroclimatic scenarios for the tomato crop under extreme water deficit conditions in the soil
A weather characteristic of the region is the frequent occurrence of completely dry periods; the study period (1981-2010) presented nine El Niño events lasting between 6 and 19 months. In Repelon, an El Niño event can cause an average of 36% decrease in rainfall during the dry sea son (December, January, February, and March) and below 12% during the rest of the year. The El Niño event for 1997 presented up to 31% decreased precipitation, which limited water availability for agricultural systems (Corpoica, 2014).
Under a scenario of water deficit in the soil (due to nega tive precipitation anomalies), a probability prevails below 40% of extreme water deficit in soil for the crop during the months of transplant - initial vegetative stage, and fruit fill ing (October and February), both in optimum, moderated and unsuitable soils due to effective depth (B-A1, B-A2, B-N areas) (Fig. 3). However, the probability of extreme water deficit for the crop reach 60% during the flowering and fruit filling months (November to January), mainly in optimum "A1" soils (C-A1 areas). The sector of "Bajo Polo" has the highest probability of occurrence of water deficit in the soil, with values up to 60% during November and January (D-A1 areas). Most of the months conserve a low probability of occurrence of extreme water deficit to the south of the municipality (Villa Rosa), as well as in the sectors of "Olivo", "Loma Ariza" and "La Higuereta".
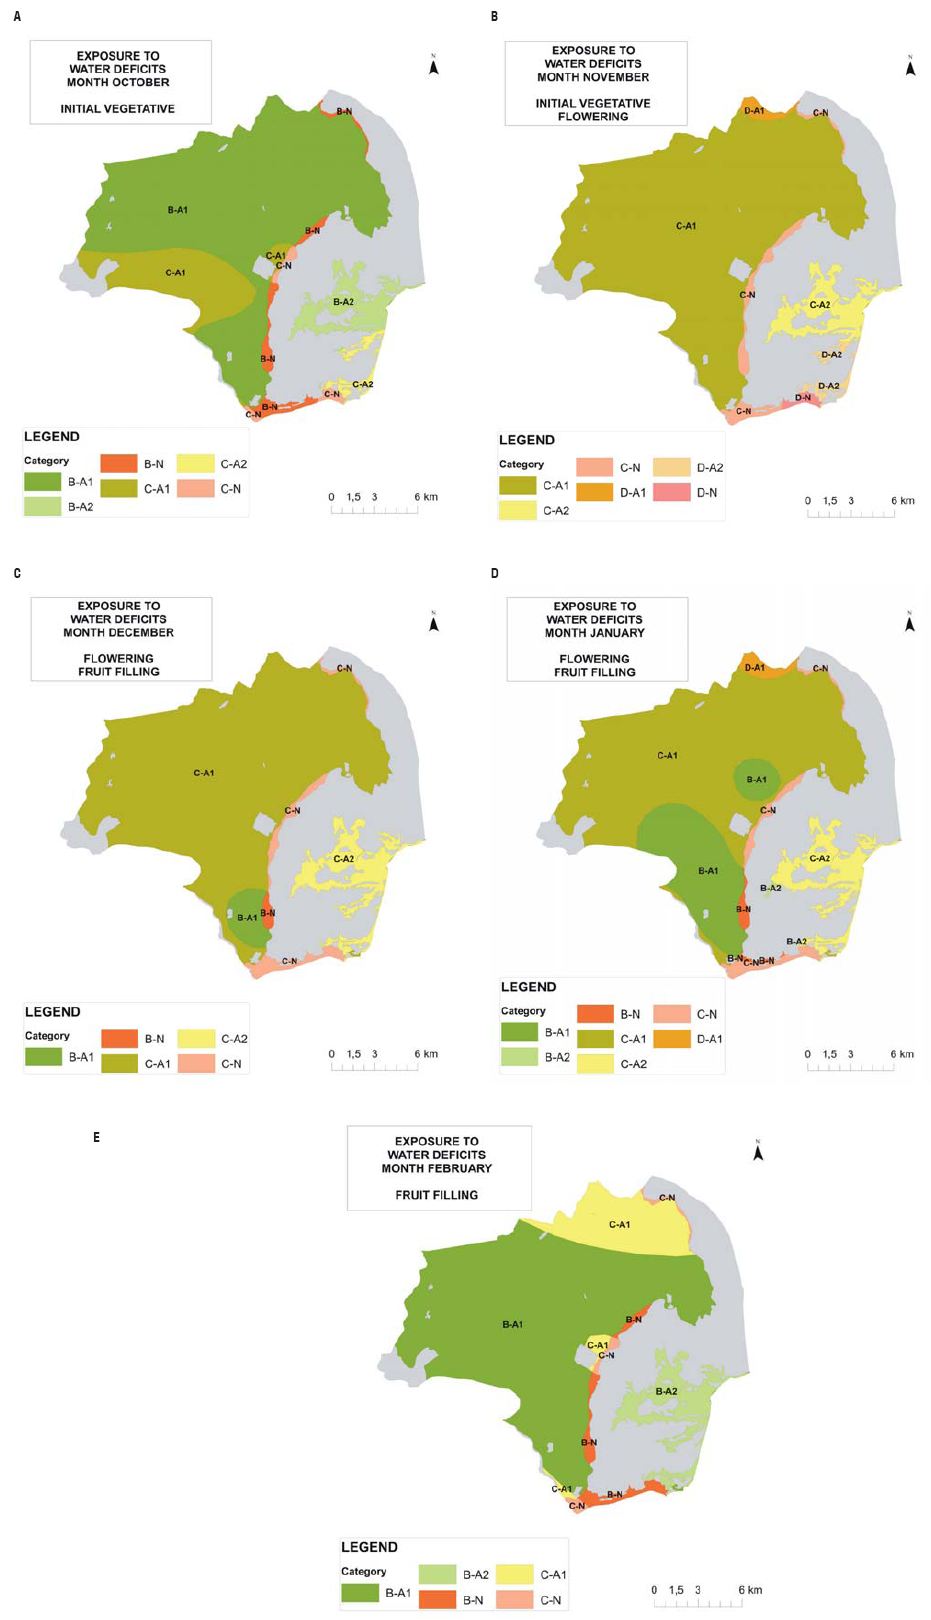
FIGURE 3 Monthly agro-climatic scenarios (October-February) under conditions of extreme water deficiencies in the soil for tomato crop growing in the municipality of Repelon. The first letter of the legend indicates the probability of occurrence of extreme water deficiencies in the soil for the crop: A (0-20%); B (20-40%); C (40-60%); D (60-80%); and E (80-100%). The second letter indicates tomato crop-specific soil suitability: optimum soils (A1), moderate suitability soils (A2), unsuitable due to very superficial soils (N).
In areas with slight soil limitations for tomato crop (A1 and A2), probabilities above 40% of occurrence of water deficit under rainfed farming, restriction in suitability is due to the higher risk of severe water stress for the tomato crop. Rao etal. (2000) indicate that tomato is a species with high sensitivity to water stress, particularly the Rio Grande variety (cultivated in the zone) it presents higher sensitiv ity to water stress compared to other varieties. Under light stress, there is reduced foliar area and number of leaves, rapid decrease of total dry weight, and diminished number of flower buds (Garcia et al., 2004).
Agro climatic suitability under conditions of extreme water deficit in the soil
Under extreme water deficit condition, 5278 ha were identi fied, corresponding to "optimum productive niches or with slight restrictions", which indicates 75% reduction of this area compared to the tomato crop-specific soil suitability map (Fig. 4). This area, considered of low agroclimatic risk, does not present restrictions due to physical-chemical characteristics of the soil and a low probability exists of severe humidity deficiencies for the crop during the growth period from October to February. It is located in the sectors of "La Higuereta", "Olivo", "Loma Ariza" and "Villa Rosa". Some 16,066 ha correspond to "areas with optimum soils or with slight restrictions and high expo sure to water deficit"; these present a high probability of severe water deficit throughout the tomato growth season (October-February) and are mainly located in the sectors of "Polo Bajo, "Del Caballo", "Rotinet", "Mapurito", "Las Tablas", and "Cienaguita". In these areas it is important to implement highly efficient irrigation systems, like drip systems and micro-aspersion, and to plan the frequency of irrigation. Preparation of reservoirs to store water to provide irrigation during critical periods of the crop, use of living or dead coverage, minimum tillage, and use of organic fertilizers can mitigate the impact (UNGRD, 2014).
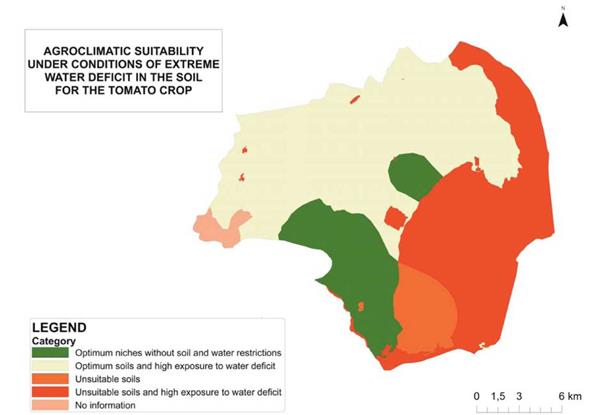
FIGURE 4 Agroclimatic suitability under conditions of extreme water deficit in the soil for the tomato crop in the municipality of Repelon, Atlantico.
Other methodologies propose combinations of physical and chemical properties of the soil with the climate. Ceballos-Silva and Lopez-Blanco (2003) defined the suitability of areas to cultivate corn and potato in central Mexico, by em ploying variables like minimum temperature, maximum temperature, precipitation, soil depth, soil texture, soil pH, soil slope, and altitude. Camargo and Ortolani (1964), Brunini et al. (2008) and Brunini et al. (2010) used annual and monthly weather records to determine parameters like current evapotranspiration, water deficit according to method Thornthwaite-Mather. Particularly, Brunini and Caputi (2001) include the storage capacity of different types of soils to improve the precision of the calculation of the water balance. Geerts et al. (2006), in turn, used the ETo estimated via the FAO Penman-Monteith methodol ogy to determine the aridity index (AI) in the zoning of agroclimatic suitability of the Bolivian plateau for quinoa.
Field validation
Prior to identifying productive niches, producers and tech nical assistants identified the municipality's susceptibility to extreme water deficit in the soil. In these zones it is not recommended to establish tomato crops under events of weather variability, given that this implies greater inves tment in irrigation infrastructure, along with a higher probability of loss of productivity and plants.
Conclusions
The results contribute to identifying productive areas that could be more affected with decreases of precipitation due to weather variability events associated and not associated to El Niño Southern Oscillation (ENSO). Likewise, these results provide a risk picture that supports the implemen tation of public policies that promote issues ranging from the use of irrigation infrastructure to the application of agronomic management practices that mitigate the impact of events of hydric deficit.
This study presents a methodology to identify areas of low agroclimatic risk for agricultural systems through the combination between the suitability of soils (which employs the variables of drainage, slope, effective depth, texture, pH, aluminum saturation, salinity, and altitude) and the prob ability of the soil having restrictive humidity for the crop.
For tomato in Repelon, Atlantico, the agroclimatic suit ability varies depending on the scenario. Upon an extreme event of water deficit in the soil, the suitable area (low agroclimatic risk) for tomato crop is 75% less than the suitable area found with tomato crop-specific soil suitabil ity assessment. These areas should conduct with greater intensity practices and strategies of adaptation to improve the resilience of this production system.
The precision of this approach is conditioned to the avail ability of soil cartographic information that in Colombia is limited to scales of 1:100,000, to weather data - which is only available at monthly scale - to the index used to qualify the humidity in the soil, and to the availability of the crop's eco-physiological information. A closer look at the local reality would be possible by using weather infor mation at daily scale, which permits designing indexes or improving the information with which the indexes applied to the agricultural sector are constructed.
With the participative cartography exercise it was possible to reflect upon the community's perception, knowledge, and experiences on its municipality's productive suitability under conditions of agroclimatic risk (through suitability and availability of water in soils). It was possible to cor roborate the spatial location pattern of the areas denomi nated as "productive niches" for the tomato crop (mainly under events of water deficiency). This indicates that the methodology proposed presents a good approximation to the territorial reality and that the community effectively recognizes the resources, potentialities, and limitations of its territory.

