SciELO - Scientific Electronic Library Online

 
vol.35 número1Accumulation of N, P, and K in the tubers of potato (Solanum tuberosum L. ssp. andigena) under contrasting soils of the Andean region of ColombiaEffect of Eucalyptus globullus biochar addition on the availability of phosphorus in acidic soil índice de autoresíndice de assuntospesquisa de artigos
Home Pagelista alfabética de periódicos  

Serviços Personalizados

Journal

Artigo

Indicadores

Links relacionados

  • Em processo de indexaçãoCitado por Google
  • Não possue artigos similaresSimilares em SciELO
  • Em processo de indexaçãoSimilares em Google

Compartilhar


Agronomía Colombiana

versão impressa ISSN 0120-9965

Agron. colomb. vol.35 no.1 Bogotá jan./abr. 2017

https://doi.org/10.15446/agron.colomb.v35n1.61428 

Suelos, fertilización y manejo de aguas

Effect of fertilization level on water use and production of corn (Zea mays L.) in a cereal producing area in Colombia - a modeling exercise using AquaCrop-FAO

Nivel de fertilización en el uso del agua y la producción de maíz (Zea maiz L.) en Colombia - un ejercicio de modelación AquaCrop-FAO

Javier García A1 

Gerhard Fischer2 

Nestor Riaño H3 

1Faculty of Agricultural Sciences, Universidad de Nariño. Pasto (Colombia). javier@udenar.edu.co

2Department of Agronomy, Faculty of Agricultural Sciences, Universidad Nacional de Colombia. Bogotá (Colombia).

3Programa de Doctorado en Desarrollo Sostenible, Universidad de Manizales, Manizales (Colombia).


ABSTRACT

The effect of the amount of fertilization applied to the corn variety 'ICA V-156' (white grain) was calibrated and validated with the simulator AquaCrop in Cerete (Cordoba, Colombia) at an altitude of 20 m. The fertilization level determined factors related to biomass production, the harvest index, yield and water use, and potential evapotranspiration (Eto). The basic information which calibrated and validated the model came from research conducted in different altitudes in maize growing areas in Colombia. Unexpectedly, the water shortages occurred during the growing season, which the modelling had not considered. Levels of 90 to 60% of fertilization were applied to the crop according to the analysis of the evaluated soil. The information was subjected to an analysis of variance; the results showed that the level of fertilization affected the formation of biomass, harvest index and yield, as well as, the use of water during the growing season. The ETo values were extreme at 0.9 and 7.3 mm day-1. Likewise the total biomass production was 4.64% less at the level of 90 and 25.04% less at 60% fertilization, as compared to the biomass measurements in the field. Similarly, the harvest index was 32.3 and 29.8% for the 90 and 60% levels of fertilization, respectively; on the other hand the grain yield was not affected by the highest level (90%), whereas when the reduction in fertilization was 40%, a decrease of 14.335% in the grain yield was obtained. In addition, per m3 of water 18.87 and 23.02 kg of grain for the fertilization levels of 60 and 90% were formed, respectively.

Key words: Water consumption; evapotranspiration; biomass; yield

RESUMEN

Calibrado y validado el modelo AquaCrop para maíz 'ICA V-156' (grano blanco), en Cereté (Córdoba, Colombia) a una altitud de 20 msnm, se determinó el efecto del nivel de fertilización, en la producción de biomasa, índice de cosecha; rendimiento y uso del agua, en la cual se tuvo en cuenta la evapotranspiración potencial (Eto). La información básica con la que se calibró y validó el modelo, provenía de trabajos de investigación realizados en altitudes diferentes, en zonas productoras de maíz en Colombia. La modelación partió del supuesto de no tener déficit de agua, durante el desarrollo del cultivo, como efectivamente sucedió. Se evaluaron dos niveles, que comprendían el 90 y 60% de la fertilización, enfrentados a la fertilización aplicada al cultivo de acuerdo con el análisis de suelos. El nivel de fertilización afectó la formación de biomasa, índice de cosecha y rendimiento, así mismo, el uso del agua y el ciclo del cultivo. La determinación de la ETo mostró valores extremos de 0,9 y 7,3 mm diarios. La producción de biomasa total fue 4,64% menor para el nivel del 90% y de 25,04% para el 60% de fertilización, en comparación con la medida en campo. El índice de cosecha fue de 32,3 y de 29,8%, para los niveles 90 y 60% de fertilización, respectivamente, de otra parte el rendimiento de grano no se resintió para el mayor nivel (90%), mientras que cuando la reducción en la fertilización fue del 40%, se obtuvo una disminución de 14,335% en el grano. Se formaron 18,87 kg de grano por m3 de agua para el nivel de fertilización del 60% y 23,02 kg para el 90%.

Palabras clave: Consumo agua; evapotranspiración; biomasa; rendimiento

Introduction

Maize (Zea mays L.) is a plant native to America (Fenalce, 2013). It is used for human and animal consumption as grain and forage and in industrial use in the form of pre-cooked flours, oils, starches, and as an energy component in the production of balanced animal feed and recently as biofuel (Paliwal, 2001). Worldwide, maize consumption has been increased over time from 80.000.000 t in 2001 to 110.000.000 t by the year 2011; projections show that by 2020 it could reach 180.000.000 t (OECD/FAO, 2011; USDA, 2012). The 'ICA V-156' is a corn variety developed by the Colombian Agricultural Institute (ICA), corresponding to medium-sized plants of good yield potential, resistant to lodging. The 'ICA V-156' provides white grains (Fenalce, 2013; 2012) (in Colombia two types of corn are grown, yellow and white grain). The studies carried out in the context of global climate change (Breton, 2012.; Biazin and Stroosnijder, 2012; Vico and Porporato, 2011; Geerts et al., 2010; Geerts and Raes, 2009), indicated that within areas of greater vulnerability transitory crops (Baldocchi et al., 2002, 2001) such as corn are planted. For adequate develop-ment and production of corn, 961 mm annually of water are required naturally or artificially (Negrete et al., 2004).

Since water is a limiting factor for obtaining high yields in most crops worldwide (Martins et al., 2013), FAO developed the AquaCrop model (Raes et al., 2011.; 2010), which estimates the growth and yield of crops, using the following main sources of information: water flow (Salemi et al., 2011; Steduto et al., 2007), atmospheric conditions, levels of fertilization, soil fertility and plant variety, among others (Steduto et al., 2005).

From the multiple relationships of the factors that govern the functioning of natural ecosystems and crops, knowledge of the eco-physiological mechanisms are fundamental to understand the models, as these provide mechanistic explanations Parameters associated with the weather offer and link with remote sensors satellite (Chuvieco, 2002; Ceccato et al., 2001; Gates, 1965; Goetz et al., 1999) and forecast models with the cycles of energy, carbon and water, which allow one to assess considerable scales of the behavior of ecosystems and agro-ecosystems (Sun et al., 2009; Fageria, 2005; Riano et al., 2005; Bowman, 1989).

Most models take into account the interception of light through the canopy (Geerts, 2010; Geerts et al., 2010.; Reiko et al., 2010; García et al., 2008), leaf area or leaf area index (LAI) for calculations of development and crop yield (Jones et al., 2003). In the same way, with this information energy balances can be calculated to meet the Penman relations (Penman, 1948). The Penman model operates with 33 types of data related to climate, soil, agricultural techniques and crop characteristics that can be easily handled based on data from research and field information from producers (García, 2014). In AquaCrop, the concentration of carbon dioxide is taken from agronomic research stations and ETo is calculated from climate data (Raes et al., 2011; Steduto et al., 2009). Such techniques of modeling and simulation of crop growth have been used in other countries, with excellent results (Cantor et al., 1995).

In AquaCrop, the coefficient of stress simulates the effect of soil fertility in plant growth and maximum canopy development (Raes et al., 2011; Steduto et al., 2007). Also, the soil fertility coefficient is differentiated by the leaf expansion coefficient, when minimized in the canopy. The model takes into account crop management and fertilization levels employed (Sezen et al., 2011). Nutrient uptake is reduced by the lack of water, and a soil fertility voltage and water productivity coefficient (Ks*WP), ranging between 1 and 0, corrects this situation. Therefore, if soil fertility does not affect the process, Ks*WP is equal to 1 and does not affect WP. The yield (Y) is obtained by multiplying the biomass (B) by the adjusted value of the reference harvest index (HIO) (FAO, 2006).

Fertilization levels of maize crops are diverse, for example, in Costa Rica, Fallas et al. (2011) believe that maize hybrid HC-57 with a yield of7,075 t ha-1 requires 111 kg of nitrogen, 43 kg of P2O5, and 168 kg of K2O. Taboada and Alvarez (2008) suggested that in Argentina, 20 to 25 kg ha-1 uptake of N per ton of grain are produced, and similar amounts for P and K; Melgar et al. (2001) suggested the application of minors nutrients in addition to the major elements.

Several studies exist where Eto has been calculated by various methods (García and Fereres, 2012; Liu et al., 2012.; Raez et al, 2011; Lopez Mata et al., 2010.; Trezza, 2008) but the Penman-Monteith (Penman, 1949) study proposed by FAO provides the best answer to calculate potential evapotranspiration, to determine irrigation needs in diverse crops and, therefore, serve better use of fertilizers for crop nutrition.

The aim of this research was to evaluate, the influence of fertilization level on the production of biomass, yield, and its effects on physiological variables and water consumption of corn 'ICA V-156' at the different stages of growth using the AquaCrop model under conditions in a producing zone of Colombia,.

Materials and methods

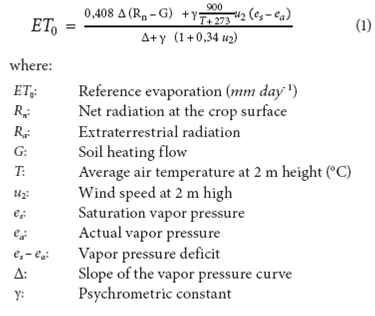
The plant material used for this research was the corn 'ICA V-156', sown at the rate of 44,444 plants/ha in Cerete (Cordoba, Colombia). From this crop material, biometric measurements and production were evaluated. In addition, the calculation of potential evapotranspiration (ETo) on the site was made, and the AquaCrop model defined, based on the Penman-Monteith method as standard reference. For this purpose, planting took place in the second half of the year, and the data of soil radiation, air temperature, air humidity, georeference and wind speed were taken from the weather station at Corpoica (Turipana) and were based on the formula:

The experimental crop information was based on biometric weekly measurements, biomass and grain harvest, and the model took into account the level of fertilization and nutrient cycling. The categories of levels of soil fertility, ranked by the system were defined, considering that these varied from no limitation (non-limiting) to severe limitation (severely limiting) (Raes et al., 2011). These levels were calibrated from the information obtained on the experimental corn crop plots, to compare the production of potential biomass (result of a proper fertilization), and biomass production in the same type of soil with some limiting fertilization. The relationship was evaluated according to the following expression

At the field level, corn fertilization was performed according to soil analysis, and based on simple sources (Urea, DAP and KCl and a complex of minor elements). For calibration, climate databases were adjusted, and defined the time to reach each stage of crop development, and the morphology and physiology of the plant depending on the location. The basic information obtained by this modeling was development of the canopy, biomass, harvest index, water use and grain yield. With field information, modeling AquaCrop was calibrated and validated in the area studied. After validation, the system (AquaCrop FAO) was run under the fertilization levels of 60 and 90% of the recommended level of fertilization.

Results and discussion

The calculated potential evapotranspiration (ETo) showed extreme values of 0.9 and 7.3 mm (for both fertilization levels assessed). This information was used to calculate the water use, as the model separates the evapotranspiration in transpiration and evaporation, avoiding confusion in the consumptive use of water (Raes et al., 2010); this is especially important in the early stages of crop development (FAO, 2006), because water evaporation on the soil is increases when there is a lack of coverage (Odhiambo and Irmak, 2012). The average calculated ETo was 4.1 mm day-1, a value that permits one to understand the water use in the production of biomass and yield of maize (Li et al., 2011).

Biomass

In order to simulate a 60% decrease in the fertilization level of crop, the biomass produced from the time of seedling emergence to physiological maturity was diminished, presenting a biomass of 9.889 t ha-1 for the 90% level and 7,775 t ha-1 for the 60%; meanwhile the measured biomass was 10,370 t ha-1 (Fig. 1A). This reduction could be due to the reduction of the canopy area (García et al., 2014) from 90 to 70% of the coverage (canopy) of plants. Under the stress fertilization, the amount of biomass produced per unit of water, was an average of 1.63 kg m-3 during the crop cycle (Fig. 1B). When total fertilization was used, there were on average 2.13 kg m-3 of water consumption (Fig. 1 C), although Fernandez et al. (1996) reported that some fertilizers did not influence maize yield when different irrigation frequencies had been used. In the same way, Garcia and Fereres (2012), working with corn and AquaCrop in southwestern Spain, found that the biomass produced by corn ranged between 25.07 and 30.94 t ha-1 for the observed values, and from 28 to 30 t ha-1 for the simulated values. These were values, which differ from those studied and show that there is a potential of biomass production which, possibly, can be translated into a higher potential yield (Wang et al., 2008).

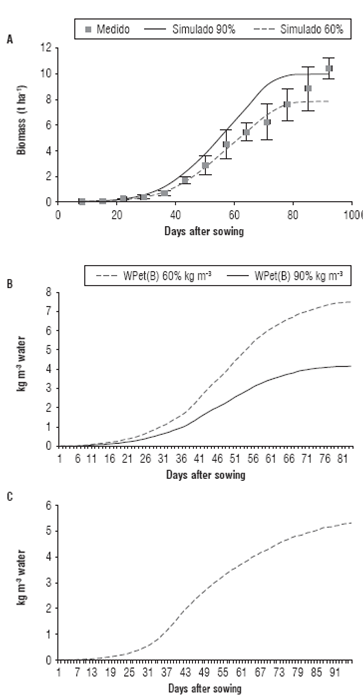
FIGURE 1 A. Production of biomass; B. Water use calculated in kg biomass/m3 of water under two levels of fertilization; C. compared with the use of corn ICA V-156 in normal conditions (AquaCrop-FAO). 

The biomass values obtained at 90% fertilization, show a linear regression, supported by a R 2 of 93.91% and the equation y = 0,1475x - 2.8165. Similarly, with the level of 60% fertilization, a linear regression (given by the equation y = 0,1145x - 2.2868) was observed with a R2 of 93.68%.

The harvest indices measured and modeled at 60 and 90% of fertilization were similar (Fig. 2A). The measured value of the harvest index was 27.6%, but when the simulated fertilization was 90 and 60%, harvest index was 32.3 and 29.8%, respectively. Possibly, the leaves had a larger area (each one) and, probably, a higher weight per unit, due to the increased effort of the plant, since the weight of the biomass is represented in large part by the leaves, according to Fageria et al. (2005), in order to capture the photosynthetically active radiation (RAF) (Bowman, 1989).

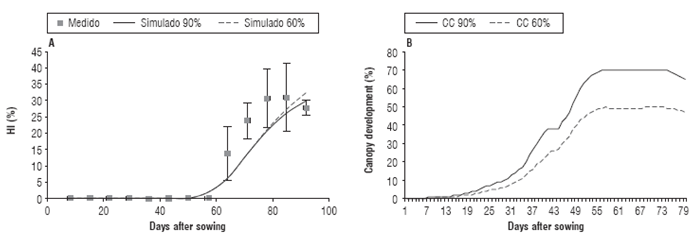
FIGURE 2 A. Harvest index (HI) and B. Canopy development of corn ICA V-156 under two levels of crop fertilization. 

Measuring the amount of water used to form 1 kg of biomass (Fig. 2A) shows that by decreasing the fertilization of corn, this amount of water increased. This may be due to the decreased crop canopy (Fig. 2B). The average amount of water to form biomass was 1.84 and 1.38 m-3 kg-1 for the fertilization levels of 90 and 60%, respectively. Gambín et al. (2006) report that the amount of water available in the soil at the time of flowering and the beginning of grain filling was enough to completely form the cob and grains during their development (Garcia et al., 2014). Also, the maximum evapotranspiration, could have been due to the scarce coverage crop during the early stages of development (Ma et al., 2012) and AquaCrop allowed to differentiate both of these situations (Steduto et al., 2009).

Yield

Comparing the simulated with the observed yield at a fertilization level of 60% (Fig. 3A), it was found that at the end of the modeled and measured period, the values were different with 2.51 t ha-1 for the of 60% fertilization and 2.95 t ha-1 for the 90% level, while the experimental yield was 2.93 t ha-1, suggesting a response to fertilizer application. Not only the level of fertilization that is handled by simulating the crop behavior was affected (Singh and Singh, 1995), but also the water consumption, because at lower levels of fertilization, the water use efficiency is reflected shown by the osmotic potential. Likewise, at 60% crop fertilization, there was an increased water consumption (Fig. 3B), represented by 1.43 mm in average per crop cycle as water transpired; while when 90% fertilization was used, the water transpired per corn plant was 1.1056 mm, on average (Fig. 3B).

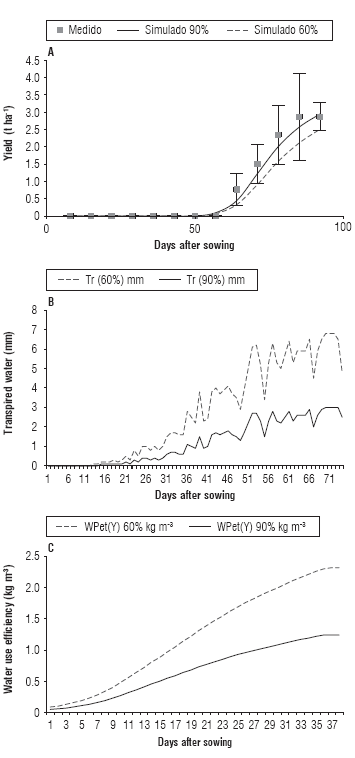
FIGURE 3 A. Grain yield obtained with corn ICA V-156, modeling at 60 and 90% level of fertilization at a density of 44,444 plants/ha. B. Amount of water transpired and C. Water used to form yield. 

In the application of the AquaCrop model, the calibration of crop physiology (Hsiao et al., 2009), soil profile and amounts of fertilizers are important items for the representation of benchmark yields (Ruane et al., 2013). After 70 d, transpiration decreases (Abedinpour et al., 2012) at both levels of fertilization, coinciding with the beginning of flowering and formation of maize yield for the evaluated site (Fig. 3A and B).

The yield formation was affected according to the level of fertilization (Fig. 3C), since 18.87 kg of grain per cubic meter of water were formed, with a daily average of 0.5241 kg m-3 after flowering at a 60% fertilization level. Likewise, when fertilization was 90%, 23.02 kg m-3 of water were formed Stroosnijder (2012) modeled the application of fertilization at different levels and sources, both organic and chemical, in corn, with AquaCrop and found decreased performance in proportion to the reduction of fertilization.

Conclusions

The use of AquaCrop showed that a fertilization plan at lower doses is recommended. By a decreasing fertilization by10%, the biomass production and maize yield decreased, however, the harvest index was maintained, due to the fact that the yield did not drastically decrease.

Biomass and canopy development were more affected than the rest of the variables by decreasing fertilization. In the same way, 40% less fertilization restricted performance and biomass production, 15.08 and 25.02%, respectively. As fertilization was reduced, water requirements for biomass formation, canopy formation, as well as crop transpiration increased.

A higher fertilization level (90%) achieves a higher amount of grain per m of water used, and 18,027% is the best consumption of water.

Literature cited

Abedinpour, M., A. Sarangi, T.B.S. Rajput, M. Singh, H. Pathak, and T. Ahmad. 2012. Performance evaluation of AquaCrop model for maize crop in a semi-arid environment. Agr. Water Manag. 110, 55-66. Doi: 10.1016/j.agwat.2012.04.001. [ Links ]

Baldocchi, D.D. and K.B. Wilson. 2001. Modeling CO2 and water vapor exchange of a temperate broad leaved forest across hourly to decadal time scales. Ecol. Model. 142, 155-184. Doi: 10.1016/S0304-3800(01)00287-3. [ Links ]

Baldocchi, D.D., K.B. Wilson, and L. Gu. 2002. How the environment, canopy structure and canopy physiological functioning influence carbon, water and energy fluxes of a temperate broad-leaved deciduous forest and assessment with the biophysical model CANOAK. Tree Physiol. 22, 1065-1077. Doi: 10.1093/treephys/22.15-16.1065. [ Links ]

Biazin, B. and L. Stroosnijder. 2012. To tie or not to tie ridges for water conservation in Rift Valley drylands of Ethiopia. Soil Tillage Res. 124, 83-94. Doi: 10.1016/j.still.2012.05.006. [ Links ]

Bowman, W.D. 1989. The relations chip between leaf water status, gas exchange, and spectral reflectance in cotton leaves, remote sensing of environment. Remote Sensing Environ. 30(3), 249-255. Doi: 10.1016/0034-4257(89)90066-7. [ Links ]

Breton, O.M., V.K.S. Morris, and V.E. Méndez. 2012. Cultivation of maize landraces by small-scale shade coffee farmers in western El Salvador. Agric. Syst. 111, 63-74. Doi: 10.1016/j.agsy.2012.05.005. [ Links ]

Cantor, F., J.R. Cure, and A.M. Orozco. 1995. Simulation and growth Gypsophyla paniculata var. Perfect, including the effect of vernalization. In: Abstracts Network Meeting of the International Biometric Society for Central America, the Caribbean, Colombia and Venezuela.11-15 June, 1995. Santa Marta, Colombia. [ Links ]

Ceccato, P., S. Flasse, S. Tarantola, S. Jacquemoud, and J.M. Grégoire. 2001. Detecting vegetation leaf water content using reflectance in the optical domain. Remote Sensing Environ. 77(1), 22-33. Doi: 10.1016/S0034-4257(01)00191-2. [ Links ]

Chuvieco, S.E. 2002. Environmental remote sensing. The earth observation from space. Ariel Science, Barcelona, Spain. [ Links ]

FAO. 2006. Crop evapotranspiration. Guidelines for determining water requirements of crops. FAO Irrigation and Drainage Study No. 56. FAO, Rome. [ Links ]

Fageria, N.K., V.C. Baligar, and R.B. Clark. 2005. Physiology of crop production. The Haword Press, New York, NY, USA. [ Links ]

Fallas, R., F. Bertsch, C. Echandi, and C. Henríquez. 2011. Characterization of development and nutrient absorption hybrid corn HC-57. Agron. Costar. 35(2), 33-47. [ Links ]

Fenalce. 2012. Cerealistas indicators 2011-2012 A. Economic Department, National Federation of Grain and Legumes Growers. In: Congreso Nacional Cerealista. 28-29 June, 2012. Monteria, Colombia. [ Links ]

Fenalce. 2013. Corn technology in Colombia. Growers National Federation of Cereals and Pulses. In: In: www.fenalce.org ; consulted: November, 2014. [ Links ]

Fernández, J.F., F. Moreno, J.M. Murillo, J.A. Cayuela, B.E. Fernández, and F. Cabrera. 1996. Water use and yield of maize with two levels of nitrogen fertilization in SW Spain. Agric. Water. Manag. 29, 215-233. Doi: 10.1016/0378-3774(95)01192-7. [ Links ]

Gambín, B.L., L. Borrás, and M.E. Otegui. 2006. Source-sink relations and kernel weight differences in maize temperate hybrids. Field Crops Res. 95, 316-326. Doi: 10.1016/j.fcr.2005.04.002 [ Links ]

García A., J. 2014. Comparison of simulation models and CREFT AquaCrop under Colombian conditions as a tool for decision-making and support corn production. PhD thesis. Faculty of Agricultural Sciences, National University of Colombia, Bogotá, Colombia. [ Links ]

García A., J., N. Riaño, and S. Magnitskiy. 2014. Simulation of corn (Zea mays L.) production in different agricultural zones of Colombia using the AquaCrop model. Agron. Colomb. 32(3), 358-366. Doi: 10.15446/agron.colomb.v32n3.45939. [ Links ]

García-Vila, M. and E. Fereres. 2012. Combining the simulation crop model AquaCrop with an economic model for the optimization of irrigation management at farm level. Eur. J. Agron. 36, 21-31. Doi: 10.1016/j.eja.2011.08.003. [ Links ]

García, A., L.C. Guerra, and G. Hoogenboom. 2008. Impact of generated solar radiation on simulated crop growth and yield. Ecol. Model. 210, 312-326. Doi: 10.1016/j.ecolmodel.2007.08.003. [ Links ]

Gates, D.M., H.J. Keegan, J.C. Schleter, and V.R. Weidner. 1965. Spectral properties of plants. Appl. Optics 4, 11-20. Doi: 10.1364/AO.4.000011. [ Links ]

Geerts, S. and D. Raes. 2009. Deficit irrigation as an on-farm strategy to maximize crop water productivity in dry areas. Agr. Water Manag. 96, 1275-1284. Doi: 10.1016/j.agwat.2009.04.009. [ Links ]

Geerts, S., D. Raes, and M. García. 2010. Using AquaCrop to derive deficit irrigation schedules. Agr. Water Manag. 98, 213-216. Doi: 10.1016/j.agwat.2010.07.003. [ Links ]

Goetz, S.J., S.D. Prince, S.N. Goward, M.M. Thawley, and J. Small. 1999. Satellite remote sensing of primary production: an improved production efficiency modeling approach. Ecol. Model. 122, 239-255. Doi: 10.1016/S0304-3800(99)00140-4. [ Links ]

Hsiao, T.C., L. Heng, P. Steduto, B. Rojas-Lara, D. Raes, and E. Fereres. 2009. AquaCrop-The FAO crop model to simulate yield response to water: III. Parameterization and testing for maize. Agron. J. 101(3), 448-459. Doi: 10.2134/agronj2008.0218s. [ Links ]

Jones, J.W., G. Hoogenboom, C.H. Porter, K.J. Boote, W.D. Batchelor, L.A. Hunt, and P.W. Wilkens. 2003. The DSSAT cropping system model. Eur. J. Agron.18, 235-265. Doi: 10.1016/S1161-0301(02)00107-7. [ Links ]

López-Mata, E., J.M. Tarjuelo, J.A. de Juan, R. Ballesteros, and A. Domínguez. 2010. Effect of irrigation uniformity on the profitability of crops. Agric. Water Manag. 98, 190-198. Doi:10.1016/j.agwat.2010.08.006 [ Links ]

Li, L., G. Luoa, X. Chena, Y. Li, G. Xu, H. Xu, and J. Bai. 2011. Modelling evapotranspiration in a Central Asian desert ecosystem. Ecol. Model. 222, 3680- 3691. Doi: 10.1016/j.ecolmodel.2011.09.002. [ Links ]

Liu, G., M. Hafeez, Y. Liu, D. Xua, and C. Vote. 2012. A novel method to convert daytime evapotranspiration into daily evapotranspiration based on variable canopy resistance. J. Hydrol. 414-415, 278-283. Doi: 10.1016/j.jhydrol.2011.10.042 [ Links ]

Ma, L, T.J. Trout, L.R. Ahuja, W.C. Bausch, S.A. Saseendran, R.W. Malone, and D.C. Nielsen. 2012. Calibrating RZWQM2 model for maize responses to deficit irrigation. Agr. Water Manag. 103, 140-149. Doi: 10.1016/j.agwat.2011.11.005 Doi: 10.1016/j.agwat.2011.11.005. [ Links ]

Martins, J.D, G.C. Rodrigues, P. Paredes, R. Carlesso, Z.B. Oliveira, A.E. Knies, M.T. Petry, and L.S. Pereira. 2013. Dual crop coefficients for maize in southern Brazil: Model testing for sprinkler and drip irrigation and mulched soil. Biosyst. Eng. 115, 291-310. Doi: 10.1016/j.biosystemseng.2013.03.016. [ Links ]

Melgar, R.J., J. Lavandera, M. Torres D., and L. Ventimiglia. 2001. Response to fertilization with boron and zinc in intensive corn production systems. Cienc. Suelo 19(2), 109-114. [ Links ]

Negrete, F., J. Morales, A.J. López, and A.M. Martínez. 2004. Final report project "Comprehensive technical assistance in the cultivation of corn for Caribbean ecoregion". Corpoica, C.I. Turipana, Cerete, Colombia. [ Links ]

Odhiambo, L.O. and S. Irmak. 2012. Evaluation of the impact of surface residue cover on single and dual crop coefficient for estimating soybean actual evapotranspiration. Agr. Water Manag. 104, 221-234. Doi: 10.1016/j.agwat.2011.12.021. [ Links ]

Ospina, J.G. 2006. DSSAT validation model in different agro-ecological conditions of Colombia, a tool to optimize management practices maize (Zea mays L.). M.Sc. thesis. Faculty of Agricultural Sciences, National University of Colombia, Medellin, Colombia. [ Links ]

OECD/FAO. 2011. Agricultural outlook 2011-2020. Doi: 10.1787/agr_outlook-2011-en [ Links ]

Paliwal, R.L. 2001. Morphology of tropical maize. Corn in the tropics. Improvement and production. Collection FAO Plant Production and Protection. In: http://www.fao.org/DOCREP; consulted: August, 2015. [ Links ]

Penman, H.L. 1948. Natural evapotranspiration from open water, bare soils, and grass. Proc. R. Soc. London 193(1032), 120-145. Doi: 10.1098/rspa.1948.0037. [ Links ]

Penman, H.L. 1949. The dependence of transpiration on weather conditions. J. Soil Sci. 1, 74-89. Doi: 10.1111/j.1365-2389.1950.tb00720.x. [ Links ]

Raes, D., P. Steduto, T.C. Hsiao, and E. Fereres. 2011. AquaCrop version 3.1plus: FAO cropwater productivity model to simulate yield response to water. Reference Manual. FAO, Rome . [ Links ]

Raes, D., P. Steduto, T.C. Hsiao, and E. Fereres. 2010. AquaCrop - The FAO crop model to simulate yield response to water. User Guide. Chapter 2. Version 3.1 plus. Reference Manual. FAO, Rome . [ Links ]

Reiko, I., N. Tatsuro, and O. Hiroyuki. 2010. Assessment of canopy photosynthetic capacity and estimation of GPP by using spectral vegetation indices and the light-response function in a larch forest. Agr. For. Meteor. 150, 389-398. Doi: 10.1016/j.agrformet.2009.12.009. [ Links ]

Riaño, H., N.M. Tangarife., O.I. Osorio, J.F. Giraldo, C.M. Ospina, D. Obando, L.F. Gómez, and L.F. Jaramillo. 2005. Growth model and carbon sequestration to forest species in the tropics. CREFT. V 1.0. National Federation of Coffee Growers of Colombia, National Development Corporation and Forest Development, Bogotá. [ Links ]

Ruane, A.C., L.D. Cecil, R.M. Horton, R. Gordón, R. McCollum, D. Brown, B. Killough, R. Goldberg, A.P. Greeley, and C. Rosen-zweig. 2011. Climate change impact uncertainties for maize in Panama: Farm information, climate projections, and yield sensitivities. Agr. For. Meteorol. 170, 132-145. Doi: 10.1016/j.agrformet.2011.10.015. [ Links ]

Salemi, H., M.A. Soom, T.S. Lee, S.F. Mousavi, A. Ganji, and M.K. Yusoff. 2011. Application of AquaCrop model in deficit irriga-tion management of winter wheat in arid region. Afr. J. Agr. Res. 610, 2204-2215. [ Links ]

Sezen, S.M., A. Yazar, B. Kapur, and S. Tekinb. 2011. Comparison of drip and sprinkler irrigation strategies on sunflower seed and oil yield and quality under Mediterranean climatic conditions. Agric. Water Manag. 98, 1153-1161. Doi: 10.1016/j.agwat.2011.02.005. [ Links ]

Singh, B.R. and D.P. Singh. 1995. Agronomic and physiological responses of sorghum, maize and pearl millet to irrigation. Field Crops Res. 42, 57-67. Doi: 10.1016/0378-4290(95)00025-L. [ Links ]

Steduto, P., T.C. Hsiao, and E. Fereres. 2007. On the conservative behavior of biomass water productivity. Irrig. Sci. 25, 189-207. Doi: 10.1007/s00271-007-0064-1. [ Links ]

Steduto, P., T.C. Hsiao, D. Raes, and E. Fereres. 2009. AquaCrop-The FAO crop model to simulate yield response to water: I. Concepts and underlying principles. Agron. J. 101(3), 426-437. Doi: 10.2134/agronj2008.0139s. [ Links ]

Steduto, P ., D. Raes, T.C. Hsiao, E. Fereres, L.K. Heng, T.A. Howell, S.R. Evett, B.A. Rojas-Lara, H.J. Farahani, G. Izzi, T.Y. Oweis, S.P. Wani, and R. Albrizio. 2005. Resource use efficiency of field-grown sunflower, sorghum, wheat and chickpea. II. Water use efficiency and comparison with radiation use efficiency. Agric. For. Meteorol. 130, 269-281. Doi: 10.1016/j.agrformet.2005.04.003. [ Links ]

Steduto, P ., D. Raes, T.C. Hsiao, E. Fereres, L.K. Heng, T.A. Howell, S.R. Evett, B.A. Rojas-Lara, H.J. Farahani, G. Izzi, T.Y. Oweist, S.P. Wani, J. Hoogeveen, and S. Geerts. 2009. Concepts and applications of AquaCrop: The FAO crop water productivity model. pp. 175-191. In: Weixing, C., J.W. White, and E. Wang (eds.). Crop modeling and decision support. Springer, Berlin. Doi: 10.1007/978-3-642-01132-0_19. [ Links ]

Sun, J., L. Yang, Y. Wang, and D.R. Ort. 2009. FACE-ing the global change: Opportunities for improvement in photosynthetic radiation use efficiency and crop yield. Plant Sci. 177, 511-522. Doi: 10.1016/j.plantsci.2009.08.003. [ Links ]

Taboada, M.A. and C.R. Alvarez. 2008. Root abundance of maize (Zea mays L.) in conventionally-tilled and zero-tilled soils of Argentina. Rev. Bras. Cienc. Solo 32, 769-779. Doi: 10.1590/S0100-06832008000200031. [ Links ]

Trezza, R. 2008. Estimating reference evapotranspiration monthly in Venezuela. What method to use? Bioagro 20(2), 89-95. [ Links ]

USDA. 2012. USDA agricultural projections to 2022. U.S. Department of Agriculture, Interagency Agricultural Projections Committee, Washington DC, USA. [ Links ]

Vico, G. and A. Porporato. 2011. From rainfed agriculture to stressavoidance irrigation: I. A generalized irrigation scheme with stochastic soil moisture. Adv. Water Resour. 34, 263-271. Doi: 10.1016/j.advwatres.2010.11.010. [ Links ]

Wang, X. P.W. Gassman, R. Williams, S. Potter, and A.R. Kemanian. 2008. Modeling the impacts of soil management practices on runoff, sediment yield, maize productivity, and soil organic carbon using APEX. Soil Tillage Res. 101, 78-88. Doi: 10.1016/j.still.2008.07.014. [ Links ]

Zhu, X.-G., Q. Song, and D.R. Ort. 2012. Elements of a dynamic systems model of canopy photosynthesis. Curr. Opin. Plant Biol. 15, 237-244. Doi: 10.1016/j.pbi.2012.01.010. [ Links ]

Received: December 06, 2016; Accepted: March 15, 2017

Creative Commons License This is an open-access article distributed under the terms of the Creative Commons Attribution License