


 Inglés (pdf)
 Articulo en XML
 Referencias del artículo
 Enviar articulo por email
 Citado por SciELO
  Citado por Google
  Similares en
SciELO
Similares en
SciELO  Similares en Google
 Permalink
Introduction
Monitoring sugarcane using orbital remote sensors has been the subject of research around the world. This technique has allowed the measurement of the reflected and absorbed radiation of the vegetation, obtaining different results that have been used for different purposes in agriculture such as discrimination between crops, discrimination based on variety, assessment of water stress, estimating yield, among others (Fernandes et al., 2011; Aguiar et al., 2011; Vieira et al., 2012; Govender et al., 2007).
The sensors used for spectral and spatial information may be on board satellites or airborne vehicles and their use will depend on the scale of work or detail expected in the products used to monitor the crop (Schmidt et al., 2000); Satellite images have been used on several occasions for studies at a regional level (Mulianga et al., 2013), but in the case of high level detail scales monitoring, the use of Unmanned Aerial Vehicles (UAVs) or Remotely Piloted Aircraft Systems (RPAS) is becoming a great tool for this task. This recent interest in using unmanned aerial vehicles in the study of agricultural crops is largely due to the great benefits gained by their implementation: low prices and easy logistics compared to satellite products, high spatial and temporal resolution and the possibility of spectral information in different regions of the electromagnetic spectrum that allow the calculation of various vegetation indices, making them a great tool for monitoring and follow-up in different cultures (Lelong et al., 2008).
Multiple vegetation indices derived from visible and infrared spectrum of conventional, multispectral and hyperspectral sensors have been created in order to make assessments on different agronomic crops from these data, including determining the chlorophyll content (Hatfield et al., 2008), leaf area index (LAI) (Hunt et al., 2013) or nitrogen concentration (Miphokasap et al., 2012; Blackmer et al., 1996; Feng et al., 2008; Abdel-Rahman et al., 2010). Many others are equally used for nitrogen treatment discrimination (Foster et al., 2012) or varietal discrimination (Johnson et al., 2008; Galvao et al., 2005). More recently, the potential uses of these indices on crop yield from satellite sensors have been evaluated (Morel et al., 2014), as well as time series of other variables such as Fraction of Absorbed Photosynthetically Active radiation (fPAR) (Duveiller et al., 2013). Early estimates have been made using high-resolution airborne sensors of crop yield from vegetation indices (Berger et al., 2013) and even indices obtained with the use of ground sensors (Lofton et al., 2012).
In Colombia, the monitoring of sugarcane cultivation is conducted by the Sugarcane Research Center of Colombia (Cenicaña), using satellite images, especially from MODIS-Terra sensor, Landsat TM and ETM+ images and data reflectance obtained by field spectroradiometry (Murillo and Carbonell, 2012). However, Colombia, being geographically located within the intertropical front, is subject to permanent cloud coverage, which has been a limiting factor for timely and regular acquisition of satellite images of high spatial optical resolution.
The use of UAVs or RPAS with multispectral cameras can be a solution to the difficulties encountered in relation to the high percentage of clouds that appears in the satellite images since the flying height of the RPAS allows imaging without cloud interference. Moreover, having the ability to increase the frequency of shots and produce highly detailed images, thus allowing for a full monitoring of the crop and achieving effective control to improve productivity, which can be affected by various factors that vary both spatially and temporally (GopalaPillai and Tian, 1999).
The aim of this study was to evaluate the ability of a multispectral camera to generate vegetation indices and using them to estimate crop yield, between varieties discrimination and between nitrogen levels effect discrimination.
Materials and methods
Study area
The study was conducted by Cenicaña in the experimental lot three of the International Center for Tropical Agriculture (CIAT), located in the municipality of Palmira, Valle del Cauca, Colombia (Fig. 1A). The geographical coordinates of the study area are 3°29'43.62" N and 76°21'49.51" W. The experimental lot houses two experiments in which different sugarcane varieties with different nitrogen doses (Fig. 1C) are evaluated.
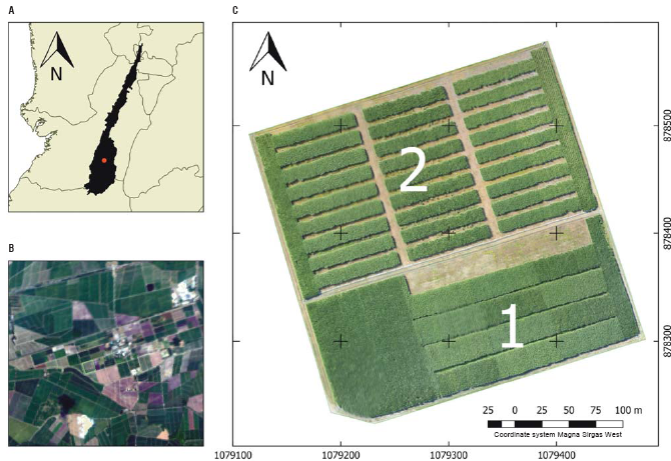
FIGURE 1 Geographic location of the study area. A. Location of the sugar industry in southwestern Colombia; B. location of the experimental lot at CIAT. C. Experimental lot divided in the two experiments assessed in the study.
The average temperature of the area is 23.2°C, with an average radiation of 430 cal cm-2 d-1, an annual rainfall of 886 mm, a soil rich in organic matter, a clay content in a range between 35 and 60% and according to agroecological zoning (Carbonell et al., 2011) the experiment is located in a Typic Haplusterts soil, fine textural family and with a low humidity level (0-200 mm yr-1).
RPAS and sensor
A multirotor vehicle manufactured by the Advector Company was used. It is a quadricopter type Araknos V2 model. An Agricultural Digital Camera (ADC lite), manufactured by Tetracam Inc. was used for capturing images. The ADC lite is a small 6.55x4.92 mm camera with a weight of 200 g; it generates a record of the position of each of the captured images and has an unique 3.2 megapixel sensor operating in the NIR bands from 520 nm to 920 nm, simulating TM2, TM3 and TM4 bands of Landsat Thematic Mapper sensor (TM) (Tetracam, 2015). The sensor of this camera uses a blocking filter in the blue region of the spectrum and uses the sensitivity curve of the blue filter to measure the response of the NIR, while green and red filters measure the corresponding response to each of parts of the spectrum. However, sensitivity curves of green and red have a high peak in the NIR perception, similar to the curve of sensitivity of the blue, perturbing a pure measurement of these regions of the spectrum (Tetracam, 2015).
The flight took place on May 9, 2014, between 11:00 am and 1:00 pm, looking to have the most photosynthetically active radiation (PAR). At the time of the capturing of the images, the crop was 8.5 months old.
Experimental design
The study was carried out on a two factor experimental design: three varieties of sugarcane in three doses of nitrogen. The levels of each factor are shown in table 1.
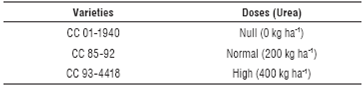
Selected varieties were the ones recommended by Cenicaña Variety Program due to their increase in planted area at a commercial level and their differences in architecture and color, which will permit to assess changes in vegetation and biomass index values.
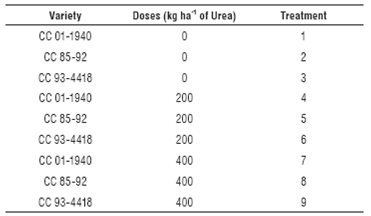
The appropriate N doses were established based on the spatial distribution of organic matter using SEF (Fertilization Expert System) developed by Cenicaña. A total of 36 field plots divided into nine treatments constructed from the combination of varieties and nitrogen doses were tested in one experiment (Tab. 2). The size of each plot corresponds to 12 furrows with dimensions of 1.65x20 m. In experiment two, only 200 kg ha-1 doses were applied, among the same three varieties of sugar cane for a total of 108 plots.
Both experiments were harvested between 7 and 8 September, 2014. The productivity of the experiments was measured using a cane loader where the weight and the GPS position were registered, the yield was expressed in tons of cane per hectare (t ha-1) for each plot of the two experiments.
Image processing
The images obtained by the ADC lite were stored in 8-bit RAW format, obtaining an image per band and converted into TIFF format using PixelWrench2 software, which came with the camera. Later, with the images, an orthorectified mosaic of the study area was generated, following the methodology proposed by García et al. (2014), using the X, Y and Z of the metadata of each of the acquired images.
Once the images were processed, different vegetation indices were evaluated based on the available bands of the ADC Lite camera (Tab. 3).
TABLE 3 Indices of vegetation assessed, where N corresponds to the digital levels to near-infrared, G to green digital levels and R to digital levels of red.
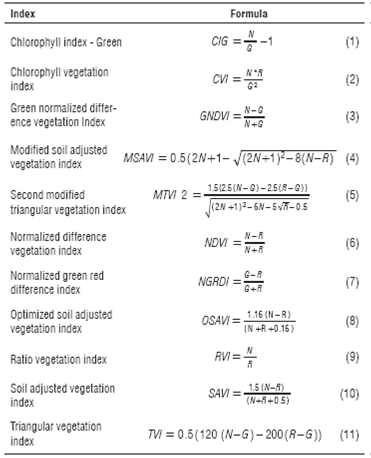
These vegetation indices respond to different factors, from the impact on quality of vegetation to structural factors such as leaves, stems and orientation. In the case of the quality of vegetation, it absorbs some of the incoming energy to perform its various internal processes, presenting a high absorption in the visible spectrum, highlighting the absorption peaks in the blue and the red, while scattering large amounts of energy in the NIR, generating a high reflectance, which is diminished when the vegetation has some type of complication or is reaching senescence (Ponzoni et al., 2012).
To obtain the value of the indices evaluated for each of the plots were created Regions of Interest (ROI) in each of them, taking care to avoid areas that could alter the values obtained (shadows and regions with overturned sugarcane were excluded of the ROI), and extracted the average value of all pixels contained in the respective ROI for each plot.
The vegetation indices calculated were evaluated according to their behavior in relation to the fertilization dose in experiment one, testing its statistical differences by such doses, varieties and their interaction through ANOVA analysis and Bonferroni groups, allowing the comparison of the average of the analyzed factors, after having been subject to ANOVA analysis. Because of the disturbance mentioned earlier in the filters of green and red in the ADC lite camera, the significance level was set at α=0.1 in order to avoid "false negatives" and losing the potential that can reach the assessed camera with the above mentioned limitations.
Similarly, indices were related by linear regression against productivity per plot, using data from experiments one and two (36 and 108 plots respectively) evaluating their relation-ship per set of varieties and for each variety individually and determining the best productivity prediction model.
Results
Agronomic treatment outcomes
The experiment showed a high productivity measured in tons of sugar cane per hectare (t ha-1) based on the industry average at the time of its harvest (121.4 t ha-1). The CC 011940 variety with a dose of 400 kg ha-1 of urea (treatment 7), was the one with the highest productivity reaching 250 t ha-1. On average, CC 01-1940 variety, regardless of the dose, presented the highest tonnage with a productivity of 239 t ha-1, followed by varieties CC 93-4418 with a productivity of 225 t ha-1 and CC 85-92, with a productivity of 199 t ha-1 respectively. However, comparing the tonnages between varieties, no significant differences were found due to the interactions between variety and nitrogen doses.
Analyzing the tonnage per dose of nitrogen regardless of the variety, the dose of 400 kg ha-1 was the one with the highest yield with 229 t ha-1, followed by the dose of 200 kg ha-1 with 223 t ha-1; the dose of 0 kg ha-1 was the lowest, with a productivity of 211 t ha-1. The statistical differences were found between the highest dose (400 kg ha-1) and the lowest dose (0 kg ha-1).
In the results of tonnage by fertilization dose, analyzed by variety, significant differences were found between the 0 kg ha-1 and the 400 kg ha-1 doses in the CC 01-1940 variety; for other treatments, including CC 93-4418 and CC 85-92 varieties, no significant differences between the doses were found (Fig. 2A).
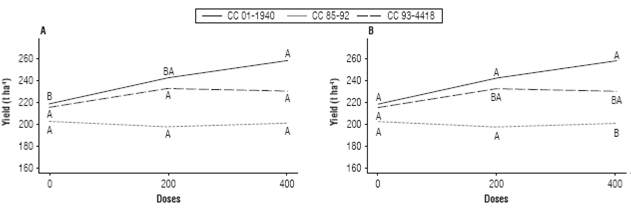
FIGURE 2 A. Differences in productivity between doses for each variety (the letters corresponding to the groups should be read horizontally for each variety) and B. Differences in productivity between varieties per dose (the letters corresponding to the groups should be read vertically for each dose).
The yield results for varieties analyzed by dose showed that in the 0 kg ha-1 dose there were no significant differences between any of the three varieties, but in doses of 200 kg ha-1 and 400 kg ha-1, significant differences between CC 85-92 and CC 01-1940 varieties were found (Fig. 2B).
Separability by indices of fertilization and varieties
Analyses of variance were performed to determine the possible statistical differences of the average of the established indices between different fertilization doses, as well as the varieties and their interaction. Table 4 is presented in P-values, obtained from the analyses of variance performed for each index, for the Variety and Dose factors and the interaction between Variety and Doses. There was no experimental evidence that would confirm the existence of significant differences between nitrogen doses and their interaction with the varieties, however, there were two indices, CIG and GNDVI, where it was possible to detect statistical differences between varieties, with a 10% significance.
TABLE 4 P-value by index for variety, dose factors and the variety-dose interaction, a result of ANOVA variance analysis for both experiments.
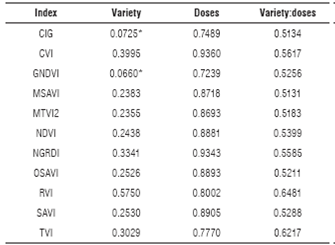
*Significant differences with a a=0.1
The values of each of the indices of experiment one were averaged for variety and in turn by fertilization dose, obtaining a similar trend in most of the indices, for which the highest value of each index corresponds to a fertilization dose of 200 kg ha-1 in CC 01-1940 (treatment 4) (Fig. 3), except for the CVI and TVI indices, the first one showing a reverse behavior (Fig. 3C) and the second one obtaining the highest value on a dose of 0 kg ha-1 in CC 93-4418 variety (Fig. 3L); while lower index values correspond to the CC 85-92 variety on the three fertilization doses (treatments 2, 5 and 8).
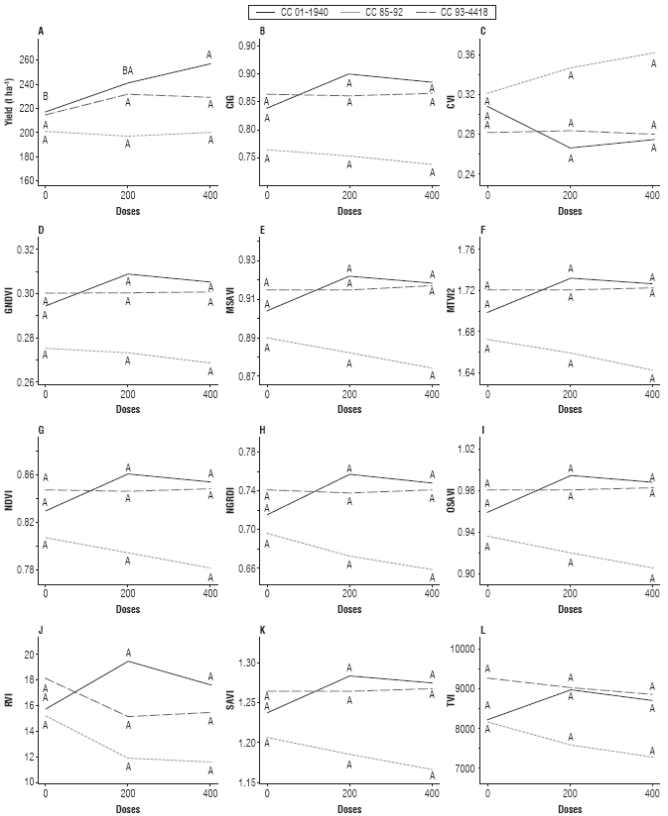
FIGURE 3 Bonferroni grouping of productivity and vegetation Índices between doses for each variety (figures should be read horizontally for each of the varieties).
Bonferroni test was used at 10% (which keeps the experimental error rate with I and II errors at appropriate levels) to analyze the statistical differences of indices between fertilization dose pairs, varieties pairs (Fig. 3) and between varieties pairs for each fertilization dose (Fig. 4). In figure 3 it can be seen that no index manages to separate between fertilization doses, by variety; whereas in figure 4 it can be seen that two of the evaluated indices, CIG and GNDVI (Fig. 4B and 4D), were able to achieve the difference of CC 01-1940 and CC 93-4418 varieties from CC 85-92 variety, only when these three varieties were fertilized with normal and high doses (200 and 400 kg ha-1).

Relationship between vegetation índices and productivity
Structure of correlation between vegetation Índices
For each variety, a factor analysis was conducted, using the main components as extraction method, to find correlations between the eleven indices measured in the study. Although the nature of the relationship between indices should not be affected by the variety, it was made for each one to numerically compare that the pattern did not change.
In all cases (varieties), 100% of the variability structure of the vegetation indices was achieved with five factors, and 98% with the first two. Furthermore, significant correlations between components and indices were found in the first two factors, as described in table 5.
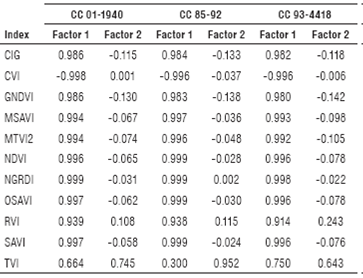
From table 5 it is concluded that except the TVI (which is related to factor 2), all indices are strongly correlated because the lowest relationship between them and factor one is 0.93. The CVI index has an inverse relationship with the others.
Relationship between vegetation indices and productivity
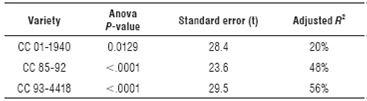
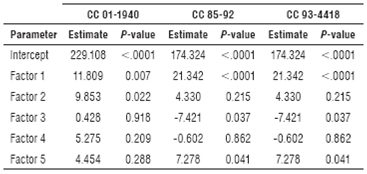
As a result of the high correlation between indices, and to be able to model their relationship to productivity without multicollinearity problems, it was decided to set a multiple linear regression between productivity and the scores of the top five factors of factor analysis (the first five reach a 100% explained variability) for each variety. Table 6 shows that in the varieties CC 85-92 and CC 93-4418 it is possible to explain the variation in productivity in at least 48% and 56% respectively. Also, the average estimation error of the model is 23.6 t ha-1 and 29.5 t ha-1. In variety CC 01-1940 the adjustment range was 20% with an estimation error of 28.4 t ha-1. Table 7 shows the estimates of the model parameters for each variety.
Discussion
For most indices in experiment one, the highest value obtained is the response to a fertilization dose of 200 kg ha-1 on the CC 01-1940 variety, while the lower value obtained is the response of a fertilization dose of 400 kg ha-1 on the CC 85-92 variety; however, no index found significant differences between fertilization doses or Variety-Dose interaction.
According to Foster et al. (2012), the indices that are sensitive to the content of chlorophyll in the plant, such as those working in regions of green, red and red edge; take advantage of the reflectance ratios in these areas to achieve nitrogen treatment discriminations. The indices evaluated in this study did not discriminate between fertilization doses. This is explained either by low spectral quality relative to the assessed camera or by the amount of organic matter present in the experiment (3.03%), which allows the release of nitrogen and other nutrients in the soil, yielding a more constant availability of nutrients for the three varieties present.
As for varietal discrimination in experiment one, just the CIG and GNDVI indices found significant differences in the dose of 400 kg ha-1 between CC 85-92 variety, which has the lowest index values, and the varieties CC 01-1940 and CC 93-4418, which have the highest index values, and no significant difference between the latter. Similarly, significant differences were found in the dose of 200 kg ha-1 between varieties CC 85-92 and CC 01-1940 while CC 93-4418 variety could not be separated from the first two. This differentiation is due in part to the canopy architecture of the plant in each of the varieties, getting a much higher spectral response in varieties with curved blades (e.g., CC 01-1940) than in varieties with erect leaves (e.g., CC 85-92), as the penetration of sunlight, and hence the reflectance, are different for each variety (Galvao et al., 2005; Victoria et al., 2013); however, another part of this differentiation is due to the LAI and the amount of biomass produced by each variety, eventually affecting the productivity of each of the varieties (Berger et al., 2013). In contrast to the number of indices found with the ability to perform a statistical difference between varieties (two indices), Hoyos-Villegas and Fritschi (2013), using a camera ADC lite, found significant differences between two varieties of soybean by nine vegetation indices out of 15 indices evaluated with a significance level of 95%.
Conclusions
Only vegetation indices CIG and GNDVI show a significant difference between CC 85-92 variety and varieties CC 011940 and CC 93-4418 in doses of400 kg ha-1 and significant differences between the CC 85-92 and CC 01-1940 varieties in doses of 200 kg ha-1. The CC 85 -92 variety is the one that shows the lower value of vegetation index in the majority of evaluated cases, thus allowing for varietal discrimination in two of the evaluated indices. This behavior is associated with the plant structure and a low productivity compared to the productivity of the CC 01-1940 variety.
The evaluated indices showed no significant differences between the fertilization doses applied in the nine treatments of the experiment, demonstrating that its answer on the evaluated indices is very similar and it will depend both on the variety and its architecture.
The relationship between productivity and indices was modeled using a multiple linear regression and the scores obtained after an analysis of principal components (similar to a PLS regression, but made step by step) having found, for varieties CC 93-4418 and CC 85-92, determinations of 48 and 56% respectively. The percentage of variability in productivity for CC 01-1940 variety was 20%.
Although productivity depends on many factors, it was possible to approximate the explanation of its variability with the group of evaluated indices, separated in principal components, to avoid multicollinearity. The percentage of explanation found and the standard errors were acceptable and showed that the indices became one more input to predict productivity.
The ADC Lite camera proved to be effective in discriminating CC 85-92 variety against varieties CC 01-1940 and CC 93-4418 in doses of 400 kg ha-1, and CC 85-92 variety against CC 01-1940 variety in doses of 200 kg ha-1, however, it does not produce positive results in the discrimination of fertilization doses.

