


 Inglês (pdf)
 Artigo em XML
 Referências do artigo
 Enviar este artigo por email
 Citado por SciELO
  Citado por Google
  Similares em
SciELO
Similares em
SciELO  Similares em Google
 Permalink
Introduction
The use of sensors in agriculture is increasing, generating reliable and timely information that supports decision making for the proper location of crops and the application of the required amount of inputs at the appropriate site and time. Current approaches, such as precision agriculture or site-specific agriculture, dependent of very detailed information, produced preferably in real time, to define and apply specific crop management strategies. Research has been carried out on the evaluation of data obtained from different sources, such as proximal and remote sensors and photographs taken from unmanned aircraft to generate information about the nutritional or sanitary status of crops, with efficiency and sustainability as the final purpose.
Until a few years ago, there were limitations for using geographic digital information in agriculture because of the low availability of data, its high cost and difficulty in processing the data. There are now important advances in different fields, such as the increased data supply, prices have declined and some data is free, the improvement of spatial, radiometric and spectral resolution of images and the availability of new sensors and platforms. As examples, there is currently a free and permanent supply of remote sensing images from NASA's Landsat-8 and Sentinel-2 ESA's missions that have great potential for generating information for several purposes, such as agriculture. The problem of clouds persists, but other alternatives are emerging based on taking photos from unmanned aerial vehicle (UAV) or sensors that are passed through the crop with agricultural machinery or even manually to capture data.
Another important advance is that geographic information is increasingly valued as a fundamental input in agriculture. Several authors (Zhang and Kovacs, 2012; Mulla, 2013; Usha and Singh, 2013) have emphasized the significant role of sensors in agriculture and highlighted the need to advance to a generation of new knowledge that can be applied to improve the production process. Nowadays, reflectance measurements of plants can be done easily and with a higher level of detail, resulting in a key potential in crop management.
Some studies have demonstrated the feasibility of estimating chlorophyll content from vegetation indices calculated from measurements of reflectance at specific wavelengths (Schlemmer et al., 2005; Gitelson and Merzlyak, 1996; Yu et al., 2014;Martinez and Ramos, 2015). The first vegetation indexes were based on the contrast between the near infrared reflectance values and the strong absorption by chlorophyll in the red part of the spectrum. Frampton et al. (2013), initially estimates the chlorophyll content based on the relationship between the reflectance NIR/ R (near infrared/red) that was the basis for the development of Normalized Difference Vegetation Index (NDVI), which is currently the vegetation index most used to estimate different vegetation variables. Subsequently, refinements of the NDVI have been made as perpendicular vegetation index (PVI) or the index of vegetation adjusted to the soil (SAVI) that seeks to adjust the variation in the response of vegetation by the influence of the soil. Other researchers, concerning the function of vegetation reflectance, have evaluated the relationship between the position of the inflection point at the red edge REP (red edge position) or REIP (red edge inflection point) and various plant characteristics. The REIP lies between the maximum absorption of red (~680 nm) and maximum reflectance of the NIR (~740 nm) (Gitelson 2012), the maximum slope point (inflection point) is defined as the REP or red-edge wavelength. The REIP was defined by Liang (2004) as "the wavelength around 720 nm at which the first derivative of the spectral reflectance curve reaches its maximum value" that is the maximum slope (Thorp et al., 2004). The REP is affected by biochemical and biophysical parameters and has been used as a means of estimating chlorophyll and nitrogen contents in leaves (Cho and Skidmore, 2006; Curran et al., 1991).
Traditionally, spectral analyzes were limited to relatively few broad bands, taken by remote sensors of the various satellites. At present, with spectradiometers, data can be taken almost continuously through the electromagnetic spectrum and, consequently, additional information on the characteristics of objects, this case plants, can be obtained. According to Datt and Paterson (2000) and Tsai and Philpot (1998), the analysis of the first and second derivative of the reflectance produces new spectral indexes with better performance for vegetation studies. Furthermore they consider derivative analysis as important to the removal of the effect of background signals and the resolution of overlapping spectral features. Research has also been carried out to estimate other vegetation parameters, such as water content and biomass (Peñuelas et al., 2011), health status (Ruiz and Chen, 1982), effect of herbicides on plants (Yao et al., 2012), land cover (Thorp et al., 2004), or water quality (Malthus and Dekker, 1995) based on derivative analyses of spectral measurements.
Frampton et al. (2013) based on the simulation of data from Sentinel 2 images, found a significant relationship between chlorophyll contents and leaf area index with NDVI and REP values. These authors concluded that Sentinel 2 would offer a great opportunity for the global monitoring of vegetation because of the improvement of the spatial and temporal resolution in comparison with the Landsat and SPOT images and because of the bands taken around the red-edge, useful for establishing the state of the vegetation and specifically the contents of chlorophyll. They suggest that further research is required to establish the function of the portion of the spectrum corresponding to green (525-555 nm) and its relation to chlorophyll content. The results suggest that the part of the spectrum corresponding to green in these images may not be very suitable for making estimates of chlorophyll (Frampton et al., 2013).
The objective of this study was to evaluate the relationship between the spectral reflectance of some crops measured with the spectroradiometer and images from the Sentinel 2 sensors with the nutritional status, aiming to develop a method for monitoring crop status.
Materials and methods
The project was carried out in two areas; one located in the Colombian Orinoquia, in a flat highland landscape with a hot and humid climate, an average air temperature of 26°C and average annual rainfall of 2,500-2,800 mm. The soils were identified as Oxisols and Ultisols with high acidity and low fertility that imply significant inputs to achieve acceptable yield levels. Other measurements were carried out on maize crop in lowland soils near Bogota, with cold weather, average air temperature of 13°C and average annual rainfall of800 mm aiming to evaluate spatial variability within crop lots. Reflectance in leaves of maize (Zea mays), soybean (Glycine max), rice (Oryza sativa), sugar cane (Saccharum officinarum) in a phenological stage before flowering, leaves of medium age crops of oil palm (Elaeis guineensis), rubber (Hevea brasiliensis), cashew (Anacardium occidentale), established grasses (Brachiaria humidicola) and grass vegetation of natural savanna was measured. A FieldSpec 4 spectroradiometer (ASD Inc., Longmont, CO, USA) was employed measuring the reflectance in a range of 350 to 2,500 nm, taking values at 1.4 nm intervals from 350 to 1,000 nm and 2 nm from 1,000 to 2,500 nm, the equipment was calibrated with a spectralon panel. In the same leaves, chemical analysis was performed in the laboratory to establish the total contents of N, P, K, Ca, Mg, Cu, B, and Mn. Pearson's correlation analysis was performed to determine the relationship between the spectral variables and nutrients content and spatial interpolation analysis was carried out to identify the spatial variation of some spectral variables within a maize crop.
Sentinel 2 and Landsat 8 images from the dry season (January 17, 2016, less than 5mm precipitation) and the wet season (June 25, 2016, more than 189 mm precipitation) were used. SENTINEL-2 is a wide-swath, high-resolution, multi-spectral imaging mission, launched by the European Space Agency (ESA) in June 2015, it takes images in 13 spectral bands (Fig. 1); four bands at 10 m, six bands at 20 m and three bands at 60 m spatial resolution. ESA took the first images in the study area in December 2015. Sentinel 2 data have some advantages when compared to Landsat 8 satellite (Fig. 1) operated by NASA, launched in February 2013, taking images in bands 1, 2, 3, 4, 5, 6, and 9 with a spatial resolution of 30 m, bands 10 and 11 with resolution of 100 m and panchromatic band 8 with 15 m. Several analysis were performed in the Sentinel 2 images using the software QGIS (Congedo, 2016) and different spectral vegetation indexes and REP values were calculated (Tab. 1).
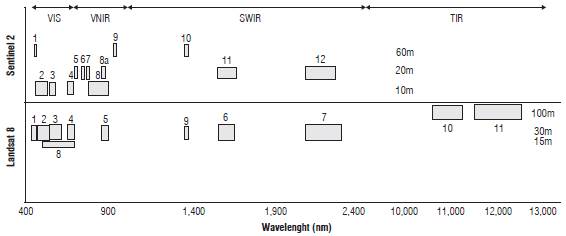
TABLE 1 Spectral indexes and REP calculated from spectral measurements and Sentinel images 2.
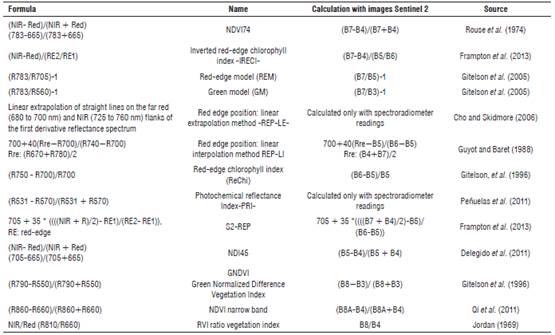
R: reflectance at a given wavelength; NIR: near Infrared.
The first and second derivatives of the spectral responses were calculated and further analyzed with the Savitzky-Golay filter (Savitzky and Golay, 1964), different window sizes were tested; finally, a 7 point-moving window with second-order polynomials was selected since it showed better performance. Other reflectance data transformation were tested, such as the Standard Normal Variate (SNV) to remove scatter effects and multi-collinearity (Barnes et al., 1993), including area normalization, which normalizes a spectrum Xi by calculating the area under the curve for the spectrum.
Results and discussion
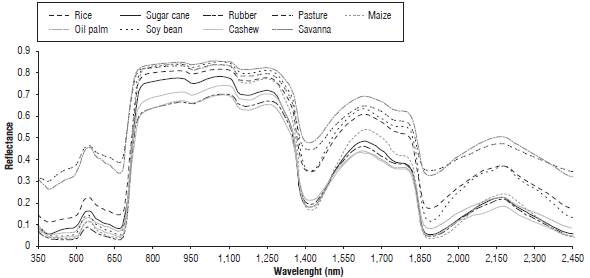
Figure 2 shows the spectral responses of some crops measured in the wet season with the FieldSpec4 spectro-radiometer. Significant differences in reflectance can be observed, mainly in the spectrum range of 530-560 nm, corresponding to green. The natural savanna vegetation and established pastures had the highest reflectance values in this portion of the spectrum (0.47), while crops, such as rubber, cashew, oil palm, and soybean, had the lowest values (around 0.1). Differences in reflectance were also observed in parts of the NIR (near infrared) and in the SWIR (Short-wavelength infrared). According to Liang (2004), the response in the visible spectrum is largely due to the amount and type of chlorophyll and carotenes; while in the NIR, it is mainly due to characteristics of the leaf structure and in the SWIR is most related to water content. This relationship between the spectral response and the content and type of pigments mainly chlorophyll and carotenes is the basis for calculating indices to establish the state of the plants related to nutrition status or other type of stress from the spectral responses. The relationship between chlorophyll and N is the basis for estimating N content in leaves from spectral responses (Cao et al., 2014).
Figures 3 and 4 show the spectral signatures of some crops and land-covers obtained from Sentinel 2 images (only those that were present in the same site and in the two seasons are shown). In the dry season, there was a higher reflectance in the visible range of spectrum (bands 2, 3, and 4) compared to the wet season because the plants were generally less green, with a lower moisture content and with less chlorophyll, leadin to lower energy absorption and greater reflection. In the following parts of the spectrum (bands 5, 6, 7, 8 and 8A), higher reflectance values were present in the wet season compared to the dry season. These changes are important at the moment of the classification of the Sentinel 2 images. When comparing the spectral signatures measured with the spectroradiometer (Fig. 1) and those obtained from Sentinel 2 images (Figs. 2 and 3), it wass found that measurements with the spectroradiometer showed a very narrow peak at 550 nm that corresponds to green, while in the images such peak is not detected. This is due to the higher spectral resolution of the readings of the spectrophotometer that takes values every 1.4 nm; while in Sentinel 2 images, the reflectance in the green is represented by a single value in a range of the spectrum whose central value is 560 nm and the bandwidth is 35 nm. This is important since it influences the accuracy of the information that can be generated from the images mainly referred to phenological characteristics and nutritional state of the crops.
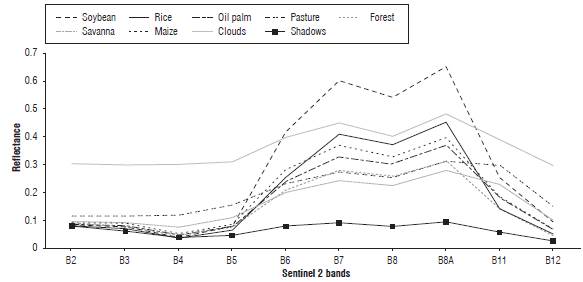
FIGURE 3 Spectral response in Sentinel 2 images of some land cover types (rainy season, June 25, 2016).
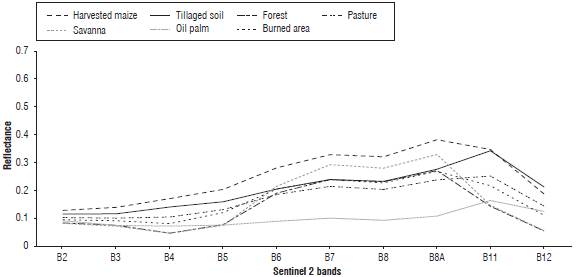
FIGURE 4 Spectral response in Sentinel 2 images of some land cover types (dry season, January 17, 2016).
The first derivative of the reflectance curve (Fig. 5) showed several peaks at different wavelengths around 521 nm, 725 nm, 954 nm, corresponding to green, red and near infrared, and in other portions of the spectrum, such as 1145 nm, 1390 nm, 1515 nm, 1180 nm, indicating the rate of change in the slope of the graph. The second derivative showed peaks in the wavelengths 520 nm, 690-720 nm, 740 nm, 1380-1420 nm, 1,850-1,900 nm indicating changes in the curvature of the reflectance plot. Spectrum ranges, where peaks occur, may have the potential to generate information related to some plant characteristics. The analysis of the derivatives is not based on the behavior of the real values of the reflectance, but rather it interprets the slope and the curvature of the reflectance graphs and the relation of its changes with characteristics of the studied objects, in this case plants.
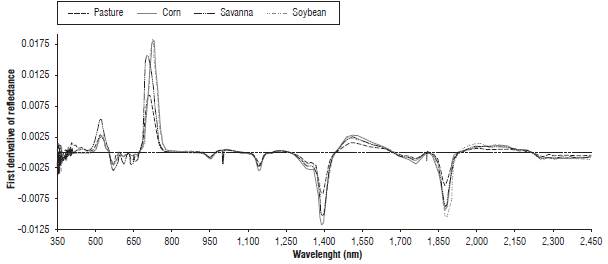
Figure 6 shows the behavior of the first reflectance derivative in the range of the second peak observed in figure 5, between 660 nm and 780 nm. REIP values, corresponding to the maximum value of the first derivative in this portion of the spectrum, varied between 0.01 for pastures and 0.017 for maize and were located at wavelengths ranging from 700 nm for grasses to 728 nm for sugar cane, the other crops and land covers presented intermediate values. There was also variation in the shape of the peak, from very sharp for the studied crops and larger for the established grasses and for savanna. Based on these results, it was found that the plants with lower contents of N had lower values of the first derivative, performed larger peaks and were located close to 700 nm; while those with higher contents of N had higher values, REIP was closer to 725 nm and generally had a sharper peak.
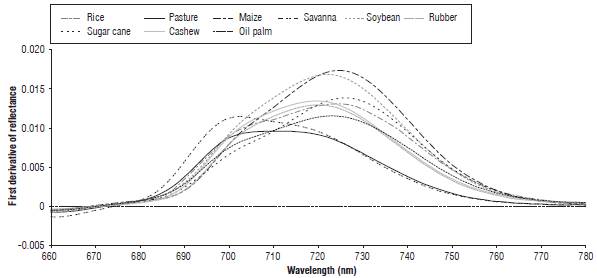
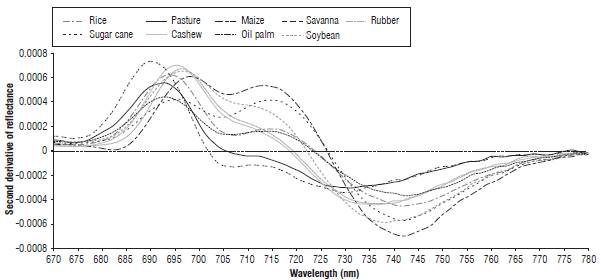
Figure 7 shows the trend of the second derivative in the spectrum range of 680-780 nm. The second derivative indicates the change in curvature of the graph (concave-convex) and usually when the values of the second derivative are equal to zero in that wavelength is considered to be inflection point or REIP. It was observed that, in that part of the spectrum, two peaks were presented, one close to 695 nm and one near 715 nm. It was also found that the peaks varied in position between 690 nm and 727 nm.
The correlation analysis showed highly significant coefficients between the N content in the leaves and the values of the reflectance in the wavelengths range of 450 nm and 780 nm (Fig. 8). However, the correlation was higher when the reflectance was transformed by the state normal variate reaching the highest values in the range of 490 nm to 505 nm with r of -0.86 and from 681 to 685 with r of -0.87. There were also highly significant correlations between the content of N in the leaves and the values of the first derivative of the reflectance between the wavelengths of 478 nm and 780 nm, with the highest coefficients in the range of 730 to 732 nm, where r was 0.84 and between 495 nm and 496 nm with r of -0.81. The second derivative and the N content, also showed highly significant correlations in parts of the spectrum (Fig. 8), with higher values between 523 and 526 with r = 0.82 and in 743 and 744 nm with r = -0.84. It has been found that the peak of the first derivative that is close to 700 nm increases when the Nitrogen content in the plant decreases (Chen et al., 2010). Changes in the first reflectance derivative indicated changes in the chlorophyll content in maize, winter wheat, sugar beet and wild vine crops (Kochubey and Kazantsev, 2007), which have also been used to determine the effect of glyphosate on plants (Yao et al., 2012).
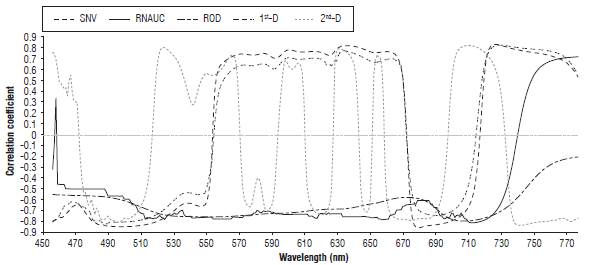
FIGURE 8 Correlogram of leaf nitrogen content (%) to leaf reflectance and some reflectance transformations. (SNV: state normal variate, RNAUC: reflectance normalized by area under the curve; ROD: original data of reflectance; 1st-D: first derivative of reflectance, 2nd-D: second derivative of reflectance).
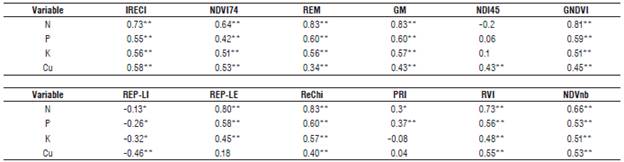
The results of correlation analysis between leaf nutrient content and spectral indexes (Tab. 2) were highly significant in several cases for N, P, K and Cu although, in general, the coefficients were lower than those found between the reflectance values transformed by the normal state variate and nutrient content. Is important to highlight the correlations that involved the spectral response in the red-edge range, such as the red edge model (REM), GM, GNDVI, REP-LE, ReChi whose correlation coefficients were the highest. For the Ca, B, Zn, Mg, and Mn, the coefficients were generally less than 0.5. According to other researches, the reflectance in the red-edge region is important because of its relationship with biophysical and biochemical parameters of plants (Cho, 2007), and relationships between the red-edge peak and the chlorophyll content have been reported (Filella and Penuelas, 1994).
TABLE 2 Correlation coefficients between nutrient content and some spectral indexes (for N: 68 data, for others 56).
The regression model for the N presented an r of 0.83 and included the variables of the first reflectance derivative transformed by the SNV: the sum of the area under the curve of the second derivative of the reflectance between 680 nm, the wave length when the second derived derivative becomes equal to 0 and the spectral index REP-LI. The analysis of normality, homoscedasticity and collinearity of the model indicated an appropriate representation.
The determination coefficients between some spectral indices computed with Sentinel 2 images and leaf N content are shown in table 3. The highest correlation was presented with the GM although there were also relatively high coefficients with REM and REChI, and lower values with NDVI. This indicates a good potential of Sentinel 2 images to evaluate the nutritional status of the crops, in relation to N, and to be able to see their spatial and temporal variability.
TABLE 3 Determination coefficients between some spectral indices computed with Sentinel 2 images and leaf N content (n=17)
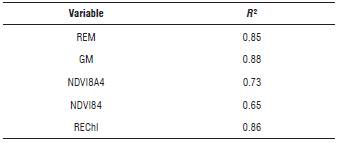
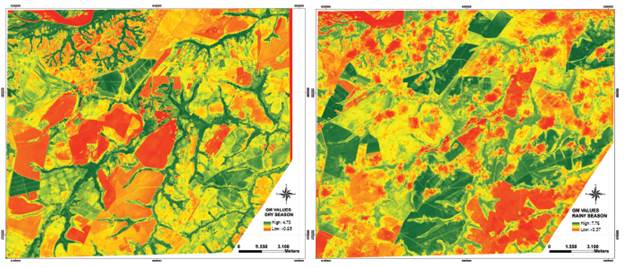
Figure 9 shows the Green Model index (GM) calculated from the band 7 corresponding to part of the red-edge (783 nm) and band 3 to the green (560 nm) of Sentinel 2 for the wet and dry seasons. Lowest values of GM correspond to areas without vegetation (dark red for river-bed or bare soil), higher values (dark green) represent the most developed vegetation or higher density of land cover like oil palm crops or forest, and between these extreme values, different crops are located. Pastures and savanna (yellow areas) had low values, although they have high density of land cover. Within crop, fields there were found spatial variation of GM values probably due to N content. Results also indicated significant changes in the crops, while some areas in the dry season were bare soil (dark red colors) in the wet season with short period mainly soybeans crops were planted, rice and less maize (dark green), in rainy season clouds could be observed (soft red). Other studies (Immitzer et al., 2016) have emphasized the importance of this kind of images and the availability of several bands in the red edge for crop identification and classification.
A significant problem for the use of Sentinel 2 images in the study area is the limitation caused by cloudiness which determines the availability of good quality images. For the year 2016, good quality images were found in 4 dates, belonging to January, April, Juneand September, which makes it difficult to perform analyzes at other times. In case it is important to know the status of a crop in shorter periods, it is necessary to have complementary technologies, such as the use of UAV with multi spectral cameras.
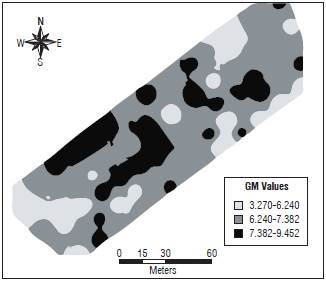
An important aspect on which permanent crop information is required is spatial variability at the detailed level within the lots in order to determine differential doses of inputs to be applied, to estimate yields or to perform differential management. Figure 9 shows the spatial distribution of GM calculated from reflectance measurements with the FieldSpec spectroradiometer within a maize crop,. Although at first glance in the field, it appears to be a relatively uniform crop, it presents high spatial variability associated with variations in the soil characteristics. This variation in the status of the crop affects production and can be modeled from spectral response data. In the case of Sentinel 2 images, when crops are relatively large, differences can be seen within cultivated lots; this aspect should be investigated in order to establish how much utility the images could have to evaluate spatial and temporal variability at the interior of each cultivated field.
Conclusions
Not all indexes and calculated REPs showed significant correlations with the nutrient contents; the best correlations were found for the N content when the reflectance data were transformed by calculations, the first and second derivatives and the NSV. These calculations make it possible to evidence a plant response more clearly than if untransformed reflectance data were used. For the spectral vegetation indexes, the best correlations were found in those that involved part of the red-edge spectrum in their calculation, such as GM, REM, REChI, whose coefficients were relatively high when calculated from Sentinel 2 images and also from the reflectance measured with the spectroradiometer.
In reference to the use of Sentinel 2 images, their good spatial, temporal and spectral resolution conferred good potential for crop information generation. An important feature of Sentinel 2 is its 10 m spatial resolution in some bands and the taking of images in various parts of the red-edge (705, 740, and 783 nm), which is where the response of plants to different conditions was found, meaning new indices can be calculated improving the quality and reliability of the results. In our climate conditions, characterized by the presence of clouds during the rainy season and most of the short-period crops (maize, soybean, rice) established, cloudy is a problem which could be improved chosing carefully the frequency which the images are going to be taken; however, it is necessary to develop other technologies based on aerial photographs from UAV or local sensors to generate more frequent information plus, reliable and detailed to support decision-making for each crop.
The results of this research showed the importance of continuing to move towards new topics to evaluate spectral responses as a result of other types of biotic and abiotic stress in plants, so that more reliable and timely information on the state of a crop can be used to make the best management decisions.

