


 Inglês (pdf)
 Artigo em XML
 Referências do artigo
 Enviar este artigo por email
 Citado por SciELO
  Citado por Google
  Similares em
SciELO
Similares em
SciELO  Similares em Google
 Permalink
Introduction
Chili peppers (Capsicum sp.) belong to the Solanaceae family which includes at least 37 species (Bosland et al., 2012), being five of them domesticated species: Capsicum annum L. var. annum, C. baccatum L. var. pendulum (Willd.) Es-hbaugh, C. pubescens Ruiz and Pavon, C. chinense Jacquin and C. frutescens L. (Pickersgill, 2007). Chili pepper fruits (CPF) are consumed raw, cooked and as a spice (Sherman and Billing, 1999). Furthermore, CPF are used as additives in the food industry and are even used in traditional medicine around the world (Di Scala and Crapiste, 2008).
The CPF consumption may provide some health benefits due to their high content of carotenoids (Provitamin A), ascorbic acid (vitamin C), tocopherols (vitamin E), flavonoids and capsaicinoids (Howard and Wildman, 2007; Topuz and Ozdemir, 2007).
Nowadays, CPF are cultivated around the world, particularly in the tropical and subtropical countries. Peru is one of the few countries in the world with the highest diversity of CPF due to a local high crop diversity (five-cultivated species are grown) and to the traditional consumption by the native population (Meckelmann et al., 2013).
"Ají Charapita" (C. frutescens) is the common name of the main cultivated chili pepper in the Peruvian Amazon region. This fruit has high economic value due to its high consumption in the local gastronomy as fresh fruit, powder, pickles, and sauce at national and international levels. Considering the consumer trends towards the demand for natural food, in which high sensorial quality, safety, high nutritional value, healthy options, low prices, and minimum processing with environmentally-friendly production processes are highly appreciated, the lactic fermentation (LF) methodology of CPF is considered a good alternative for food preservation. In addition, LF represents a good alternative for improving the smallholder farmers and rural communities' incomes through the artisanal production of low-value commodities.
LF is an ancient biotechnology technique of food preservation used to maintain and improve food safety, keeping its nutritional, sensory and shelf life properties (Steinkraus, 1996; Buckenhüskes, 1997; Karovicová and Kohajdová, 2003; Demir et al., 2006). Additionally, lactic acid bacteria (LAB) are considered the main microorganisms involved during LF. They contribute with positive effects on human health through the development of probiotics and natural food products which lead inhibitory metabolites and bacteriocin toxins to act as antimicrobial agents, thus replacing chemical preservatives (Ross, 2002; Gaggia et al., 2011). Cabbages, cucumbers and olives are the main fermented and commercialized vegetables and fruits worldwide (Montet et al., 2006; Rodríguez et al., 2009). Several factors such as pH, water activity, oxygen availability, temperature, nutrients, selected starter culture, inoculum concentration, and salt concentration, could influence LF optimization and affect the growth and activity of LAB during the fermentation process (Lee and Salminen, 1995; Ballesteros et al., 1999). Sodium Chloride (NaCl) is one of the most historically important factors. Its concentration stimulates salt tolerant LAB growth, and, moreover, it inhibits growth of unwanted microorganisms (Rao et al., 2004). Availability of fermentable carbohydrates has been described as an important factor in the preparation of vegetables and fruits for LF (glucose and fructose) (Ray and Panda, 2007; Wouters et al., 2013).
Response surface methodology (RSM) is a statistical method used for developing, improving and optimizing complex processes. Box and Wilson (1951) described this method and it can be defined as the assessed interaction between independent variables and response to find out the best conditions for a multivariable system (Gomes et al., 2013). The main advantage is to reduce the number of experiments required even when a large number of variables is involved, being less laborious and time consuming than other methods (Wu, 2002). This method has been extensively applied in the optimization of several food fermentations, such as York cabbage, cassava, apple, palm, mulberry, and radish (Ghosh et al., 2012; Jaiswal et al., 2012; Nwabueze and Odunsi, 2013; Wang et al., 2013; Joshi et al., 2015; Peng et al., 2015). Central Composite Design (CCD) provides favorable predictions from a second order fitting with a stable variance. This design combines the factorial design with axial runs and center points to produce CCD experiments. Axial runs are included in the design to introduce quadratic terms in the model as long as the center points are used to check the curvature of the response surface. The model equation is obtained after performing the regression analysis of experimental results, and the desirability function is further applied to obtain the optimal parameters (Jou et al., 2014).
The aim of this study was to optimize the LF of CPF using RSM. A CCD was conducted to evaluate the effect of NaCl and glucose concentrations added on the acidification rate during LF, and to obtain the optimum parameters to improve the CPF fermentation process.
Materials and methods
Native Peruvian CPF
CPF belonging to "Ají Charapita" variety were aseptically hand-recollected from rural areas in Iquitos city and transported to a lab under controlled conditions. Samples were fermented in the laboratory of Molecular Biology in the Faculty of Farmacia y Bioquímica at the Universidad Mayor de San Marcos (Lima, Peru).
Preparation of LF
CPF were selected under sterile conditions, according to their size and ripeness stage. The stalks from CPF were separated. CPF were rinsed two times with distilled sterile water and then drained off. LF was prepared in sterile plastic containers. Then, 35% (w/v) of CPF was placed into each container. A brine solution, according to each tested condition, was added up to 100 mL.
LF conditions and sampling
The brine solution for LF was added using three values for two variables: 0, 5 and 10% NaCl (Calbiochem, Darmstadt, Germany) with 0, 2.5 and 5% glucose (Amresco, Ohio, USA), as indicated in the experimental design (see below). LF was considered finalized when the reducing sugar content was below 1 gL-1. LF was carried out at room temperature. Brine samples from the starting mixture (d 0) and throughout the LF were taken at: 0, 3, 6, 12, 18, 27 and 37 d.
Chemical analysis
Acidity, sugar concentration and pH were monitored throughout the process (at the frequency mentioned above). Total titratable acidity was determined according to the Official Methods of analysis by the Association of Official Analytical Chemists (AOAC). Reducing sugars were measured by a 3,5-dinitrosalicylic acid (DNS) assay (Miller, 1959).
Microorganism count
The total microorganism cells were counted under a microscope using a Neubauer counting chamber. The different brine samples were grown on four specific culture media: MRS agar (Merck, Darmstadt, Germany) supplemented with nystatin (Merck, Darmstadt, Germany) and sodium azide (Merck, Darmstadt, Germany) (both 100 mg L-1) for the selective enumeration of LAB. YPD agar (containing 2% glucose, 2% peptone, 1% yeast extract, 2% agar; w/v) was supplemented with chloramphenicol (Applichem GmbH, Darmstadt, Germany) (100 mg L-1) specially for the yeast count. McConkey agar (Oxoid, Basingstoke, United Kingdom) was used to enumerate enterobacteriaceae and Cetrimide agar (Merck, Darmstadt, Germany) for Pseudomonas. All plates were incubated at 30°C for 1-3 d in aerobic conditions; with the exception of MRS media in anaerobic conditions using Anaerocult A (Merck, Darmstadt, Germany), anaerobic bags and anaerobic indicators (Oxoid, Basingstoke, United Kingdom).
Experimental design (ED)
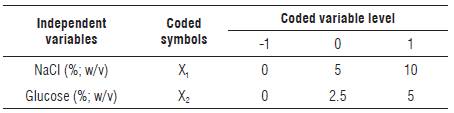
A factorial design 32 was used. NaCl (X1) and glucose (X2) concentrations were considered as independent variables to study the concentration effect on the LF of CPF. Each variable was studied at three different levels (-1, 0, +1) represented in Table 1. The selection of level for both independent variables was chosen after assessing the recovery of viable LAB and the further acidity production.
In this study, the CCD was assumed as a limit value (equal to 1). Points outside the "safe" area were not tested. The dependent variable was the acidification rate (% acidity/day), which was estimated as the maximal slope obtained from the representation of acidity production during LF time.
The analysis of the ED data and the calculation of the predicted response were carried out using the RSM, Minitab software. The analysis of variance (ANOVA) was used to determine the statistical significance of the model (P-value<0.05). In order to understand the effect of NaCl (variable X1) and glucose (variable X2), concentrations on the acidification rate, experimental data were fitted using the model described by the Eq. (1) that includes linear, quadratic and interaction terms:

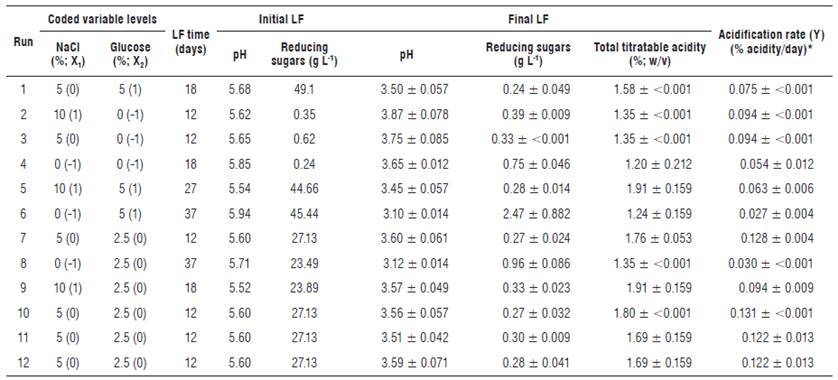
Where Y is the dependent variable (acidification rate), B corresponds to the regression coefficients: B0 is a constant, B1 and B2 are the linear coefficients, B11 and B22 are the quadratic coefficients, and B12 is the interaction coefficient between variables 1 and 2. X1 and X2 correspond to the independent variables. Twelve LF conditions (Tab. 2) were tested and the sequence was randomly established to limit the influence of systematic error in the interpretation of results. Experiments 1-9 (Tab. 2) allowed the calculation of regression coefficients, while experiments 10-12 (Tab. 2) were replicates at the central point of the ED in order to estimate the influence of the experimental error. Each LF of ED point was carried out with one replicate and the mean values were reported as observed responses.
Results and discussion
LF of vegetables and fruits can be influenced by the addition of salt, glucose and some acids to the brine, which finally influences the pH (Pérez-Díaz et al., 2013). Microbiologically, LAB are the main microorganisms responsible for this type of fermentation process. However, yeasts are also involved, but depending on the salt concentration and other environmental factors (Arroyo-López et al., 2008). In this research, the hypothesis that the selection of adequate fermentation parameters favors the growth of LAB was stated, and, therefore, an increase of the acidification rate. Prior to this study, the variation of NaCl, glucose and acidity concentrations were evaluated independently. Due that there was no variation of the acidity concentration in terms of acidification rate, this variable was discarded. (results not shown).
Chemical analysis
Twelve LF of CPF were performed using different NaCl and glucose concentrations (Tab. 2). One of the replicates of LF at initial stages was chemically analyzed. The LF were considered as finished when the reducing sugar content was below 1 g L-1, and the total titratable acidity remained stable. Thus, LF conditions containing 5% NaCl with 0 and 2.5% glucose, and 10% NaCl with 0% glucose finished faster (12 d). Furthermore, LF process without NaCl but containing 2.5 and 5% glucose were slower (37 d), despite the reducing sugars of the last LF condition were tested above 2 g L-1. It is known that a strong brine solution draws sugar and water out of the vegetables (Panda et al., 2009). This effect was noted mainly in those LF conditions without glucose, where an increase of reducing sugars was determined on the third day (Fig. 1). A critical factor in sensorial quality and reduction of the microbial action of many fermented vegetables and fruits is the pH (Spyropoulou et al., 2001; Muyanja et al., 2003; Rao et al., 2004; Ogunjobi et al., 2005). Therefore, pH values at the final of all LF conditions ranged between 3.10 and 3.87 decreasing the initial pH by two units respect to their initial value (Tab. 2). A decrease, not correlated to the LF conditions, was also observed on the microbial biodiversity in relation to the starting population, being present at the beginning of the LF the four microbial groups analyzed, while at the end only two or three groups were observed (Fig. 1). The total titratable acidity determined during LF is normally associated with an increase in organic acids, mainly lactic acid which minimizes the presence of contaminant microorganisms (Steinkraus, 1997; Spyropoulou et al., 2001). The total titratable acidity at the initial stage of all LF conditions was 0.225%, while the highest concentrations were obtained on LF conditions containing 10% NaCl with 2.5 and 5% glucose (1.91 ± 0.159%) followed by 5% NaCl with 2.5% glucose (between 1.69-1.80%). By contrast, the lowest concentrations were obtained in those LF without NaCl and glucose (Tab. 2, LF 2, 3, 4, 6 and 8).
A fast acidification rate is desirable in fermentations because rapid fermentation of raw materials could prevent the growth of undesirable microorganisms which may affect the aroma, texture, and taste of the final product (Akabanda et al., 2014). The fastest acidification rates (determined as the ratio between the difference of the final and initial acidy values, and the LF time) were recorded in the LF conditions containing 5% NaCl with 2.5% glucose (0.122- 0. 131°% acidity/day) followed by 5% NaCl with 0% glucose, 10% NaCl with 0% and 2.5% glucose (0.094% acidity/day).
Microbiological analysis
The microbiological results of nine LF conditions are shown, due to the similar values among the central point replicates (5% NaCl with 2.5% glucose).
The microbial counting was performed by microscopy and plating. Total cell counting by microscope showed populations ranging from 106 to 109 cells mL-1. However, when plated in four specific culture media, the population recovered in these media ranged from 103 to 108 CFU mL-1. The reasons for the differences on the microbial count between microscopy and plating could be due to: (1) the viable but non-culturable state adopted as a strategy by microorganisms in response to adverse environmental conditions (Ramamurthy et al., 2014), and (2) the presence of different microorganisms able to grow on the culture media used in this research.
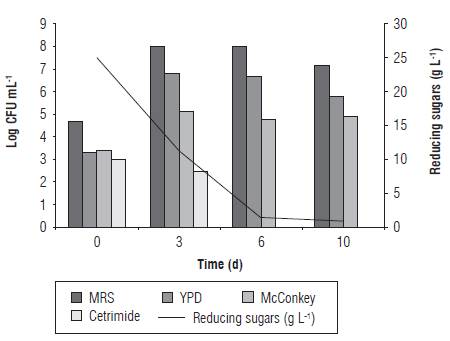
The first day of sampling (d 0) was characterized by a higher presence of enterobacteria and Pseudomonas bacteria compared to the remaining microorganisms studied (Fig. 1). However, according to viable counts, LAB were considered the main microbial group responsible for LF containing NaCl because in all assays with these conditions it was the principal isolated microbial group. Yeasts were mostly recovered after the 6th d of LF process with 10% naCl. However, yeasts along with Enterobacteriaceae were the second most recovered microbial population during all the LF process. These results agree partially with those reported by Fleming (1982), where the Gram-positive and Gram-negative bacteria were the main organisms responsible for the fermentation process at the initial stages, and the lactic acid bacteria with or without fermentative yeasts were leading the primary fermentation process until the fermentable carbohydrates were consumed or until the Lab were inhibited at low pH values. Finally, acid-tolerant fermentative yeasts were responsible for the secondary fermentation until the fermentable carbohydrates were totally consumed.
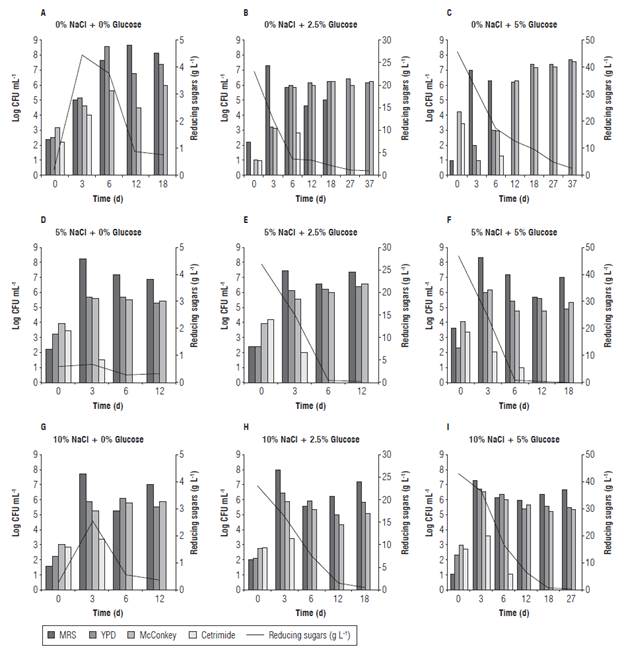
FIGURE 1 Evolution of the microbial populations for LF of CPF. Effect of NaCl or glucose concentrations on microbial recovery and sugar consumption.
For LF condition without NaCl and glucose, yeasts and LB were the microorganisms responsible for starting and ending the LF, respectively; but, while the LF condition without NaCl with 2.5 and 5% glucose remained, the LAB were predominant until d 6 leading yeasts and Enterobac-teriaceae to finish the LF process.
Enterobacteriaceae and Pseudomonas are gram negative fermentative and non-sugar fermentative bacteria, respectively. These microorganisms come from the farm and their presence at the initial stages of the fermentation process is harmful because they could spoil vegetables and fruits as well as they could produce undesirable metabolites that would affect their sensorial quality. It is possible that the recovery of Enterobacteriaceae populations would have declined if the CPF had previously been disinfected with a sodium hypochlorite solution following the food industry standard procedure. (Fukuzaki, 2006). LF with 5 and 10% of NaCl seemed to be more adequate because these conditions favored the recovery of LAB and yeasts.
RSM analysis
RSM analysis was applied to the acidification rate resulting in the twelve LF performed (Tab. 2). The regression coefficients of the model and their statistical significance are described in Table 3. The "fitness" of the model was studied through coefficients of determination (R2), probability values (P) and lack-of-fit values (Tab. 3 and 4).
TABLE 3 Regression coefficient, significance level (P), R2 and F values of the quadratic model determined for acidification rate (Y).
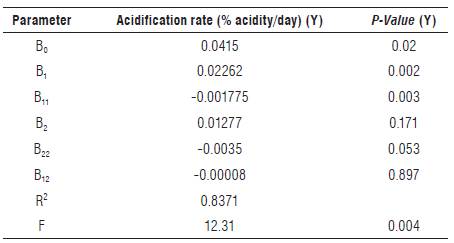
TABLE 4 ANOVA for the response surface quadratic model determined between response variable (Y) and independent variables (X1, X2).
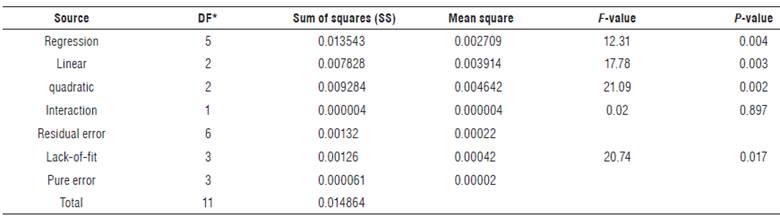
* DF: Degrees of Freedom.
From the variables presented in Table 3, the linear term (B1) of NaCl had the most significant effect (P = 0.002) on the acidification rate, followed by the quadratic term (B11) of NaCl (P = 0.003). On the contrary, the linear and quadratic term of glucose and their interaction with NaCl did not have any significant contribution towards acidification rate. The R2 of the predicted model was considered appropriate (R 2 = 0.8371; P = 0.004); however, the P-value for the lack-of-fit was less than 0.05 (P-value = 0.017) (Tab. 4), indicating that the predicted model of acidification rate can be reasonably represented by the mathematical model in the Eq. (2).

Contour plots for acidification rate are represented in Figure 2. In this plot, it is shown that the best LF conditions ranged from 4.3 to 8.4% NaCl and from 1 to 3.45% glucose, theoretically obtaining an acidification rate higher than 0.12% acidity/day.

Optimal conditions
The "Response Optimizer" option of the program MI-NITAB was used to identify the best LF conditions for increasing the acidification rate. It was evaluated by the "Composite Desirability" where a value equals to 1 corresponds to the ideal case, while 0 indicates that the response is outside the acceptable limits. The specified targets (maximize) in order to increase the acidification rate were 0.027 and 0.131% acidity/day as minimum and maximum value, respectively. Thus, the optimized conditions were as follows: 6.25% NaCl and 1.77% glucose. The "composite desirability" determined by the software was equal to 0.9357 with an acidification rate of 0.1243% acidity/day.
Finally, a new experiment was done by triplicate with the optimized LF conditions as described above. The pH value, reducing sugars and total titratable acidity at the initial stages of the LF process were 5.30±0.193, 24.74±3.978 g L-1 and 1.04±0.054% (w/v), respectively. LF time was slightly shorter (10 d) (Fig. 3). The final pH values, reducing sugar and total titratable acidity were 3.09±0.015, 1.04±0.054 g L-1 and 1.35%±0.001 (w/v) respectively, while the acidification rate was 0.113%±0.001 acidity/day. This LF, the values of the final total titratable acidity and acidification rate were lower than those obtained with 5% NaCl and 2.5% glucose together. The low total titratable acidity values and acidification rates can be explained due to the different crops the assessed fruits came from compared to those that were analyzed on the prior LF process.
Microbiologically, LA B remained as the most recovered microorganism during the LF. Yeasts were the second most recovered microbial population followed by Enterobacteriaceae. In contrast, Enterobacteriaceae and Pseudomonas were not the most predominant microorganisms at d 0 (Fig. 3).
Conclusions
NaCl and glucose, as the main parameters involved in LF, were studied carefully. The suitable concentrations for both compounds were determined using RSM. The optimum conditions based on the maximum acidification rate as response were 6.25% NaCl and 1.77% glucose, but experimentally the acidification rate was slightly lower that other LF conditions. Microbiologically, LAB were the microorganisms responsible during LF, followed by yeasts. Finally, studies on the microbiota of LAB and yeasts at strain and species levels involved during the LF of CPF are recommended in order to continue with fermentation process optimization.

