


 Inglês (pdf)
 Artigo em XML
 Referências do artigo
 Enviar este artigo por email
 Citado por SciELO
  Citado por Google
  Similares em
SciELO
Similares em
SciELO  Similares em Google
 Permalink
Introduction
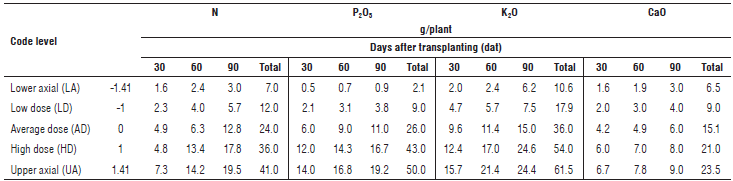
Scientific and technical literature on the Andean blackberry (Rubusglaucus Benth.) yield regarding nutrient requirements and extraction levels is still in its initial stages, and there are still big differences in fertilizer applications (sources and amounts). This information is of utmost importance for achieving higher production and yield (Santos et al., 2014). Currently, the Andean blackberry is produced with a mixture of diverse materials and agronomic management practices, urgently requiring a different type of management. One of these materials is the thornless Andean blackberry, which was obtained from the Colombian coffee-growing region, possibly through spontaneous generation (Morales and Villegas, 2012). It has a higher number of productive branches (female) and a lower number of non-productive branches (whips). Additionally, it shows higher tillering than the Andean blackberry with thorns (15 to 20% superior) (Bernal and Díaz, 2006), inferring a consumptive use that is different from that of the genotype with thorns. In this sense, various researchers have evaluated nutrient consumption in the thornless Andean blackberry, comparing it with the one with thorns. Bolaños-Benavides et al. (2014) carried out applications of 36 g, 43 g, 18 g and 9 g of N, P2O5, K2O and CaO per plant, respectively, finding that thornless plants had a higher height with significant differences (P<0.05) (9.93 cm and 20.83 cm, 30 and 90 d after transplanting (dat), respectively), as compared to plants with thorns, with height values of 8.11 and 20.55 cm at 30 and 100 d of accumulating nutrients, respectively (Cardona et al., 2016). However, the experience acquired by producers and technicians has led to fertilizing 60 d after planting, and this practice continues every 90 d until one year of establishment is reached (Betancur-Cardona et al., 2014). Adequate and accurate nutrient application for plants starting in the initial growth stages (Marschner, 2011) favors the rooting process and gives seedlings higher vigor (Razaq et al., 2017).
Based on this empirical practice and in order to have plants with adequate nutrition when transplanted to uncontrolled conditions, the aim of this study was to estimate optimum doses of N, P, K and Ca in thornless Andean blackberry plants under nursery conditions, developing their genetic potential once they have been established as a commercial crop.
Materials and methods
Study site location
This study was carried out in the Tibaitatá Research Center of the Corporación colombiana de investigación agropecuaria - AGROSAVIA located at 4°41'43.1349" N and 74°12'18.7666" W, with a mean temperature of 13.1°C, a relative humidity of 80% and an altitude of 2,600 m a.s.l.
Plant material
Thornless Andean blackberry vitroplantlets were propagated in the micropropagation laboratory of AGROSAVIA. Then, the plant material was placed in transparent trays with inert peat moss, adding 1 g of the fungus Glomus proliferum Dalpé et Declerck strain GB02 (60 to 70 spores g-1) for the hardening stage (30 d). Finally, each plantlet was sown in recipients with 500 g of peat moss: sand: rice husk at a volume: volume ratio of 2:1:1.
Experimental design and statistical analyses
The treatments were analyzed using a composite central design, defining 25 treatments and applying the following equation: 2k + 2*k + 1 (where k is the number of factors: N, P, K and Ca).
This experiment was established in a greenhouse (the climatic conditions during the evaluations had a maximum temperature of 21°C, with an average of 19°C and a minimum of 17°C; in the case of relative humidity, a maximum humidity of 71%, an average of 57% and a minimum of 35% were registered) in complete randomized blocks with 25 treatments, three (3) blocks and 15 plants per experimental unit. The application frequency was every four d for three months, i.e. 24 applications, administering a volume of 44 mL of nutrient solution per plant. The concentration of the nutrient solution applied increased every month according to plantlet development (Tab. 1). The basis for this nutrient solution was the Hoagland and Amon solution, N, P, K and Ca concentrations according to the fertilization treatment and maintaining the original Mg, S and micronutrient concentrations. Destructive sampling was carried out 30, 60 and 90 d after transplanting (dat). The following variables were registered: plant height (PH) using a ruler with millimeters and measuring from the base of the stem to the growth point, leaf area (LA) using a CI - 202 portable measuring device (CID Bio-Science, USA), and root volume (RV). In this method, the entire root was placed inside the test tube with a known water volume, with the root system volume corresponding to the displaced water. Other variables included the number of leaflets (NL), leaf dry matter (LDM), stem dry matter (SDM), root dry matter (RDM), and total dry matter or plant dry mater (TDM). In each destructive sampling, the plants were processed as follows: a) petiole and lamina, b) stem, and c) roots. To measure the dry matter, the material was placed in paper bags and placed in an oven at 70°C for 24 to 48 h until constant weight; then, an analytical balance (Mettler Toledo Model AB204) was used to measure the dry matter.
TABLE 1 Nutrient level specifications for constructing the treatment matrix for 30, 60 and 90 dat according to the Central Composite Design.
The statistical analysis included regression models selecting significant terms (P<0.05) of a saturated model with lineal and quadratic effects for doses of N, P, K and Ca with their double interactions, simple effect and interaction over time. The data processing was carried out with SAS 9.3 (SAS Institute, Cary, NC, USA).
Results and discussion
At 60 d after transplanting, the Andean blackberry plants presented differential values for the recorded allometric variables, showing higher averages for the leaf area, plant height and root length, as compared to 90 d after transplanting (Tab. 2). In contrast, the variables related to accumulation of dry matter in each organ and number of leaflets presented incremental averages over time.
TABLE 2 Descriptive statistics of the analyzed variables.
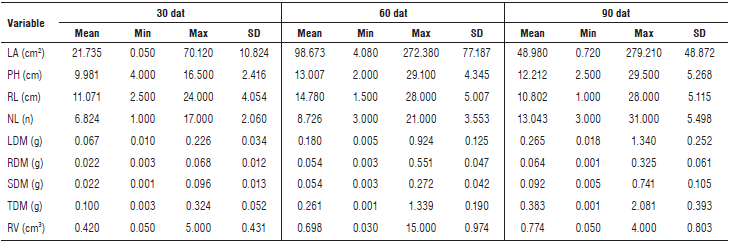
Min: Minimum; Max: Maximum; SD: Standard deviation; LA: Leaf area; PH: Plant height; RL: Root length; NL: Number of leaflets; LDM: leaf dry matter; RDM: root dry matter; SDM: stem dry matter; TDM: total dry matter; RV: Root volume.
Plant weight accumulation
According to the ANOVA (not included), the dry matter accumulation in the leaves, stems, roots and in the entire plant (total) was significantly influenced (P<0.05) by the doses of N, K, P and Ca, with some interactions described below. In all of the plant organs, the biomass varied because the Ca dose effect followed quadratic tendencies, but the response rate was variable over time, indicating that the Ca requirement increased with plant growth, but an excess Ca dose can be detrimental.
The P doses had a significant quadratic effect (P<0.05) on RDM accumulation, at a rate that varied according to plant growth; hence, the temporal role in initial root system growth was found; likewise, K can modify P response through an interaction. These results contrast with those found by Ascencio and Lazo (2001), who argued that P absorption by roots is better explained by total root length and not by root system dry weight, which were taken as a reference point. On the contrary, Bayuelo-Jiménez et al. (2011, 2012) stated that root formation is not related to plant size, but to the efficiency in phosphorus absorption. On the other hand, Benavides-Mendoza (2011) stated that root system dry matter can increase its length. "increasing root dry weight might reflect an increase in root length"
However, when developing biomass in any of the plant organs, the Ca dose effect interacted with the N dose effect consistently over time. This means that the excess Ca dose inhibited or reduced the effect of the N dose. Castaño et al. (2008) evaluated nutritient deficiencies in the Andean blackberry, finding that a lower RDM was registered in the Ca treatment, stimulating cellular division in the meristematic points and stabilizing cells during division. Riveras et al. (2015) mentioned the role that Ca plays in the regulation of nitrogen absorption. A P x Ca effect was observed in the leaves (P<0.05), indicating that the excess Ca also affected the plant response to the P dose in the LDM.
The response rate of the N dose was affected by plant growth only in the LDM (P<0.01). Likewise, Yang et al. (2014) stated that absorption in leaves changes over time and has a narrow relationship with the growth rate. Moreover, Castaño et al. (2008), in a treatment without nitrogen, found the lowest SDM resulted from the role of this element in growth, tissue formation and dry matter accumulation.
The RDM was affected by every evaluated nutrient; however, according to the analysis of variance, N and K had a stable response over time, indicating that the root absorbs these elements in the amount required by growth. Castaño et al. (2008) found that the highest RDM average was obtained in the treatment without nitrogen, as seen by Cánovas et al. (2016), who stated that a decrease in the nitrogen concentration promotes an increase in root system length during initial growth stages.
The SDM responded to the K and Ca doses at a different rate according to the plant growth; however, there was no interaction between the K and Ca doses, indicating independent functions in this organ. One of the main functions of Ca is the formation of the structural part of the protopectin, keeping cells together as they are located in the medium layer and the primary cell wall (Al-Shemmar et al., 2013).
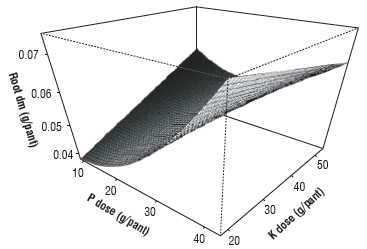
The surface analysis for the RDM response (Tab. 3) showed a positive response to the N dose increase; however, this effect was reduced with the higher doses of Ca. Likewise, there was a quadratic effect towards the maximum RDM, with an increase in the P doses (P2), but it was reduced when high doses of K were applied (Fig. 1). Therefore, doses of Ca and K must be low (CaO < 9 and K2O < 18) in order to favor positive N and P effects. Kim and Li (2016) found that high doses of P favored biomass accumulation in the root system when analyzing the effects of reduced phosphorus on shoot and root growth, partitioning, and phosphorus utilization efficiency in Lantana camara. The most favorable treatment with these conditions was the one that had the doses of 36 g of N, 43 g of P2O5, 18 g of K2O and 9 g of CaO per plant, which match the highest average observed between the treatments. Another proposed dose is 36 g of N, 50 g of P2O5, 18 g of K2O and 9 g of CaO per plant; this could increase RDM by 12% (0.15 units of weight) according to the established model.
TABLE 3 Regression coefficient estimation and associated error per regression model in terms of RDM, LDM and SDM.
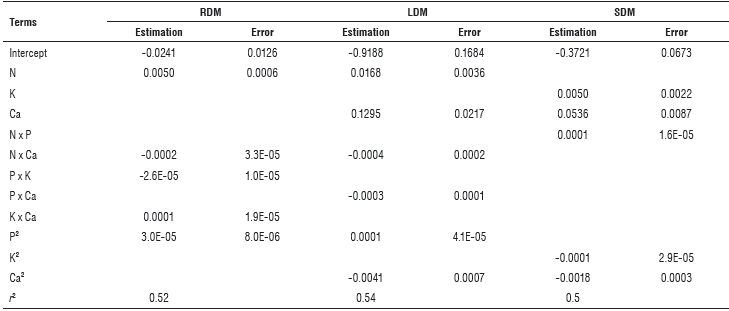
All of the coefficients in the table are significantly different from zero (0) according to the /-test at 5% significance. Empty cells indicate terms that were not included in the model because they did not contribute significantly. r2: coefficient of determination; RDM: root dry matter; LDM: leaf dry matter; SDM: stem dry matter.
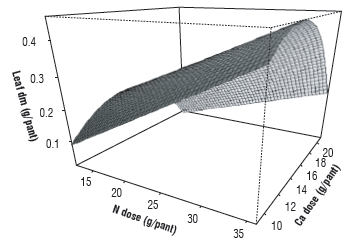
In the case of the LDM (Tab. 3), there was a positive effect, with an increase in the N dose that was reduced with high amounts of Ca (CaO ≥ 15 g/plant) (Fig. 2). Accordingly, the Ca effect had a quadratic tendency, indicating that the LDM followed a curve as a function of the Ca dose, with a maximum response at 15 g of CaO/plant according to the derivative calculations. Moreover, P had a positive effect on the LDM, although it may have been unfavorably affected by the high Ca doses. Finally, the model discarded K, with lower doses chosen because of economic costs (K2O ≤ 18 g/plant). According to these conditions, the dose of 36 g of N, 43 g of P2O5, 18 g of K2O and 9 g of CaO per plant was favorable for the LDM. However, with this model, it is possible to predict that, with a dose of 15 g of CaO per plant (optimum value by derivation), a 4% higher point is reached (0.52 units of weight). For the observed averages, the dose of 41 g of N, 26 g of P2O5, 36 g of K2O and 15 g of CaO per plant also showed a good LDM result. This treatment had a Ca level that matched the level recommended by the model, and the effect of reducing the P dose was compensated by the higher N dose; nevertheless, the K dose can be reduced to 18 g/plant according to the model without changing the result in the LDM, which would reduce costs for potassium fertilizers. In other words, adjusted proposal is 41 g of N, 26 g of P2O5, 18 g of K2O and 15 g of CaO per plant; however, this result should be validated. Parra-Terraza et al. (2010) found that a higher LDM may be related to higher leaf area values, decreasing the stress caused by Solanum lycopersicum plantlet transplantation, facilitating establishment.
For the SDM (Tab. 3), the model had a quadratic tendency in response to the K dose and a maximum weight with 40 g of K2O per plant. Parra-Terraza et al. (2010) assessed the nitrate/ammonium/urea ratio and potassium concentrations in S. lycopersicum plantlet production, finding that K concentrations did not present significant differences in leaf, stem and root dry weight.
As in the results for the LDM, there was a positive Ca effect that followed a quadratic tendency with a maximum LDM with 15 g of CaO per plant (Fig. 3). Finally, a positive N x P interaction was found, indicating an advantage in increasing their doses for higher SDM effects (N>36 g, P2O5>43 g/ plant). The closest treatment for the conditions suggested a dose of 41 g of N, 26 g of P2O5, 36 g of K2O and 15 g of CaO per plant. This treatment had the best response although, when using this model, a maximum SDM with a dose of 43 g of P2O5 per plant is expected, generating an increase of 24% in the SDM (0.25 units of weight); however, this result should be validated. The adjustment of 36 g to 40 g of K2O per plant did not have a strong effect on the SDM according to the model (<1%).
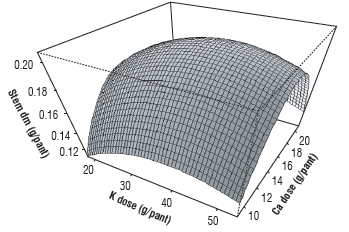
FIGURE 3 The surface analysis for the stem dry matter (SDM) response to the combined effect of K and Ca.
Furthermore, the application of N and P was more important for the leaf and root development, whereas the high application of K and Ca was unfavorable. In this plant development stage, when root system development must be strengthened, the treatments with good levels of N and P must be selected even if they are not the most favorable to increasing stem biomass.
Allometric variables
The allometric variables were significantly influenced (P<0.05) by the N, P, K, Ca doses and their interaction, as described below. On one side, the K and P negative interaction had a significant effect on the root volume (RV) (Tab. 4). The effect of Ca was positive and followed the curve with a peak when the Ca dose was 12.5 g per plant. Additionally, the effect of N was positive and lineal, and, according to the model, this treatment achieved high RV values with a dose of 36 g of N, 9 g of P2O5, 54 g of K2O and 9 g of CaO per plant, with an average of 1.24 cm3. However, the Ca dose could be increased to 12.5 g of CaO per plant in order to achieve a 9% higher volume (1.35 cm3). Then, in this proposal, a dose of 9 g of P2O5 per plant is low, but produces a higher response in RV when 54 g of K2O per plant is applied. RV results would be better if P dose were increased and K dose were decreased, according to P x K interaction. So, in the data observed, the dose of 24 g of N, 50 g of P2O5, 36 g of K2O and 15 g of CaO per plant had a higher average (1.46 cm3), 30% higher than what was expected by the model (1.01 cm3). Another treatment that can be proposed is 36 g of N, 43 g of P2O5, 18 g of K2O and 12 CaO per plant, which had an expected average of 1.30 cm3 and produced the best RDM development.
TABLE 4 Regression coefficients and their associated error for regression model terms per plant growth variable.
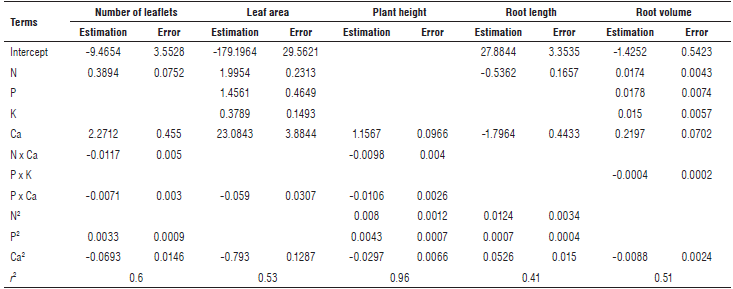
All of the coefficients in the table are significantly different from zero (0) according to the /-test at 5% significance. Empty cells indicate terms that were not included in the model because they did not contribute significantly. i 2: Determination coefficient.
These results contrast with those found by Koning et al. (2015), who evaluated the effects of nitrogen and phosphate fertilization on the leaf nutrient content, photosynthesis, and growth of Fallopia sachalinensis cv. 'Igniscum Candy'; they observed a significant increase when the nitrogen concentration was increased in the growth media. Nitrogen had a significant effect (P<0.05) on root system growth (root length and volume) over time; these results agree with the findings of Rivera-Espejel et al. (2014), who evaluated the fertilization of S. lycopersicum with nitrate and ammonium, finding significant differences when compared to the absolute control (root that only grew with water). According to Frias-Moreno et al. (2014), high N doses induce a higher development of the stem and leaves in S. lycopersicum, but decrease root system growth.
For leaf area (LA) (Tab. 4), the Ca effect was very strong according to the model and showed a response curve with a peak when the CaO dose was 14.6 g per plant (by model derivation). This result is very close to the mean model dose (i.e. 15 g of CaO per plant). In this respect, Vargas-Bolívar et al. (2009) evaluated nutrient deficiencies in S. quitoense in nurseries, finding that the absence of calcium had a significant positive effect on LA as compared to plants irrigated only with water and calcium.
Calcium interacts negatively with P; however, the dose effect of P was positive, such as N and K. Therefore, high doses of N, P and K increase LA (> 36 g of N, > 43 g of P2O5, and > 54 g of K2O per plant). Xiang et al. (2012) found a decrease in height, leaf area and stem diameter in Glycine max plants cultivated without phosphorus fertilization because this nutrient is essential as a tissue constituent that acts directly on plant height (PH). Because of the Ca x P interaction, a P dose should not be too high, with a Ca dose near the medium level. The results established that the dose of 41 g of N, 26 g of P2O5, 36 g of K2O and 15 g of CaO per plant was most similar to the assessed conditions, obtaining the highest result, 26% higher than what was expected by the model.
Luo et al. (2017) stated that a lack of nitrogen inhibits elongation and cellular division. Likewise, White et al. (2015) argued that nitrogen is present in many essential compounds, and because of that a plant grows slowly when there is low availability of this nutrient. These results agree with results found by different authors for plant height (PH) when nitrogen is applied together with phosphorus and potassium (Dhillon et al., 2011; Xiang et ah, 2012).
For the leaflet number (LN) (Tab. 4), the model indicated the importance of Ca dose management, showing a maximum response level with 11.1 g of CaO per plant according to the derivation model. Moreover, there was a negative Ca interaction with N and P. For the N dose, there was a positive effect, indicating that high doses are recommended for increasing LN (> 36 g of N per plant). Nevertheless, including P, the model had a quadratic tendency, where an increase in dose produced a maximum LN response. P doses associated with the maximum were out of the range of the experimental design, so the LN response to 50 g of P2O5 per plant is not known. Finally, K did not influence the LN; and therefore, low doses are recommended for decreasing costs (< 18 g of K2O per plant). Nonetheless, the treatment with the best response was 36 g of N, 43 g of P2O5, 18 g of K2O and 9 g CaO per plant, but, according to the model, a slightly superior response was obtained with 11 g of CaO (19.3 leaflets as compared to the 19 leaflets obtained with 9 g of CaO per plant).
Additionally, Preciado-Rangel et al. (2002) mentioned that the number of leaves is related to photosynthesis and, therefore, to a higher production of carbonate skeletons that are used or stored in the stem. On the contrary, Magdaleno-Villar et al. (2006) stated that the number of leaves is not a reliable indicator of plantlet production because it mostly depends on the age of the plant.
In addition, the PH (Tab. 4) was defined primarily by the Ca dose, with a quadratic tendency and a peak when the CaO dose was 6 g per plant. This element interacts negatively with N and P. Since the N and P effects were positive in the aerial length, high doses are better (>36 g of N, and >43 g of P2O5 per plant). Li et al. (2016) reported that phosphorus contributes to the growth and elongation of internodes, stimulating cellular division.
The effect of K was not significant, so the application of low doses is recommended because of economic costs (<18 g of K2O per plant); this effect is similar to the one found by Sa et al. (2014), who did not register an effect of potassium applications on the growth of Corymbia citriodora plants, even when they were cultivated in a soil with a low content of this nutrient. Therefore, the most favorable treatment according to these conditions was 36 g of N, 43 g of P2O5, 18 g of K2O and 9 g of CaO per plant; moreover, it had the highest average (20.8 cm). A slight improvement with a dose of 6 g of CaO per plant is expected, but only 2%.
Conclusions
The dose of 36 g of N (high), 43 g of P2O5 (high), 18 g of K2O (low) and 9 g of CaO (low) per plant allowed good development of the root system under nursery conditions, both in dry matter and in length, as compared to the other evaluated doses. Likewise, it favored a higher number of leaflets, aerial length and leaf dry matter, which are decisive variables in plant establishment under field conditions. Therefore, this dose is adequate for an integrated fertilization program because it will result in plants with adequate growth, which can later be transplanted to uncontrolled conditions under standard cultivation systems.
Furthermore, high doses of K (above the doses proposed) can favor a greater leaf area, but are unfavorable for root system development and other allometric variables.
There was a negative interaction between the nitrogen and phosphorus fertilization and the calcium fertilization. The high doses of Ca did not favor the application of elevated levels of N and P, and, under that condition, it was, in general, detrimental for plant growth.
These conclusions apply only for the first three months of Andean blackberry plant growth. According to the analysis of the results during the growth period, the plants tended to be saturated quickly, so it would be difficult to extrapolate plant behavior beyond three months.


