


 English (pdf)
 Article in xml format
 Article references
 Send this article by e-mail
 Cited by SciELO
  Cited by Google
  Similars in
SciELO
Similars in
SciELO  Similars in Google
 Permalink
Introduction
The water requirements of a crop refer to the amount of water and the timing of its application, with the objective of offsetting the moisture deficit of the soil or substrate and the evaporative demand that occurs during the growing season (Arevalo et al., 2014).
During the early stages of a crop, water is lost mainly due to direct evaporation from the soil; however, as development increases and it fully covers the ground, transpiration becomes the most important process (Allen et al., 2006).
There are several factors involved in the process of evapotranspiration: crop characteristics, management, soil or growth medium and atmospheric variables that affect evaporation and transpiration (Allen et al., 2006). The ETc is calculated as the product of the cultivation coefficient (kc) and the evapotranspiration of the reference crop (ETo); with optimum management and adequate water supply, maximum yields are achieved according to climatic conditions. Generally, the correction factor (kc) is required, which depends on the type of crop, variety, age and agronomic management (Allen et al., 2006).
The most appropriate indicator for an irrigation scheduling is measuring the water status of the plant because it best evidences the agronomic response of the crop to the water level that it was submitted to (Vélez et al., 2007). The water status of the plant can be monitored with the leaf water potential or stem potential (*Ft), expressed in Mega Pascals (MPa) and measured with a Scholander pressure chamber (Arévalo et al., 2013).
The cycle of a flower stem is on average 10 to 11 weeks; half of this period is vegetative growth and the other half is reproductive. The growing period is subdivided into bud induction and development of the flower stem, false leaves are closed and most of the time have a reddish color (Rodríguez and Flores, 2006). The reproductive stage starts with the induction of floral primordia (palmiche) coinciding with a color differentiation of the stem and leaves from red to green. The following phenological stages are known as 'rice' (bud diameter around 0.4 cm), and pea (0.5 to 0.7 cm) with fully open leaves and a more rounded bud. Next stages are identified as 'garbanzo' (0.8 to 1.2 cm) with losses of reddish stems and leaves, and 'scratch color' (1.8 to 2.9 cm) the phenology stage when the sepals have begun to spread due to the growth of the bud, further developing the color of the petals. Finally, 'cut' (harvest) indicates when the flowers are ready to be commercialized, but not fully developed (Cáceres et al., 2003).
The growth analysis is based on the development of measurements, such as dry weight, stem length, number of leaves, and number of branches, among others (Arevalo et al., 2013). Furthermore, it can be described from a mathematical point of view through direct measurements, such as total dry mass of the plant, leaf area and time. In addition to derived measurements, there are several growth indexes useful to analyze the plant development rate and state the effect of management strategies on the crop development, such indexes are the relative growth rate (RGR), the crop growth rate (CGR), net assimilation rate (NAR), leaf area duration (LAD), relative leaf area (RLA), leaf area index (LAI), and specific leaf area (SLA) (Melgarejo et al., 2010). The interpretation of the logistic model based on the growth of a parameter that has great commercial value, such as the length of the flower stem, represents a useful tool for programming and agronomic management of commercial rose crops, determining the right time for harvest, according to commercial requirements (Rodríguez and Flores, 2006).
The main objective of this research was to assess the effect of different irrigation levels calculated with the crop evapotranspiration on production and crop quality for the rose (Rosa sp.) Vendela variety planted in substrate. Based on the work carried out, it is recommended to evaluate the effect of applying an 80% of the water needs and a correction factor of the drainage percentage between 30 and 40%, seeking to preserve the quality of the flower stems.
Materials and methods
The experiment was conducted between August and November 2014 (week 35 to 48), on the Santa Maria farm (xv property), in a plastic greenhouse with an area of 5,163 m2, overhead and lateral ventilation with mechanical opening and closing regulated by electric gear motors, structure in galvanized iron pipe, in 5-gauge white polyethylene. During the test weeks, the minimum and maximum average temperatures were recorded as 17.97°C and 20.63°C, respectively. The study area was located in the municipality of Facatativa (Cundinamarca, Colombia), with coordinates 4o46'50.3" N, 74°19'18.0" W and 2,586 m a.s.l. According to the Caldas-Lang model, the area is cold and dry, with an average annual temperature of 13.6°C, and maximum and minimum temperatures of 22°C and 6°C, respectively; the winds usually blow in the south-east direction, with average speeds of 2.6 m s-1; relative humidity of 76%, annual rainfall below 650 mm and actual evapotranspiration between 630 and 640 mm yr-1 (IGAC, 2012).
The studied crop was Rosa sp. Vendela variety, planted in 2013 in a 32.5 m long and 0.8 m wide beds grown in substrate, composed of 80% burnt rice husk and 20% compost within a framework of continuous production, evaluated at all developmental stages.
A completely randomized design (CRD) was used, with three treatments and three replicates per treatment, each repetition had three beds, considering the bed as the experiment unit, for a total of nine beds per treatment. The treatments consisted of three irrigation depths: control treatment T1 with a depth equivalent to 100% of the crop evapotranspiration (ETc), and T2 and T3, equivalent to 80% and 65% of T1, respectively.
During the experiment, the irrigation was programmed by volume, determined daily as a correction factor of the drainage percentage (FDP).
The reference crop evapotranspiration (ETo) was determined daily, with direct readings with a 1 mm precision atmometer (ET gage), between 7:00 and 7:30 a.m. ET gage consists of a canvas covered ceramic evaporation plate mounted on a water reservoir, the reservoir's capacity is 300 mm deep and the green canvas was #54, used to estimate alfalfa reference. The ET gage was installed at the average height of the canopy. Based on the methodology established by Allen et al. (2006), the crop evapotranspiration (ETc) was determined with a fixed crop coefficient value (kc) of 0.94 recommended by Rodríguez (1998) to program irrigation and production optimization with minimal drainage depth.
Planning to assess and monitor the drained volume, nine volume lysimeters were installed, three per treatment, to calculate the drainage percentage (%D), as the ratio of the drawn depth and net applied depth. The crop coefficient (Kc) was calculated from the ETi/ETo ratio, where (ETi) is quantified as the water balance (difference between the volume of water applied by irrigation and drained volume in the lysimeter), taking the changing soil moisture as a constant value.
The growth of the stem and the bud was monitored for two crop cycles, the first beginning at 35 weeks and the second at 39, approximately nine weeks per cycle, obtaining simple sigmoidal type curves, with three growth phases: logarithmic, linear and senescence, as described by Salisbury and Ross (1994). Additionally, the absolute growth rate (AGR) and relative growth (RGR) were evaluated for the bud and stem.
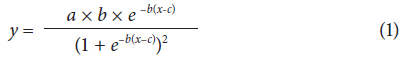
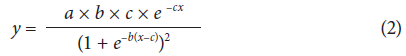
The equations used were mostly adjusted from the model obtained after calculating the AGR of the stem length (Eq. 1) and bud diameter (Eq.2). Equations as follow:
A second set of equations was adjusted from a model obtained from the RGR of stem length (Eq.3) and bud diameter (Eq.4). These equations were:
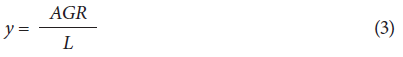
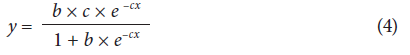
where, y is the absolute rate of stem growth, a is the maximum final dimension, b is day on which the highest growth rate occurs, c is the relative rate of growth at the inflection point, x is time in weeks and L is stem length.
Thirty-six (36) stems per treatment were labeled. The measurement was made in the vegetative phase and in the reproductive phases; "palmiche" is the induction of the floral primordium, followed by "rice" with less than 4 mm in diameter, "pea" with an approximately 0.5 cm long peduncle, "garbanzo" with a peduncle with an average length of 4 cm, and approximately thirteen pairs of leaves, "double garbanzo" with a peduncle approximately 9 to 12 cm long, "scratch color" in which the color of the petals is observed, and "cutoff". The production of the floral stems was measured weekly per bed for each treatment and repetition.
The production results and floral stem growth were analyzed using descriptive statistics, nonlinear regression, analysis of variance (ANOVA) and mean comparison test with the Duncan method and a significance level of 5%, using SPSS® Statistics software (Armonk, New York).
Results and discussion
The potential evapotranspiration (ETo) measured with an atmometer was 1.83 mm, while the ETo for the type A tank was 2.14 mm. Crop's evapotranspiration (ETc) determined with the atmometer ETo from week 35 to 48 was 1.68. The crop evapotranspiration with lysimeter (ETi) for T3 (1.65 mm) was significantly different (P<0.05) to T2 and T1 (1.99 and 2.05 mm, respectively). In the T1 treatment, the ETi and ETo of the atmometer and the type A tank were similar, ranging 2.05, 1.83 and 2.14 mm, respectively; thus, the ETo was adjusted to the water needs of the crop.
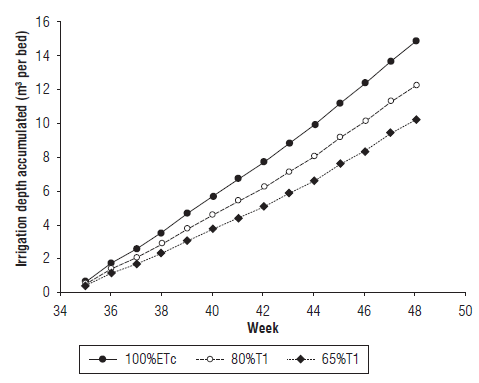
The total volume of water applied to treatments T1, T2 and T3 was 15.04, 12.39 and 10.35 m3 per bed, respectively, in the two cycles, which is equivalent to 3.64, 2.99 and 2.51 mm per day, respectively (Fig. 1). The reductions in the volume of water applied to T2 and T3 compared to T1 were 17.6% and 31.2%, respectively. The volumes were lower than those reported by Patiño (2000) who stated that the irrigation volume must range between 3.70 and 5.29 mm per day.
The mean daily values of the drained depth were 1.64, 1.00 and 0.82 mm in T1, T2 and T3, respectively. The drainage percentage (%D) in T2 and T3 was similar, according to the daily average values, 44.30%, 32.83% and 31.09% for T1, T2 and T3, respectively. The %D was adjusted taking into account the preset interval to use the drainage percentage correction factor (DPF) (30-50%) in nine (9) of the fourteen (14) weeks, with averages of 44.30% and 41.60% for the %D and DPF of T1, respectively (Fig. 2). The %D was lower than those reported by Esmeral et al. (2011) in rose cv. Charlotte, resulting in 52.65, 63.17 and 63.14% for the three substrates, 100% for burnt rice husks (BRH), 65% for BRH + 35% coconut fiber and 35% for BRH + 65% coconut fiber, respectively. However, it was higher than those proposed by Arreaza (2000) and Meneses (2004) in this study the %D ranged from 5% to 20% for carnations planted in the substrate, and reported by Martínez and Roca (2011) 10 to 30%.
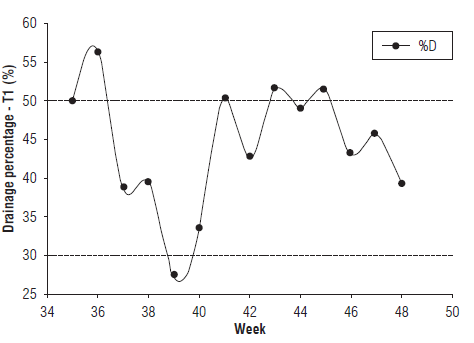
FIGURE 2 Fluctuation in the drainage percentage (%D) in the corresponding range for the DPF (30-50%) in T1.
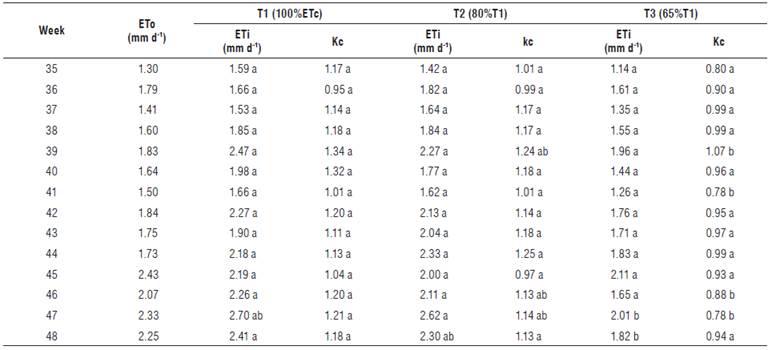
The coefficient of culture medium calculated for T1, T2 and T3 was 1.15, 1.13 and 0.93, respectively, with significant differences (P<0.05) according to the Duncan test for T3 (T2 and T1) and a high Pearson linear correlation (P<0.05) ETi, in T1 and T2, with 0.50 and 0.48, respectively (Tab. 1). The Kc values were not associated with a growth stage and were close to those reported by Esmeral et al. (2011), who obtained values of 0.79 and 1.50, in rose cv. Charlotte planted on the Bogota Plateau. The Kc value of T1 (1.15), was similar to that found by Arevalo et al. (2013), who reported a value of 1.13, for a treatment watered at 100% ETc in rose cv. Freedom in soil.
TABLE 1 Evapotranspiration of the referenced crop (ETo), the lysimeter (ETi)and calculated crop coefficient (Kc). Values with different letters indicate significant differencesaccording to the Duncan test (P<0.05).
The growth showed a continuous behavior (Fig. 3A). In the second measurement cycle starting at week 43, T1 had significant differences (P<0.05) in treatments. For the diameter of the floral stem (Fig. 3B), at the end of the cycle, the values 5.76, 5.94 and 5.49 mm were obtained for T1, T2 and T3, with coefficients of variation (CV) of 14.60, 10.90 and 13.62%, respectively. No significant differences (P<0.05) were established after assessing the diameter of the floral stem. In the second cycle, the length of the bud was measured since week 42, with initial values of 0.89, 0.95 and 0.81 cm for T1, T2 and T3, with a CV of 32.46%, 28.51% and 34.16%, respectively. At the conclusion of the cycle, in week 47 (Fig. 4A), average bud lengths of 4.01, 4.02 and 4.28 cm, with a CV of 14.08%, 12.68% and 12.85% for T1, T2 and T3 were obtained, respectively. No significant differences where found (P<0.05).
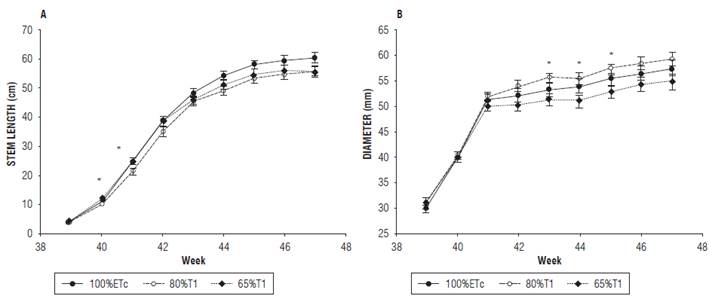
FIGURE 3 Growth curve of floral stem, weeks 39 to 47, A) length and B) diameter. The * indicates a significant difference according to the Duncan test (P<0.05).
At the end of the second period, the bud diameter was 21.34, 21.96 and 23.26 mm with a CV of 19.10%, 14.31% and 13.53% for T1, T2 and T3, respectively. There were no significant differences between the treatments (P<0.05) (Fig. 4B).
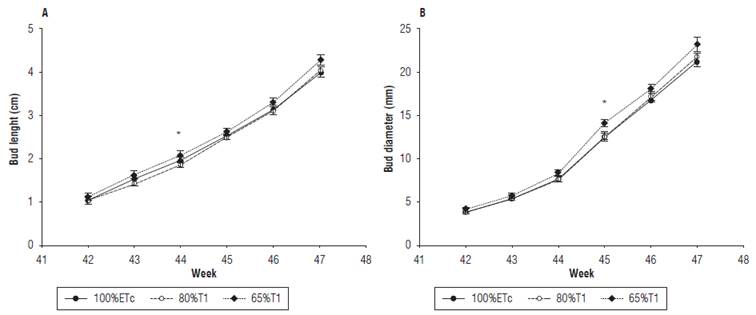
FIGURE 4 Growth curve of floral buds, weeks 39 to 47, A) length and B) diameter. The * indicates a significant difference according to the Duncan test (P<0.05).
The length and diameter of the stem and bud did not show significant differences between treatments for the second cycle of measurements, because the stress was moderate and did not cause reductions in the quality of the flower; however, decreases in the length and diameter of the stem confirm what was found by Bolla et al. (2010), who stated that under unfavorable conditions of water availability and even with small decreases, there was a cessation of vegetative growth. Although the length of the stem found in the treatments ranged within the commercial requirements (50 to 60 cm for the Vendela variety), the shortest length in T1 influences the commercial value depending on the destination market.
The floral bud had typical weekly phenology stages for the flower stem (Tab. 2), coinciding to the appearance of the bud, identified with the peak of stem elongation at week 37, as reported by De Hoog (2001).
TABLE 2 Phenological stages of Rosa sp. Vendela, as a function of the bud diameter; weeks 42 to 47. Values with different letters indicate significant differences according to the Duncan test (P<0.05) (week, days after cutting, phenological stages, bud diameter).
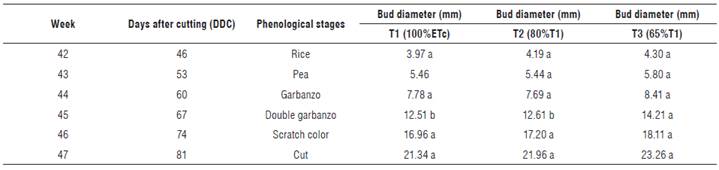
The curves from Table 3 fit the logistic model reported by Flórez et al. (2006). According to this logistic model, the larger stem growth length values during the second cycle were 59.74, 55.17 and 55.81 cm for T1, T2 and T3, respectively, achieving this growth after 41 weeks. The slope of the curve for T1, T2 and T3 was 1.008, 1.021 and 1.017, respectively. The growth time is represented by (t). The AGR of the flower stalk in the three treatments showed a typical trend of a bell curve (Fig. 5A), showing a steady growth, and reaching maximum values at week 42 (13.84, 13.13 and 12.37 cm for T1, T2 and T3, respectively). AGR values were zero in the phase of senescence to harvest. The T2 RGR showed a different behavior between weeks 39 and 40 but a similar trend was recorded after that period until harvest, were values ranged close to zero (Fig. 5B).
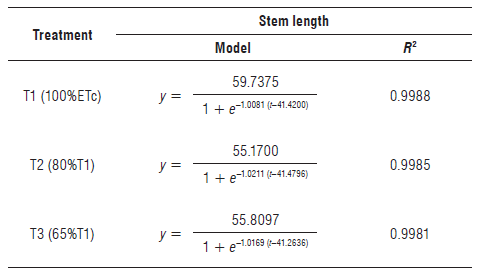
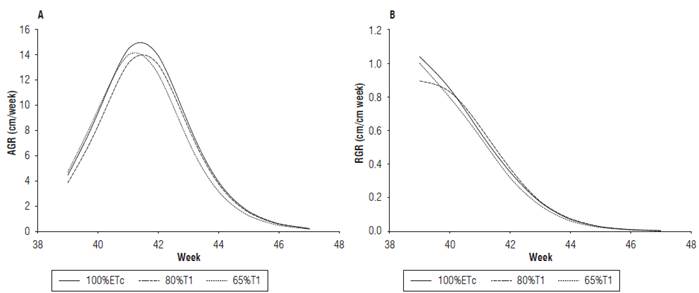
FIGURE 5 Growth curve for the floral stem length, weeks 39 to 47, A) Absolute growth rate (AGR), B) Relative growth rate (RGR).
For the bud diameter in the second cycle, the AGR increased weekly until peaking up at week 46 in the T1 and T2 treatments, with values of 4.71 and 5.04 mm, respectively. The maximum value of T2 was obtained at week 47 (Fig. 6A). The RGR presented a steady decline in all of the treatments until harvest at week 47 (Fig. 6B). There were no significant differences (P<0.05) in the cumulative production of floral stems, with 12,393, 9,779 and 11,197 units for T1, T2 and T3, respectively.
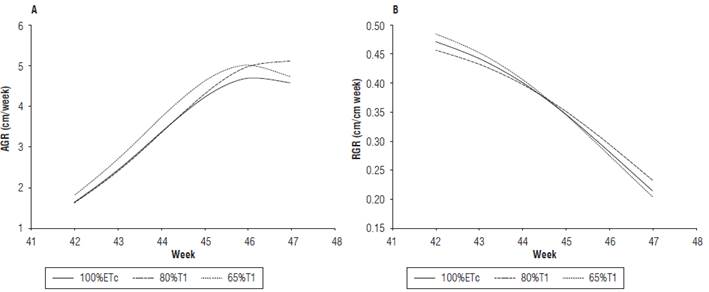
FIGURE 6 Growth curve of the bud diameter, weeks 39 to 47, A) Absolute growth rate (AGR) and B) Relative growth rate (RGR).
An average productivity of 1.31, 1.03 and 1.18 stems per plant per month for T1, T2 and T3 were reached, respectively. These results concur to those reported by Arévalo et al. (2013), who found values of 1.32, 1.28 and 1.24 stems per plant per month for Rosa cv. Freedom in soil. Bolla et al. (2010), found a reduction in the production of marketable rose flower stalks grown in three different substrates, under water deficit conditions, using only 67% of the irrigation needs.
For the WUE, 140.43, 132.00 and 186.61 stems m-3 were obtained for T1, T2 and T3, respectively, finding significant differences (P<0.05) between T3 and T2 and T1. The treatment with the lowest water supply produced the highest stem number during the first and last five weeks. This finding confirms the reports by Bolla et al. (2010), who observed increases in the WUE under a reduced water application. It also coincides to the observations by Raviv and Bloom (2001) in a crop of rose cv. Sonia and Laser, where WUE increased when the water level dropped. This contrasts to what was found in this research for treatment T2, with a lower production of flower stalks with respect to T1.
Conclusions
The crop coefficient values (Kc) obtained from the water balance were close to those reported for other rose varieties grown in a greenhouse on the Bogota Plateau.
The volume of applied irrigation from the potential evapotranspiration (ETo) and drain percentage (%D) did not affect the water status of the plants.
The growth of the floral stem was adjusted to a logistic model, showing the characteristic sigmoidal trend that allows the strategies planning for the crop production. The largest length values were 59.74, 55.17 and 55.81 cm for T1, T2 and T3, respectively, achieving this growth in 41 weeks.
Reductions of 35% in the irrigation depth affected the growth of the stems but not the floral button, leaf area and the accumulated production of flower stems, although a higher quantity of short stems was observed.


