


 Inglês (pdf)
 Artigo em XML
 Referências do artigo
 Enviar este artigo por email
 Citado por SciELO
  Citado por Google
  Similares em
SciELO
Similares em
SciELO  Similares em Google
 Permalink
Introduction
Coriander (Coriandrum sativa L.) is an annual herbaceous plant that reaches between 60 and 90 cm in height during the flowering period; it belongs to the family Apiaceae (Umbelliferae) (Vallejo et al., 2004). Its fruits are used for the elaboration of oils, fragrances and flavorings, while its leaves are used as a condiment (Usman et al., 2003).
In Colombia, eight types of coriander varieties are sown (Estrada et al., 1997), and around 2,431 ha are harvested, with Cundinamarca (36%) and Valle del Cauca (23%) being the larger producing departments (MADR, 2016).
In the departments of Valle del Cauca and Cauca, the UN-APAL Precoso (CP) variety is highly accepted because of its short vegetative period (28-35 d after sowing, DAS) and adaptation to climatic conditions (20-27°C) (Estrada et al., 2004). On the other hand, the variety UNAPAL Laurena (CL) is a new variety that will be released soon, created from the genetic improvement of the CP variety. This variety preserves the favorable characteristics of its parent, with a capacity to generate a greater number of basal leaves and average yields in foliage of 40 t ha-1 (Otero, 2016).
Adequate water availability at each phenological stage is decisive for achieving proper coriander production because it requires shallow sowing (5 mm), has a shallow root system (10-15 cm) and a short vegetative period. These characteristics make it a demanding crop that requires short and frequent irrigation, mainly in the early stages of establishment and development (Vallejo et al., 2004). According to Mejía et al. (2014), in controlled trials in mesh houses, irrigation with less than 200 mm in the vegetative period reduced the number of leaves, the height, and the yield.
However, higher irrigation can generate greater evapotranspiration (ETc) of this crop without significant increases in yield. It is inferred that, in order to maximize the yield of coriander, an adequate estimation (or measurement) of the ETc is necessary in order to accurately determine the water needs of this crop and the irrigation amount to be applied. Among the methods globally accepted to determine ETc, two methods of water balance are noteworthy, as described by Allen et al. (2006): the single coefficient (Eq. 1) and the dual coefficient (Eq. 2); the latter separately analyzing the plant's transpiration component and soil evaporation (Wright, 1982).


where ETc is the evapotranspiration of the crop (mm), ETo is the reference evapotranspiration (mm), Kc is the coefficient of cultivation or single coefficient, Kcb is the coefficient of transpiration and Ke is the coefficient of evaporation.
The implementation of one method or the other differs in terms of the timescale. Approximation with the single coefficient integrates two coefficients; therefore, it is designed for crops whose irrigation demand can be extended weekly or at even higher frequencies (Allen et al., 2006). On the other hand, the dual coefficient is used for estimates of daily ETc, allowing differentiation between the behavior of Kcb and Ke, especially in the days following irrigation or precipitation events (Hunsaker et al., 2005), which makes this method the most suitable for the implementation of high frequency localized irrigation systems.
Kcb is directly related to the morphology and physiology of a plant, especially to the loss of water vapor through the opening and closing of stomata in response to environmental conditions, influenced by energetic, physiological and aerodynamic factors (González Piqueras, 2006). Kcb recommendations for various crops were given by Allen et al. (2006); however, these values are for crops under standard conditions, which on many occasions cannot be replicated because of local conditions.
Kcb determinations for coriander have not yet been defined. However, closer approximations have been obtained by Mejía et al. (2014) with the determination of Kc under controlled conditions in mesh houses. Kc values of 0.83 for germination, 1.12 for linear growth and 1.40 for fresh harvest (from 27 to 35 DAS) have been obtained.
On the other hand, remote sensing is currently seen as a science of great importance because of its application in different fields, especially agriculture. The possibility of obtaining information from vegetation without coming into direct contact with the crop makes its application conspicuous since it is a non-destructive and low-cost method. The effectiveness of remote sensing is related to the physiological capacity of plants, specifically chlorophylls, xanthophyll and carotene, which interact with radiation from the sun and generate reflectivity spectral responses associated with phenotypic states seen in the field. The measurement of vegetation reflectivity can be done by using a radiometer or multispectral images adjusted to the spectral resolution (Chuvieco, 2008).
With the first satellite observations with multispectral images of the Earth's surface, Rouse et al. (1974) showed certain correlations of vegetation biophysical parameters with specific regions of the electromagnetic spectrum, more precisely, the regions included in the spectrum of Red (R) and near infrared (NIR). Since then, the combinations of different bands of the spectrum to identify agronomic variables have been diversified according to the phenomena of interest; these combinations have been called vegetation indices (VI).
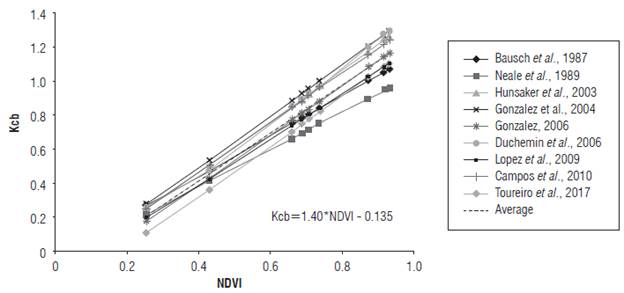
Worldwide, the VI with greater impact and expansion in remote sensing is the Normalized Difference Vegetation index (NDVI) (González, 2006). This index is characterized by results between -1 and 1; when photosynthetically active vegetation densities are high, the NDVI is close to 1. However, for bare soil surfaces, this index is close to zero and takes on negative values for water bodies or cloud cover. One of the advantages and reasons for the great acceptance of NDVI is the simplicity and ease of applying it to intermediate canopy covers (Gilabert et al., 2010). Its high correlations with biophysical variables, such as Kcb (Tab. 1) and the plant cover fraction (fc) (González, 2006; Er-Raki et al., 2007; López et al., 2009; Johnson et al., 2012; Zhang et al., 2015), have allowed for its implementation in studies on water balances in large land surfaces.
TABLE 1 Mathematical relationships between the NDVI and the crop basal coefficient (Kcb) reported in the literature.
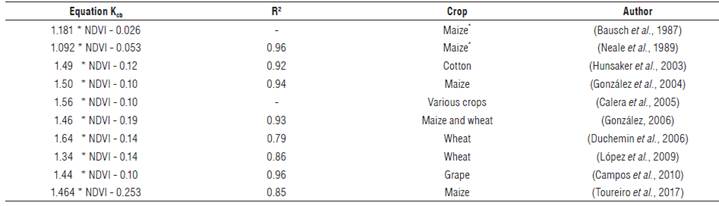
Relationship referred to alfalfa as reference surface.
Although changes in soil surface roughness and humidity affect the spectral response of a soil (Baret et al., 1993), it is important to note that there are no studies that show a clear relationship between Ke and NDVI because Ke depends on the soil moisture content in the first 10 or 15 cm and not just at the surface. Therefore, Ke cannot be deduced from spectral information of the surface and must be calculated with a water balance.
The quantification of Ke is intrinsic to the fraction of coverage (fc). As vegetation develops through phenological stages, it increases in the ability to intercept incident light and reduces the exposed soil fraction. Quantifications of fc have been performed at various scales (local, regional and national), yielding good results in schedules and water management. The research conducted by White et al. (2000) concluded that the use of images captured with cameras is the easiest and most reliable mechanism for measuring fc.
On the other hand, the use of satellite images has seen an exponential increase worldwide since the 1970s, with the development of the first LANDSAT missions. These developments have allowed a wide range of Earth-orbiting satellites to provide information at different spectral and temporal resolutions (González, 2006).
Based on multispectral satellite images, Bausch (1995), Er-Raki et al. (2007), and Toureiro et al. (2017) were able to quantify water requirements and apply irrigation more accurately in maize and wheat crops. However, the biggest constraint for the use of this technology in Colombia is associated with cloudiness, geographical location and topographical conditions of the country (Martínez, 2017). For this reason, research at lower scales with unmanned aerial vehicles or local measurements is considered viable alternatives (García et al., 2015).
The aim of this study was to quantify the water demand of two varieties of coriander (CL and CP), determined with a water balance, integrating biophysical variables (fc and Kcb), and estimated from remote sensors.
Materials and methods
This study was carried out between the months of April and August, 2017 at the CEUNP experiment center of the Universidad Nacional de Colombia, Palmira (3°25'33"N, 76°25'52"W, 930 m a.s.l.). The nearest meteorological station to CEUNP (14 km) is the Alfonso Bonilla Airport (IDEAM station: 26075040), which has a record period of 1972 to 2016. The data show an average annual precipitation of 893.5 mm, distributed over 144 d, reaching a maximum of 89.6 mm in 24 h. The average temperature is 24°C, and the relative humidity is 73.2%, registering 1810 h of total annual solar brightness and an average wind speed of 1.2 m s-1.
The mechanized land preparation was carried out on the upper 40 cm of the surface, making two passes per implement (disc harrow and rotavator). A soil sample was taken to determine the texture (clay loam) and moisture retention curve (field capacity (FC) = 37.86% and wilting point (WP) = 20.84%).
The sowing was carried out on April 22 (day 0 after sowing, DAS) by distributing the seeds manually at a 25 cm distance between furrows. Weeds were manually controlled during the first six weeks. The nutritional management of the crop was carried out following the recommendations of the experiment center, which consisted of foliar applications of potassium nitrate, Cosmocel® and Triple 18, at different concentrations throughout the stages of growth, development and fruit filling. In addition, at the mid-development (27 DAS), granulated urea was broadcast. For the second week of flowering, on June 28 (61 DAS), "boxing" tutoring was installed on double furrows.
A complete block design was implemented with two treatments (CP and CL varieties) and three replicates, working an area of 34 m2 distributed in six experiment units (EU) of 5 m2 (2.5 m x 2 m), as shown in Figure 1. Because of the lack of germination uniformity in the third replicate of CP, this EU was ruled out in the follow-up and analysis.
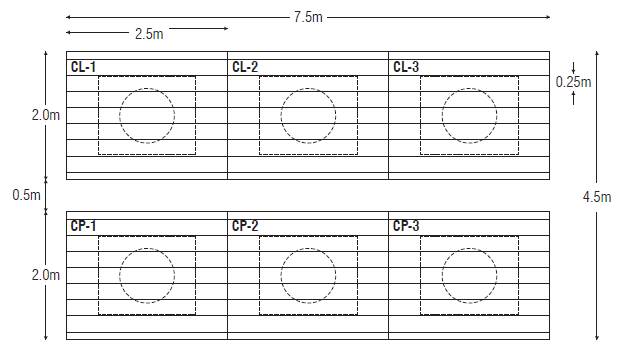
FIGURE 1 Distribution of experiment units (EU) in the field of the two studied varieties. The horizontal lines indicate the rows of the crop. The boxes and circles (dashed line) indicate the area covered by photography and radiometry, respectively.
Calculation of the water demand was based on Equation 2, following the methodology described by Allen et al. (2006) in FAO 56, using climatic variables of temperature, relative humidity, solar radiation, wind velocity, precipitation, crop height, fc and Kcb, adapted to local conditions. Drip irrigation system was installed to meet the water requirements of the crop, which was programmed to function according to the level of depletion accumulated in the soil, with the exception of the first week between sowing and germination when the surface was watered following the recommendations of Estrada et al. (2004). In general, the irrigation applications ensured that the crop was kept free of water stress.
Climatic information was obtained with the use of a Campbell scientific automatic meteorological station installed on a reference surface of grass or festuca, which recorded data of relative humidity, wind velocity, solar radiation, precipitation and temperature every 10 min. For the days without information from July 2 to 6 (41 and 45 DAS), the information from a near station, belonging to the CENI-CAÑA automated meteorological network, was used.
Based on the only method recommended to determine ETo, the FAO Penman-Monteith equation adapted to a festuca reference surface (and daily scale) was used (Allen et al., 2006):
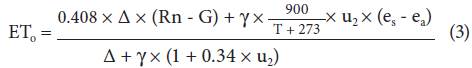
where ETo is the reference evapotranspiration (mm d-1), Rn is the net radiation on the crop surface (MJ M-2 d-1), G is the soil heat flux (MJ M-2 d-1), T is the average air temperature at 2 m height (°C), u2 is the wind speed at 2 m height (m s-1), es is saturation vapor pressure (kPa), ea is the actual vapor pressure (kPa), es-ea is the vapor pressure deficit (kPa), Δ is the slope of the vapor pressure curve (kPa °C-1), the psychrometric constant (kPa °C-1).
The height of the plant was measured weekly; additionally, radiometry and photography were taken to determine the NDVI and fc, respectively. With these parameters, the evolution of the crop was traced, and linear tendencies were plotted with the objective of determining the water demand and scheduling irrigation on the following week (Bausch, 1995; Gonzalez et al., 2004).
The estimation of the fc was carried out with a Pentax digital camera, model Optio E85, 12 mega pixels, with spectral resolution in the optical range and a field of vision of 53°8' (determined in a laboratory). Three photographs were taken per EU, fixing the camera to a rigid T-shaped structure adjusted to a 1.50 m height. Subsequently, the images were subjected to classifications supervised by algorithms of maximum similarity with the ArcGIS 10.3 software. Six trainings were developed according to the evolution of the crop: (1) germination, (2) mid-exponential growth, (3) maximum coverage, (4) flowering, (5) fruiting and (6) senescence.
For the NDVI (Eq. 4), an Apogee PS100 spectroradiometer with a spectral range between 350-1100 nm was used, with an instantaneous field of view of 23°. For the photographs, three measurements were taken per EU at a 2.1 m height above the ground surface. Two spectral ranges, red (R) and infrared (NIR), based on Landsat 8 bands, were used.

where NDVI is the vegetation index with the standard difference (dimensionless), R is the average reflectivity between 636-673 nm and NIR is the average reflectivity between 851-879 nm.
With the NDVI value, and taking into account the NDVI-Kcb relationship for various crops (Tab. 1), all the equations were averaged and the Kcb of each measurement was determined. Taking into account the response of the NDVI and the fc, the lengths corresponding to each stage were defined.
The harvest was carried out at 104 DAS, which is equivalent to 98 d after germination (DAG), when the achenes changed from brown to dark brown. The yield was assessed by taking samples of 1 m2 per EU, collecting the aerial parts of the crop between 8 and 9 a.m. (local time), carefully using pruning shears to avoid making dry achenes fall. At the end of the study, seed samples were randomly taken to determine the moisture content of the seeds at harvest and after drying in the open air.
The samples were left to dry in a covered cellar for 3 d. Afterwards, the seeds were collected manually and, using a sieve, the seeds were separated from the crop residues. For each sample, 5 g of seeds were taken and dried in an oven for 1 h at 130±2°C to determine the moisture content (ISTA, 2016).
After the harvest, the soil was taken to saturation to assess the depth and extent of the roots. Five roots per EU were manually extracted, and the depth and maximum width were measured.
Results and discussion
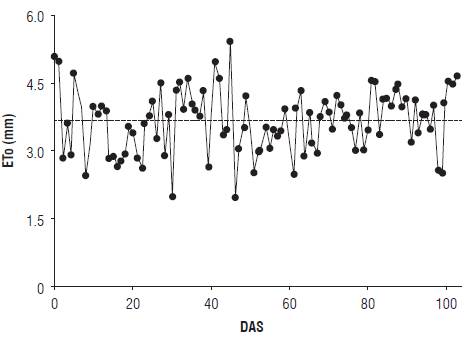
From the climatic variables measured in the field with the Campbell station, the daily ETo was calculated along the crop using Equation 3. On average, the ETo was 3.7 mm d-1. However, as expected, the evapotranspiration of the reference surface had abrupt changes from one day to another because of the variation of weather conditions in the area (Fig. 2).
The average plant density in the final stage was 164 and 108 m-2 for the CL and CP varieties, respectively. Differences in plant density are considered a statistically non-significant factor in the response of CP seed yield (Puga et al., 2008) and were not evident in the results presented here. However, future studies should focus on evaluating foliage production for green harvest and the influence of stocking density, especially for the CL variety.
Figure 3 shows the evolution of fc and NDVI for each variety as well as the development stages established under the following criteria: The initial stage (Lini), starts from sowing and ends when fc is around 0.10, when the crop is in the middle of exponential growth, and its presence begins to exert changes in the response of NDVI. The middle stage (Lmdc) is maintained while the fc is above 0.90; after this point, the NDVI reduces sensitivity to the point of saturation (Odi et al., 2013). As for the final stage (Lend), it starts with values of fc lower than 0.90; the NDVI generates a response to photosynthetically inactive tissues, maintaining distant values for fc.
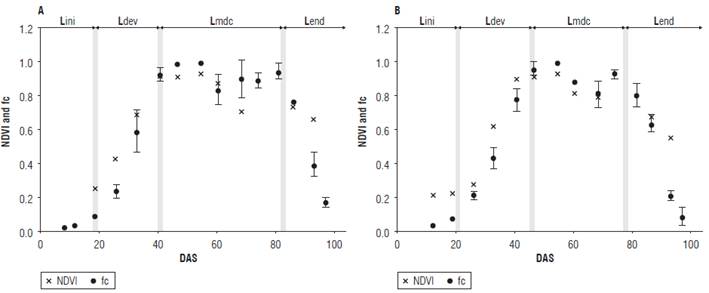
FIGURE 3 Evolution of the fc and NDVI with demarcation of the stages of development, during the life cycle: A) Laurena and B) Precoso varieties.
The measurements of fc and NDVI responded adequately to changes throughout the cycle, especially at 59 DAS, where winds stronger than 2 m s-1 managed to overturn much of the CP variety and the installation of tutoring considerably reduced fc in the mid-stage (Fig. 3). However, the NDVI comparisons in CL, before and after tutoring, gave the same response, so the presence of white flowers (about 6%) on the surface of the crop achieved the same effect.
The fc presented values of 0.02 during the emission of the first true leaves and gradually increased up to 0.99, where it reached the maximum vegetative development shortly before flowering (Fig. 3). The largest standard deviations of fc were seen in the middle of the development stage and mid-stage, which coincided with the expansion of the crop in search of new spaces of light, until reaching the maximum development where standard deviations were lower. In the mid-stage, there was an increase in the standard deviation because of the tutoring that left fractions of bare soil exposed, increasing the heterogeneity of the crop cover.
The response of the NDVI varied between 0.14 and 0.30 (bare soil) at the initial stage, with 0.14 seen when a low moisture content was present in the soil and 0.3 in the presence of moist soil. In the mid-stage, the response of the NDVI varied between 0.92 and 0.93 when the foliage reached its maximum expression, as shown in Figure 3.
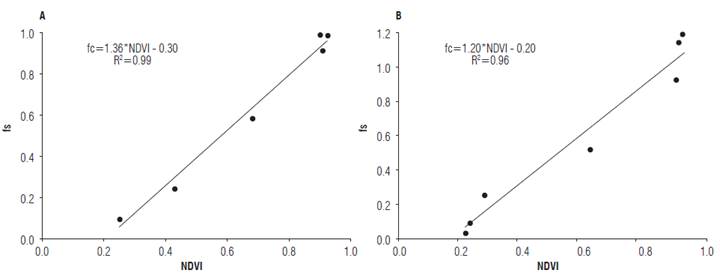
On the other hand, the correlations between NDVI and fc, before the tutoring, were 0.99 for CL and 0.96 for CP (Fig. 2), according to what was reported by Calera et al. (2005), González (2006), Er-Raki et al. (2007), López et al. (2009) and Johnson et al. (2012).
The duration of the stages of development, without taking the days until germination into account, is presented in Tab. 2. The CP variety showed a 5-day shorter period in the vegetative stages (start, development and mid). This can be an advantage for farmers because it reduces the time until foliage harvest. The final stage may change because the decision to harvest seeds is based on the farmer's experience and the climatic conditions, resulting in a variable final stage.
TABLE 2 Length of crop development stages according to the FAO 56 methodology.
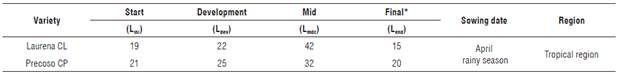
Values are expressed in days. Lengths corresponds as follow: Lini = From germination until 0.10 fc Ldev = fc>0.10 to fc 0.90, Lmdc = fc>0.90 up to beginning of senescence and Lend = fc<0.90 up to crop. * Variable stage.
The values obtained for Kcb are shown in Figure 5, with the different NDVI-Kcb approximations reported in the literature and presented in the Table 1, using the values of NDVI obtained in the present study. In this figure, it is observed that the standard deviation of the estimated Kcb was small despite the physiological and morphological differences of the various crops of agricultural importance, with values of 0.05 for NDVI near bare soil and 0.11 close to total plant cover.
Based on the Kcb average equation, water vapor liberation was maintained through the estomatic aperture in relation to the increase of the exposed plant superficial area and the aerodynamic resistance. For this reason, higher transpiration levels appeared in the mid-stage (Tab. 3).
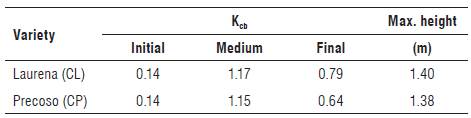
According to the height measurements, the maximum height for coriander was recorded in the flowering season, with 1.40 m for CL and 1.38 m for CP. Compared to the height achieved with the height reported in the literature, the CP variety significantly exceeded the 0.90 m that was reported by Vallejo et al. (2004).
On the other hand, and as seen in Equations 1 and 2, the behavior of the Kc was the result of the summation of Ke and Kcb, where the greatest contributions of Ke were seen in the initial stage or phase of establishment of the crop, and the lowest contributions were seen when the Kcb was at the maximum (Fig. 6). However, the strong changes in the behavior of Ke were associated with the capacity of the soil to retain water in the first centimeters and transfer it easily to the atmosphere when it was not covered. For this reason, after a precipitation event, when the total exposed surface was moistened, the Kc presented the maximum values, whereas localized irrigation applications decreased the contribution of evaporation to the Kc by up to 66%. At the end of the cycle, when the availability of water in the soil was considerably reduced, the contribution of Ke was eliminated, and the contribution of Kcb decreased with the crop senescence.
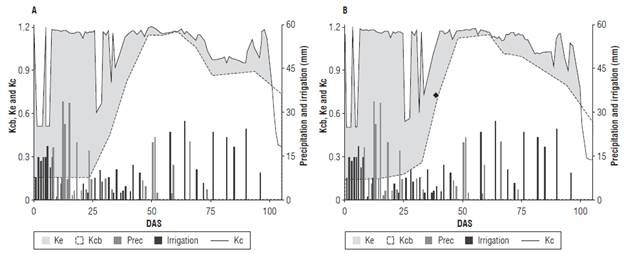
FIGURE 6 Kcb, Ke and Kc behavior over time with precipitation and irrigation, A) Laurena and B) Precoso varieties. For the latter variety, the rhombus indicates the appropriate time for foliage harvesting.
According to the water balance, until the middle of the development stage when the fresh foliage was harvested (up to 41 DAS), the crop demand (ETc) was 156 mm for CL and 151 for CP, indicating that with this methodology, the water requirements were under those reported by Estrada et al. (2004) and Mejia et al. (2014). Additionally, for both varieties (CP and CL), the water input by precipitation and irrigation was between 208 mm to 187 mm, respectively, whereas losses through drainage (percolation) were 242 mm for CL and 245 mm for CP.
High losses resulting from drainage are a reflection of three factors: the first, the uneven distribution of precipitation throughout the vegetative cycle; the second, the concentration of precipitation in the first days of planting, and third, the application of frequent supplementary irrigation in order to ensure the development of the seed. This is done because, during the initial stage, the pivoting root has not yet been emitted or absorbent hairs have little scope making it impossible to absorb water stored between the porous spaces of the ground surface.
The irrigation schedules, made with estimates of effective depth of 30 cm, yielded positive results, allowing the level of soil depletion to exceed the capacity of readily available water (RAW) by the plant at the end of senescence, which could occur under stress conditions and favor the drying of the fruit (Fig. 7). However, the root analysis at the end of harvest showed that the roots did not exceed a 20 cm depth or a 25 cm width. This suggests that the root-extraction process may underestimate the horizontal and vertical reach of secondary roots.
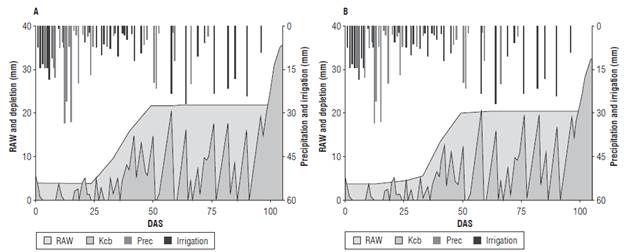
FIGURE 7 Readily available water (RAW) behavior for the crop and water depletion in the soil, in terms of rainfall and irrigation inflows. A) Laurena and B) Precoso varieties.
Under the conditions of this research, the average seed yield was 181 g m-2 (±49) for CP and 175 g m-2 (±31) for CL, with a seed moisture content of 11% and 12%, respectively. This performance is suitable for both varieties as compared to the yields obtained by Usman et al. (2003) and Banda et al. (2011) with different methodologies.
Future studies should address the behavior of coriander until foliage harvest as well as the influence of sowing density and a follow-up on evaporation with lysimeters on water requirements, given that, in this study, the behavior of the whole vegetative cycle was assessed.
Conclusions
In the present study, it was observed that water demand management of this crop, based on remote sensors, is viable because of the sensitivity of the images and the radiometry used to determine biophysical variables (fc and Kcb) of the coriander, responding adequately to the natural and human variations that occurred throughout the vegetative cycle.
Ortiz and Torres: Assessing water demand with remote sensing for two coriander varieties The transpiration behavior (Kcb) in the variety UNAPAL Laurena (CL) and the UNAPAL Precoso (CP) varieties were very similar, differing slightly in the mid-stage (CL = 1.17 and CP = 1.15), with a more accentuated difference in the final stage of senescence (CL = 0.79 and CP = 0.64).
On the other hand, the most contrasting difference between the two varieties was the length of the stages, where CL reached maximum development 5 days before the CP variety. However, CL took 10 d to complete the mid-stage before initiating the stage of senescence, a factor to be taken into account for the drying of seeds in the field.
The calculated ETc from sowing to harvesting foliage (41 DAS), under field conditions, was 156 mm and 151 mm for CL and CP, respectively. Both varieties demand short and frequent irrigation during the initial stage and at the beginning of the development stage.


