Introduction
One of the main economic activities on the Bogota plateau is specialized dairy production because this region has suitable environmental conditions for its development. These production systems are thriving on the Bogota plateau because of its particular climatic (i.e. average temperature of 13°C, altitude between 2,500 and 3,000 m a.s.l., 70% relative humidity and a bimodal precipitation regime) and edaphic conditions. Another factor that has contributed to the development of this industry is the availability of kikuyu grass (Cenchrus clandestinus Hochst. ex Chiov, Morrones synonym of Pennisetum clandestinum Hochst. ex Chiov) and ryegrass (Lolium spp.), forage used for grazing specialized dairy cow breeds (Benavides, 1997; Duarte et al., 1998; Martínez and Barreto, 1998).
In these specialized dairy production systems, a reduction in milk production is a consequence of the presence of pests such as the grass bug Collaria scenica (Stal, 1859), an insect that sucks sap from the leaves of grasses, causing different degrees of damage and generating tissue death that further causes a reduction in biomass availability and affects forage quality. This leads to an income reduction of close to 25% for producers (Duarte et al., 1998; Martínez and Barreto, 1998).
This pest has been recorded on the Bogota plateau since 1988 and has expanded to other milk-producing regions, such as the Ubate and Chiquinquira valleys and Alto Chicamocha (Duarte et al., 1998; Ramírez and Díaz, 2002; Ferreira et al., 2013).
Insect development and behavior are affected by interactions with the environment, including climatic variables such as temperature, precipitation, relative humidity and wind, among others. According to Boshell (2010), the distribution of insects and the duration of their life cycle are affected by climatic conditions, especially temperature. Therefore, knowledge on the natural climatic variation of an area and its impact on insects or pests is important since this constitutes a significant issue for the prevention of sanitary problems.
Climate variability and climate change have potential impacts on agriculture and particularly on pest behavior and development. Climate variability refers to variations in the mean state and other climate statistics (standard deviations or occurrence of extremes, etc.) on all temporal and spatial scales beyond those of individual weather events. Climate change refers to any change in climate over time, whether as a result of natural variability or anthropogenic forces (IPCC, 2014).
The Bogota plateau is continually affected by climatic anomalies. The agroclimatic quarters or seasons with lower rainfall correspond to the months of December-February (DJF) and June-August (JJA), and the periods with higher rainfall are March-May (MAM) and September-November (SON), all of which are altered by large-scale climatic phenomena such as El Niño-Southern Oscillation (ENSO) events, which generate drier or rainier periods (Pabón and Torres, 2006). These events cause disasters in a large part of the region, and the presence of El Niño has serious consequences as a result of precipitation deficits and increases in temperature and frost threat. The more obvious agricultural and socioeconomic impacts include decreases in the production of basic crops, increased incidence of pests and diseases, reduction of river and stream levels, economic losses, and high product prices, among others.
Studies on climate variability and global climate change have shown that future variations in climate will generate a noticeable effect on the migration and abundance of pest insect populations, which will adversely affect global agricultural and livestock productivity (Palikhe, 2007; Merril et al., 2008). An accelerated change in the spatial distribution range of insect species will be one of the important effects of climate variability and change (Boshell, 2010). As the planet heats up, insect species limited by temperature will be able to expand to other areas as fast as their own dispersion mechanisms allow them. For example, in the case of the Miridae family (i.e. the family grass bugs belong to), an increase in temperature would work in their favor more than other grass pests (Kiritani, 2006).
For example, variations resulting from climate change affect the potato moth Phthorimaea operculella (Zeller). According to Kroschel et al. (2013), the potential for damage will gradually grow in all regions where this pest currently exists, with a significant increase in the tropics and subtropics in warmer regions where potatoes are grown under emissions scenarios SRES (Special Report on Emissions Scenarios) -A1B (2050), which model future climatic conditions with a balanced emphasis on all energy sources. Also, an increase in temperature in more temperate climate regions, such as mountainous areas and inter-Andean valleys, will generate a moderate increase in damage potential in new areas with an infestation risk.
According to Pulido (2016), for populations of the common cattle tick Rhipicephalus (Boophilus) microplus in the Cundiboyacense highland area, it might be possible that climate change will not have a positive influence on this species since there is a decrease in all the stages of development when including data for climatic projections for the period 2011-2040 according to the climate change scenarios of the Third National Communication (IDEAM et al., 2015).
In a study by Ramirez et al. (2015), nonparametric trend analysis (Mann-Kendall) and correlation analysis were used to determine the effects of climate variability associated with the occurrence of El Niño and La Niña on the thermal time of the coffee berry borer. This effect is differential: above 1,400 m a.s.l., El Niño increases and La Niña decreases the suitable conditions for this insect's growth and development, while below 1,400 m a.s.l., El Niño reduces and La Niña increases these conditions.
Additionally, Giraldo et al. (2011) reported that high temperatures during the El Niño phenomenon favor the reproduction of the coffee red spider mite O. yothersi.
A study carried out in the central coffee growing zone of Colombia linked three climatic periods (neutral period 2007, La Niña period 2008, and El Niño period 2009 - 2010) with the dynamics of coffee berry borer infestation. The results showed that, during the El Niño phenomenon, there were increases in the average air temperature and in the levels of infestation in comparison with the neutral and La Niña periods. In conclusion, temperature was the variable that had the greatest influence on the development of the coffee berry borer, accelerating its life cycle and, therefore, producing more progenies in less time (Constantino et al., 2011).
According to Ramírez and Díaz (2002), in the case of grass bugs, population density has a direct relationship with altitude and temperature; the highest densities are found between 2,000 and 2,400 m a.s.l., whereas populations have very low densities above 2,700 m a.s.l. Barreto et al. (2011) found significant spatial and altitudinal pest increases in farms located between 1,600 and 3,000 m a.s.l. on the Bogota plateau, in the Ubate and Chiquinquira valleys, and in the Alto Chicamocha region.
According to the modeling of the current potential distribution of C. scenica and under the climate change scenario A1 (characterized by a low population trajectory and rapid economic growth) for the period of 2020 in the livestock areas of the Cundiboyacense highland region (Pulido et al., 2011), there is an expansion of potential areas, both latitudinally and towards higher altitude areas; this expansion is mainly connected with grazing areas and associations of crops and forests, with more extensive areas for these two land uses. The potential areas with the highest probability of insect presence were found at elevations higher than 2,800 and even up to 3,000 m a.s.l. The model was validated in 2011 in the field on farms located between 2,800 and 3,400 m a.s.l., corroborating the presence of the pest.
Taking into account the importance of C. scenica in milk production on the Bogota plateau and given the fact that variability and climate change may favor the expansion and growth of its populations, it is important to value the relationship between climate and the abundance and distribution of this species. This study considers the application of mathematical and statistical models for the description of pest and disease behavior in agriculture as an important step towards a better understanding of the epidemiology of pests, and as an opportunity to support producers in the optimization of crop protection management (Orlandini et al., 2017). Therefore, the aim of this research was to study the effect of climatic conditions on this grass bug's population using agroclimatological models and to analyze its behavior under scenarios of interannual variability related to ENSO events.
Materials and methods
Sampling
To register the presence of this insect, weekly sampling was conducted from May, 2009 to November, 2010 at a dairy farm located in Funza (part of the Bogota metropolitan area), in the Western Savanna Province, of the Department of Cundinamarca, (4°39'24.77" N and 74°11'41.60" W, at an altitude of 2,561 m a.s.l), where three enclosed pastures were selected with different resting periods (d) after grazing, as follows: one recently grazed, another halfway through the resting cycle, and the third one with grazing. In each plot, a quadrant of a quarter of a hectare was selected, where a sampling grid with 10 points was established. A sample was taken at each point, which consisted of ten double passes with an entomological net in a 10 m linear transect, for a total of 10 samples per pasture, according to the methodologies described by Barreto et al. (1996) and Garza and Barreto (2011). The dimensions of the entomological net were 40 cm in diameter and 90 cm in length, attached to a 120 cm handle. In addition, information on the pasture management practices that affected the pest population was also registered.
To establish the relationship between the grass bug and agroclimatic variables, the total number of fourth and fifth nymphal stage individuals captured and the total number of adults were analyzed. For the climatic information, daily precipitation, maximum and minimum temperatures, relative humidity, wind speed and solar brightness, data from the 2009-2010 period were used, retrieved from a meteorological station located at 4°41' N and 74°12' W, 2,543 m a.s.l. The daily climatic information was accumulated weekly to build the agroclimatic indices and was crossed with the number of weekly nymph and adult captures.
Multiple regression model
Regression models are used to describe the population's behavior over time, which identified the key factors for the populations and generated approximations for estimating growth (Boyce, 2002). To evaluate the behavior of this grass bug in relation to agroclimatic conditions, a multiple regression analysis was carried out. Variables that did not show a normal distribution were transformed using the box-cox method (Mendoza et al., 2002). The goodness of fit of the theoretical model was evaluated using the coefficient of determination, and the explanatory capacity was obtained from the least squares method (ANOVA), the result was evaluated using Fisher's F-value. The statistical significance of the model's variables on the dependent variable was carried out using a Student's T -test.
In the regression analysis, the calculation of the following agroclimatic indices was integrated in the following equation:
Degree day (GD or GDD) represents the accumulation of heat units or number of degree days above a certain lower limit temperature (Wang, 1960; Cross and Zuber, 1972; Russelle et al., 1984), which for the case of insects corresponds to the minimum development threshold (base temperature). For each day, the GD was calculated as:
where:
GD = Degree days
T max = Maximum daily temperature
T min = Minimum daily temperature
T b = Minimum threshold temperature at base temperature
In the developmental stage prediction from degree days, it was necessary to establish the T b and the number of degree days that must be accumulated in each biological stage (egg, nymphs and adult, in the case of this grass bug) to continue with the next growth phase or termination of the cycle as an adult. According to Martínez and Barreto (1998), the average life cycle of grass bugs varies according to temperature conditions. In a laboratory with a constant temperature of 18°C, the time from egg to adults is 44 d, while in the field with an average temperature of 13°C, it is 65.5 d. Another study under insectary conditions with temperature fluctuation and two host plants (common oat Avena sativa and kikuyo Pennisetum clandestinum), showed that the egg stage has an incubation period of 30 d and the five nymphal instars had the following periods: I: 8-13.5 d; II: 4.5-9.5 d, III: 4-6.4 d, IV: 6-6.4 d, and V: 6.710.1 d; for an average duration from egg to adult of 65 d in oat and 70.7 d in Kikuyo (Barreto, 2012).
In this study, pest information was obtained on the Bogota plateau where there are optimal development conditions, and the average temperature is approximately 14 ± 1°C. In addition, since laboratory experiments have shown that this insect does not survive at constant temperatures below 12°C, a T b of 13°C was considered (Barreto et al., 2012).
Degree days were calculated for the same period of time in which the population data were collected (May 2009 to November 2010) with daily T max and T min values.
Water index
Water balances evaluate water availability in a specific place and period, which serves as a basis to define different agricultural activities, such as crop establishment, monitoring and growth, definition of management activities, appearance of pests and diseases, and irrigation programming, among others. Water balance is determined by water inlets and outlets in a system. Contributions mainly come from precipitation, and losses are caused by evaporation and transpiration (evapotranspiration). Therefore, to establish water availability, these two variables can be compared by calculating either their difference (precipitation minus evapotranspiration) or their relationship (precipitation over evapotranspiration), which results in a series of values representing potential losses or gains from moisture stored in the soil (Jaramillo, 1982).
A water index was estimated when the relationship between the insect pest and the agroclimatic variables was established. This, in turn, estimated the water availability by comparing the precipitation and evapotranspiration using the following equation:
where:
IH = Water index
PPT = Precipitation
ETo = Reference evapotranspiration, calculated through the Fao-Penman-Monteith method.
Note that, when PPT is higher than ETo (positive balance), the ratio is higher than one.
Model validation
The behavior of the population estimated with the regression model was validated by comparing it with the observed data with a correlation coefficient and the respective significance in the two cases: 1) observations of where the model comes from: comparison with observations obtained from the farm located in the municipality of Funza from May, 2009 to November, 2010 (data used to build the model) and 2) observations of where the model comes from in a later period: the main objective of the model is the prediction of the pest, so its response was evaluated with real values in a period after the one considered for its construction. Therefore, estimates for nymphs and adults were compared with data obtained from December, 2010 to March, 2011.
Interannual climatic variability analysis
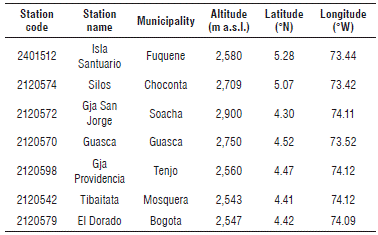
In order to estimate the behavior of the grass bug population under climatic variability scenarios, information from the period 1980-2010 was used from seven meteorological stations distributed on the Bogota plateau (Tab. 1).
The behavior of pest populations in relation to the conditions generated by the oceanic-atmospheric phenomenon ENSO on the Bogota plateau was estimated considering the agroclimatic seasons. The impact of the ENSO cycle on the study area was identified based on the spectral analysis of the series of anomalies shown by climatic variables that favor the appearance of the pest, recognizing the periodicity of the cycle in the series.
Then, variability scenarios were established with a correlation analysis between the anomalies of the climatic variables and the anomaly of the sea surface temperature (SST) of the tropical Pacific Ocean. These scenarios were constructed by grouping the quarters by El Niño and La Niña events and neutral years during the period 1980 to 2009 based on the oceanic Niño index (ONI) taken from the database of the Climate Prediction Center (CPC) of the National Centers for Environmental Prediction (NCEP) and the National Oceanic and Atmospheric Administration (NOAA). Once these periods were established, the average and standard deviations were obtained for each variable; then, the insect population in the region was estimated under each climatic variability scenario.
Results and discussion
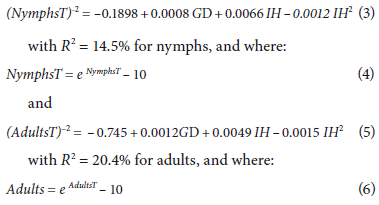
The multiple regression model adjusted with grass bug nymph and adult population values resulted in the combination of the variables GD and IH, which were significant and could be related in the following equations:
The obtained model is useful for predicting and indicating the distribution tendency of the grass bug population, and the above equations correspond to the best estimates of nymph and adult population fluctuations in relation to the analyzed agroclimatic conditions. This showed that the fluctuation behavior of nymphs (14.5%) and adults (20.4%) is explained by GD and IH. GD explains pest growth according to the accumulation of temperature, and IH explains the effect of water availability on the soil surface. These conditions may or may not favor both species development and grass growth since grass is the food of the pest and will attract either a higher or lower number of insects.
The coefficients of determination are considered statistically acceptable with high significance for a P-value of less than 0.05 in each of the factors of the equation. The P-value in the ANOVA table (Tab. 2) is less than 0.05, which indicates a significant relationship with a 95% confidence level. The remaining unexplained percentages are attributed to other non-agroclimatic factors, such as the quantity and temporary quality of the pasture as a food source, natural enemies, control of other insects, and the presence of other hosts, among others. Moreover, the way in which the insect data were obtained (i.e. field values) had some inherent problems that resulted in a decrease in the R 2 values.
The result of this model, in which GD has a positive contribution for the grass bug population, agrees with different organism growth models, where the index expressed in degree days establishes the average time in which a species has optimal development conditions, as explained by Ramírez et al. (2015). The model responds to the growth relationship between different pests and climatic variables, as in the cases of the mustard aphid Lipaphis erysimi (Kalt) (Narjary et al., 2013) or the mango leafhopper Idioscopus spp (Gundappa et al., 2018), in which a model to predict their population can be obtained from a regression analysis.
First validation
When comparing the nymph and adult fluctuation from the data taken in the field (in the absence of grazing and chemical control) and the values given by the regression model, the performance of the model in reproducing pest increases and decreases is evidenced for each date (Fig. 1 and Fig. 2). These values coincided for some peaks, but the simulation underestimated most of the relevant growth, especially in the case of the nymphs. Therefore, it can be inferred that the model is useful for determining the seasons in which the presence of the pest could increase or decrease under the predicted climatic conditions. The model shows a gradual increase with some fluctuations in this process, without detecting large insect outbreaks from one week to the next.
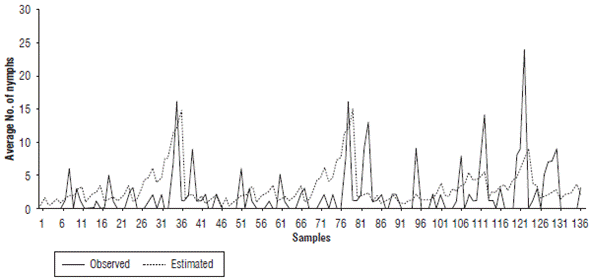
FIGURE 1 Comparison of population fluctuation observations and estimates of Collaria scenica nymphs from May, 2009 to November, 2010.
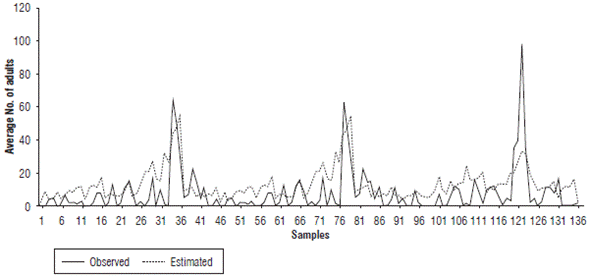
FIGURE 2 Comparison of population fluctuation observations and estimates of Collaria scenica adults from May, 2009 to November, 2010.
For the degree of similarity between the population estimates (Nymphs_Est and Adults_Est) and the field data (Nymphs_Obs and Adults_Obs) evaluated using the correlation value, Table 3 shows that the simulation of adults had a greater degree of adjustment (0.570) compared to the representations of nymphs (0.37). Although the correlations were not close to one, they were significant at 99%, which indicated a good approach and could have been related to the representation of the population fluctuation trends over time.
Second validation
When evaluating the nymph and adult fluctuation from the regression model estimates for the period December, 2010 to March, 2011 in comparison with the observations (Fig. 3 and Fig. 4), the simulation indicated increase and decrease periods correctly even though there was a difference in the number of insects. This allowed for the identification of the conditions and the moments in which the organisms began to grow; this information is useful for making decisions. For this case, a positive correlation coefficient of 0.68 was obtained for nymphs and 0.75 was obtained for adults (Tab. 4). Both coefficients were significant with a 99% confidence, with the correlation true at the 0.01 level.
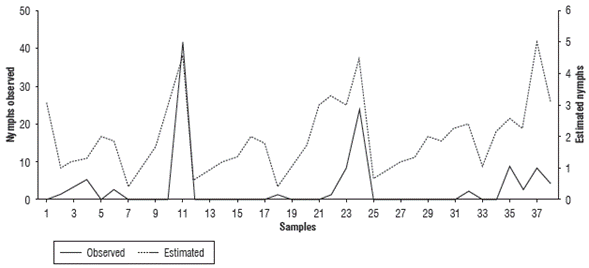
FIGURE 3 Comparison of population fluctuation observations and estimates of Collaria scenica nymphs from December, 2010 to March, 2011.
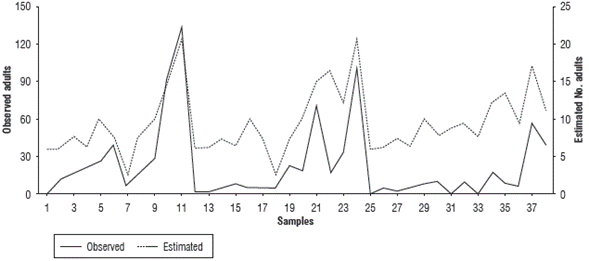
FIGURE 4 Comparison of population fluctuation observations and estimates of Collaria scenica adults from December, 2010 to March, 2011.
Relationship between the insect population and the agroclimatic variables defined in the model
Figures 5-10 show the daily estimation of nymphs and adults for the twelve months of the year separated into agroclimatic quarters. The highest number of insects was observed in the first rainy season of the year (MAM), which is related to high temperatures and a larger daily thermal amplitude (understood as the difference between T max and T min ) during the DJF quarter (Fig. 7), when there is accumulation of degree days that favors pest growth. Pests will then benefit from the abundance of food (forage) that occurs in the following quarter (MAM) as a result of higher rainfall, which coincides with the population fluctuation of the rice bug Oebalus insularis (Stal), which has higher numbers during the rainy season (Vivas et al., 2010). These results agree with what has been indicated by cattle ranchers of the region, which relate the end of the dry season and the beginning of the rains with an increase in insect populations. Producers point out that high humidity zones and flooded areas found in certain lots are preferred by this pest.
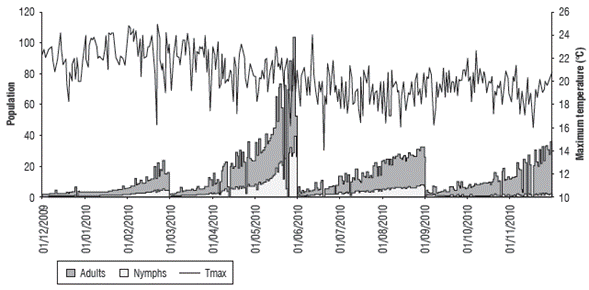
FIGURE 5 Relationship between the estimated population values of nymphs and adults and the maximum temperature (°C) from December, 2009 to November, 2010.
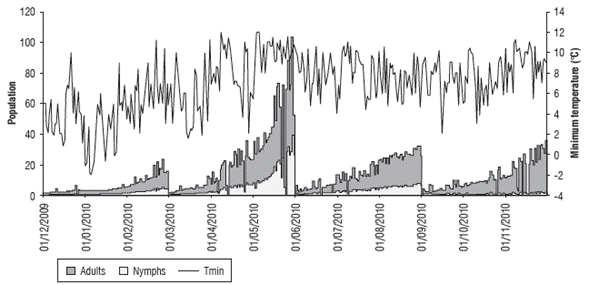
FIGURE 6 Relationship between the estimated population values of nymphs and adults and the minimum temperature (°C) from December, 2009 to November, 2010.
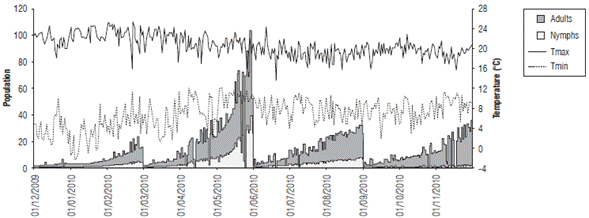
FIGURE 7 Relationship between the estimated population values of nymphs and adults and the maximum and minimum temperature difference (°C) from December, 2009 to November, 2010.
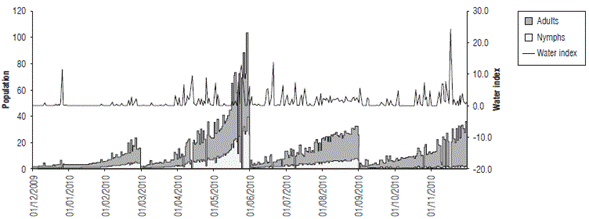
FIGURE 8 Relationship between the estimated population values of nymphs and adults and the water index from December, 2009 to November, 2010.
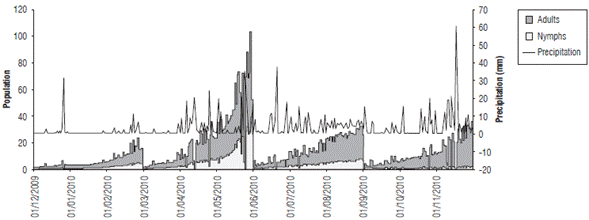
FIGURE 9 Relationship between the estimated population values of nymphs and adults and precipitation (mm) from December, 2009 to November, 2010.
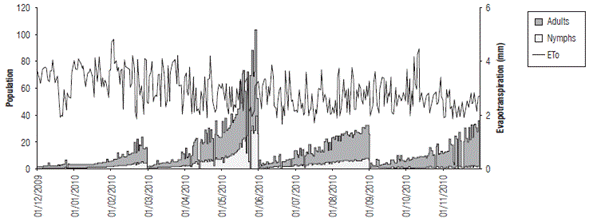
FIGURE 10 Relationship between the estimated population values of nymphs and adults and the evapotranspiration (mm) from December, 2009 to November, 2010.
In the analysis of the relationship between the population variation and water availability, IH was compared with pest growth over time (Fig. 8). The results showed that a positive effect was established in the development of this insect as a result of a larger population for the MAM quarter, in which there was higher water availability.
If population fluctuations are directly related to precipitation (Fig. 9) and evapotranspiration (Fig. 10), the former did not present a clear relationship, although for some rainfall increases, the pest population tended to grow, especially for adults. In the case of ETo, there was an inverse response, as during the MAM quarter, with a larger population, the ETo value is lower. On the other hand, for the DJF quarter with high evapotranspiration, the lowest number of nymphs and adults was found, as explained by the water availability that is used by this species in pastures.
However, it is important to note that, for insect development, although there was water availability resulting from significant rain, a previous phase of temperature accumulation was necessary since this pest grows as it stores degree days.
An additional analysis was performed for nymph and adult growth for the March-May 2010 period (during which the largest population of the period was found) in relation to water availability. In Figure 11, the population of MAM is shown as a function of the water index, and Figure 12 shows it in relation to precipitation. For the precipitation and index value increases, the nymph and adult population growth was recorded, but there were significant decreases in the highest peaks. Therefore, rainfall favored insects to a certain extent, and then damage ensues. According to Martínez and Barreto (1998), rain affects nymphal stages as a result of the blow of the water drop on the insect, which causes death. Additionally, excessive or scarce water is related to high mortality rates. This species is susceptible to the amount of water or its accumulation, which can also be linked to a response to the increase in food availability. When pastures have a certain amount of water, they become richer in nutrients and, therefore, become a more beneficial environment for insect species that increase their populations.

FIGURE 11 Relationship between the estimated population values of nymphs and adults and the water index from March to May, 2010.
Population estimation and spatial distribution for an 'El Niño' event
To provide information on the spatial behavior of the species and establish the areas of the Bogota plateau in which climatic conditions are more favorable for this pest, population distribution maps of the region were prepared for the four agroclimatic quarters under an El Niño event (Fig. 13). In this map, the total population of this pest was considered, i.e. the sum of nymphs and adults, constructed from the data obtained from the meteorological stations. The maps included a scale from zero (0) to 150, where zero indicates the smallest population size and 150 the largest, which indicated that, under an El Niño event, the period with the highest pest presence was the MAM quarter, and the highest values were found in the southern area of the Bogota plateau.
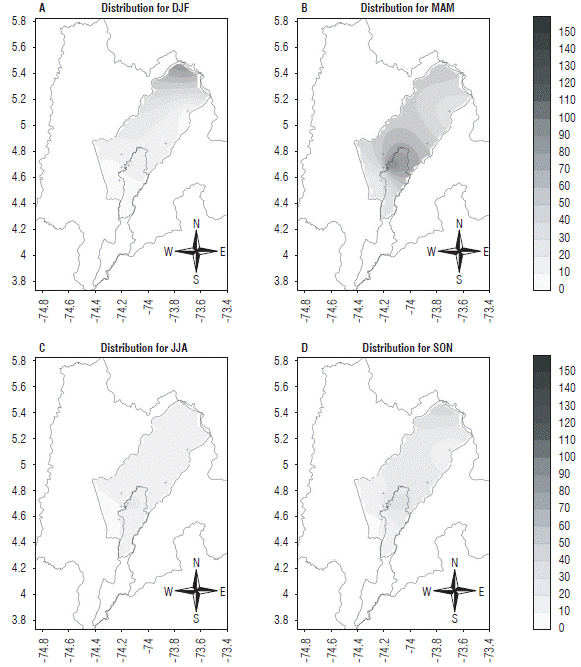
FIGURE 13 Spatial distribution of Collaria scenica on the Bogota plateau from the estimates for the four agroclimatic quarters considered under El Niño conditions. Abreviatures for quaters: DJF: December, January, February; MAM: March, April, May; JJA: June, July, August; SON: September, October, December. The axes represent latitude (Y) and longitude (X).
Population estimation and territorial distribution for a 'La Niña' event
Under the La Niña conditions (Fig. 14), this pest maintained a higher presence during the rainy season, but with a lower tendency to grow than in the case of an El Niño event. This is related to water abundance, but, since there is low energy availability during a La Niña event, there is not enough heat accumulation for better pest growth. On the other hand, during an El Niño event, the amount of energy is higher because of an increase in atmospheric temperature, and water availability is also higher during the rainy seasons, favoring the development of this species.
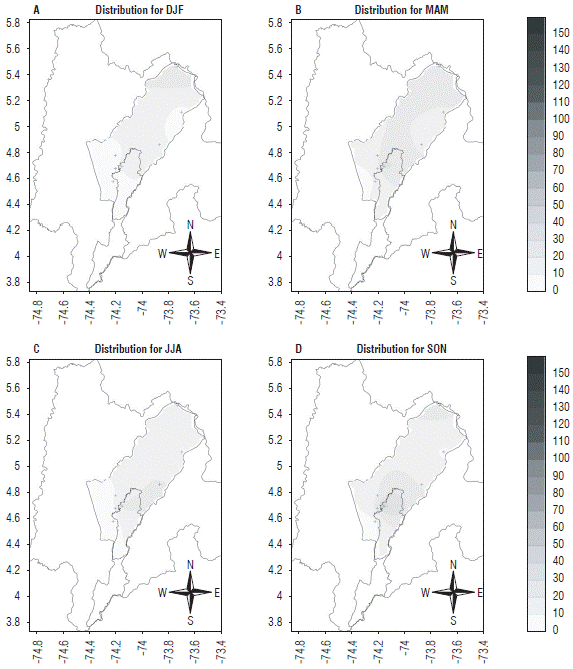
FIGURE 14 Spatial distribution of Collaria scenica on the Bogota plateau from the estimates for the four agroclimatic quarters considered under La Niña conditions. Abreviatures for quaters: DJF: December, January, February; MAM: March, April, May; JJA: June, July, August; SON: September, October, December. The axes represent latitude (Y) and longitude (X).
Population estimation and territorial distribution for a neutral year
The spatial distribution on the Bogota plateau in each quarter under neutral conditions during one year (Fig. 15) presented a very similar behavior throughout the year in terms of pest presence. These values were lower than the ones found during a La Niña period and even much lower than during an El Niño event. However, in the first quarter, there was a higher pest abundance.
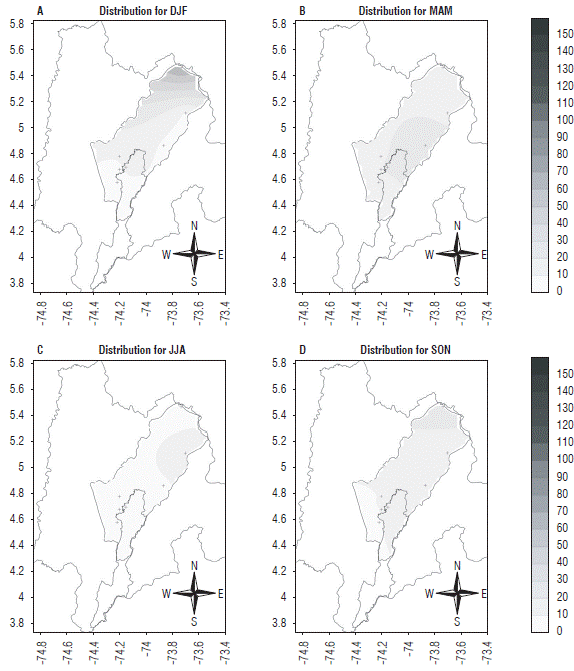
FIGURE 15 Distribution of Collaria scenica on the Bogota plateau from the estimates for the four agroclimatic quarters under neutral year conditions. Abreviatures for quaters: DJF: December, January, February; MAM: March, April, May; JJA: June, July, August; SON: September, October, December. The axes represent latitude (Y) and longitude (X).
These results coincide with similar studies on other species in Colombia, such as the case of the coffee berry borer (Hypothenemus hampei). According to Ramírez et al. (2015) the El Niño and La Niña phenomena have a marked effect on the thermal time accumulation of this species. Above 1,400 m a.s.l., El Niño generates a significant tendency to increase favorable conditions for the growth and development of this borer.
Conclusions
An adequate method to explain the behavior of the grass bug in relation to agroclimatic variables is using a multiple linear regression equation, which considers total population values and the degree day and water indices, which builds a model with appropriate estimates of nymph and adult population fluctuations, which is useful in the prediction and analysis of the growth trends of this pest in response to the climatic conditions of the region. The degree day index establishes the optimum conditions for this species, and the water index facilitates the evaluation of possible periods with water deficiency and excess that will affect, in one way or another, the development of both the insect and the pasture.
The climatic condition characteristics in which this pest has a tendency to increase and from which population monitoring can be carried out are based on the fact that T max acquires an inverse effect on the development of the pest, whereas water availability and T min have a positive effect. Population growth occurs for low T max and ETo values and high T min and PPT values, differentiating the positive effect of abundant precipitation, but not excessive rainfall, which decreases the number of insects, possibly as a result of the blow of the drops.
The rainy seasons of the year corresponding to the MAM and SON quarters for the Bogota plateau are the highest vulnerability periods as a result of the presence of the pest.
Furthermore, the first quarter had the highest abundance, which was related to an increase in temperatures during the DJF quarter, which favors pest growth and food abundance, as a result of higher precipitation values during the MAM quarter.
Under El Niño and La Niña events, population increases are estimated with higher abundance for the former because of heat accumulation resulting from increases in temperature, which favor the growth of this insect during this event. The quarter with the highest tendency to obtain appropriate climatic conditions for this grass bug was the first rainy season, which was related to a better pasture development as a result of the presence of rain and the use of temperature accumulated under El Niño conditions. During a neutral year, pest estimation was lower, and, therefore, the influence of the effects of interannual climate variability on the behavior of this grass bug on the Bogota plateau can be deduced.


