Introduction
During 2016, Colombia produced 56,163 t of cacao (Theobroma cacao L.) in an area of 165,844 ha (FAO, 2018); moreover, the province with the largest cacao producing area at the national level was Santander with 31.6% (DANE, 2016), in farms characterized by being of farmer economy with a long family tradition (Mojica et al., 2006). According to the production characteristics mentioned before, the cacao crop fits within the definition of an "agricultural system", in which the emergence of basic resources, the monitoring of business guidelines and family related livelihood means are highlighted (Dixon et al., 2001). In this sense, the use of basic resources or production factors (i.e. land, labor and capital), family related or not, generate necessary expenditures to maintain the crop and are defined as production costs (Zugarramurdi et al., 1998). The importance of the costs and their adequate registration and interpretation lies in the fact that the competitiveness level of the system can be measured and monitored (Perfetti et al., 2012).
Maletta (2011), addressing the cost analysis, emphasizes that the coexistence of family and business features within the cacao production system in Colombia generates a differentiation in the amount of real monetary disbursements made during the production process. In accordance with the above mentioned, although family and business production requires the use of labor, family farming uses non-contracted work outside the farm this is rarely remunerated (Schejtman, 2008). In addition to the use of unpaid labor in family farming systems, it is possible to add the use of inputs and their own seeds as non-monetary or implicit disbursements generators (de Renolfi, 2007) or non-monetary costs (Gómez, 1987; Seminario, 2004); this cost category is important within cost structures because it allows a further analysis of their own resources, destined to cacao production, and eventually, the opportunity costs that this task implies (Parkin and Esquivel, 2006). Furthermore, within the financial analysis on the sale prices, non-monetary costs can be the defining factor for the production costs in terms of producer satisfaction (De Janvry, 1995).
According to the aforementioned, the main objective of this study was to show the required cost (monetary and non-monetary) for conducting a start-up and the annual activities to produce cacao. The analysis includes the identification of two typologies or producer groups, one with low technification level and the other with medium level in the municipalities of El Carmen de Chucuri and San Vicente de Chucuri in the province of Santander, Colombia. Our analysis focuses on the required cost for a producer, in the above-mentioned area, to carry out three activities for the crop establishment (new sowing, rehabilitation and renewal) along with the annual maintenance activities. Based on the productive nature of the system in the area, costs were disaggregated into monetary and non-monetary, highlighting quantitative relevance of the activities that do not generate real money disbursement. Furthermore, on average, for the activities analyzed in the two typologies identified, 36% of the costs are classified as implicit or non-monetary, with labor being the most important item, and with an average family contribution of 34% of the total cost.
Materials and methods
Given the productive variability that can be identified in a territory, the process of obtaining the cost of start-up and annual cacao production activities in the province of Santander was divided into two phases; the first one considered the typification or grouping of producers given the technology used, while the second one structured the costs of each group of the identified producers.
Typification of producers or grouping by cluster
In order to determine the typologies of cacao producers in the region, a two-step exploratory sequential analysis (Jokiniemi et al., 2018) was performed. During the first step, a workshop with regional cacao experts from FEDECACAO (National Cacao Producers Federation) and AGROSAVIA (Colombian Agricultural Research Corporation) was conducted; these experts described all the activities required for producing cacao in Santander and prioritized those with an important impact in the production cost, such as plant material, the establishing process, and the daily labor conducted by the farmers. Based on the results of the workshop, five variables were identified and used in the second step. In addition, experts concluded that fixed costs are not relevant for this production system in the region; in this sense, the costs considered were not included in the analysis.
The first variable is the type of plant material: within the study area, two types of plant material were identified and due to their management and production characteristics, they generate a differentiation in the production cost patterns. The first material was a cacao hybrid, which results from the sexual crossing of two cocoa trees, guided by specialized operators after a selection process, trying to obtain certain desirable characteristics. The crossing is carried out between clones with different features to improve diverse aspects of interest such as fruit quality, productivity, precocity, response to pests and diseases, among others. The second type of plant material was a clone (the concept does not mean that all plants developed from the same clone are phenotypically identical in all their characteristics) with a uniform genetic material derived from a block and propagated by vegetative means, and in which plant behavior depends on the genotype-environment interaction. Palencia and Mejía (2003) stated that a plant varies in its appearance, production, fruits or beans, among others, according to the climate, soil type, water, diseases and other causes.
The second variable is the type of crop establishment: given that cacao trees are perennial species and usually reduce their productivity under prolonged cycles, duplicated tree establishment mechanisms with productive potential were used as follows: a) New sowings: the establishment of previously grafted trees in nurseries or at the farm; in this case, all tracing and hole digging tasks were needed to be carried out. b) Rehabilitation: a practice that must be carried out on severely damaged trees due to poor pruning management, advanced phenological stage, and plantation abandonment due to low or nule production area in primary branches. For Mejía and Argüello (2000), this is the effect of mechanical damage or unproductive planting material, which constitutes an obstacle to efficient agronomic management execution, especially during harvesting and control of diseases, such as witches' broom (Moniliophthora perniciosa) and moniliasis (Moniliophthora roreri).
The third variable is the fertilization labor and the application/no application of amendments and/or fertilizers: when the application of a fertilizer or an amendment is carried out, the type used must be stated as chemical, biological, or organic.
The fourth variable identified is plant pruning: pruning practices throughout the year, their quantity and type must be stated, since these can be formative, sanitary or for maintenance purposes.
Finally, the fifth variable is disease management labors: sanitary applications and pruning are practices focused on disease management, such as monilia pod rot and witches' broom (Aime and Phillips-Mora, 2005).
Once the variables were defined, and for the second step, the cluster analysis technique was applied using the statistical package RStudio (National Agricultural Survey ENA, 2015, used as database). According to Villardón (2007), this type of analysis allows the structuring of a data set into groups whose similarities cannot be observed a priori, but once identified, are useful for statistical interpretation; according to the objective of the study data, the selection of the final number of clusters follows a subjective exercise. In this sense, in order to verify the results regarding grouping of producers with the reality of the area, these analises were socialized and discussed with a professional staff from FEDECACAO and AGROSAVIA that had experience in cacao production system management in Santander. From these meetings and by consensus, it was concluded that, in the cacao tree cultivation area of San Vicente del Chucuri and El Carmen del Chucuri, there is a contrast between two types of producers (typologies); those who perform some work to produce cacao, and those who are almost entirely dedicated to harvesting the grain without prior management.
Structuring cacao production costs
This phase of the process was developed with the collection of primary information in 60 cacao-producing farms (convenience sample) in the municipalities of San Vicente del Chucuri and El Carmen del Chucuri in the province of Santander, Colombia. A structured survey was conducted at the farms (with farm owners). The information obtained in the surveys was consolidated in a database, considering the difference for each typology compared to rehabilitation (RH), renewal (RN), new plantings (NP) and annual managment (AM) activities. Each of these activities was divided into items, such as plant material (sexual and asexual seed types), labor and inputs, which in turn, were subdivided into monetary and non-monetary costs.
In order to determine the range of cost values of each of the activities evaluated and to some extent the probability of occurrence of each value which introduces risk analysis to the costing exercise (Palisade Corporation, 2016), outcomes were adjusted to probability distributions using the statistical package @RISK 7.0. The value of the unit cost is COP $/tree, because this form of measurement can offer a better calculation of the cost per hectare considering the specific regional density. This will allow a better decision making and it is considered more approximated because the studied zones do not have the same densities, as it can happen in other areas or crops. In such a way, based on the cost per tree, the probability distribution of the cost per activity and the weight of the non-monetary costs within the productive structure, the difference in prices (in terms of percentage) that can be supported by each typology was established to generate financial returns that cover, at least, the monetary costs.
Results and discussion
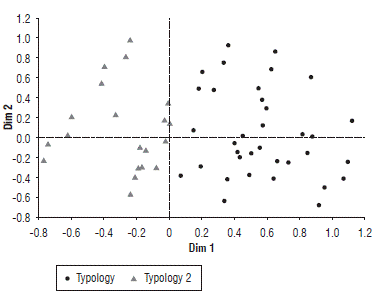
Based on the methodology and variables mentioned above, and even though the dispersion diagram and the cluster analysis (Fig. 1) showed three possible clusters, the consensus reached by the experts of FEDECACAO and AGROSAVIA grouped the results as part of only two types of producers: those that perform some tasks to produce cacao and those that are dedicated almost entirely to the harvest of the grain without prior handling.
The first typology is comprised by 45% of the observations collected, in which producers maintain a low technological level compared to cacao management systems. Regarding fertilization and type of application, 86% do not perform any activity focused on this management practice; moreover, 91% do not perform chemical fertilizer applications and only 14% apply some kind of organic fertilizer. Considering phytosanitary management, the levels are equally low, i.e. 100% of the observations showed that cacao producers do not carry out any cultural management of pests and diseases. Furthermore, for 99% of the observations, organic or biological products are not applied, and for 92% of the observations, there is no application of pesticides of chemical synthesis. In relation to pruning, either focused on maintenance or for sanitary purposes, 75% of the observations showed that this practice is not carried out throughout the year. For the case of variables as type of material, crops and municipality where crops are established, there is no marked trend, which allows us to infer that these are not differentiating variables compared to the crop management, and for this reason, are not variables that guide cacao production cost patterns.
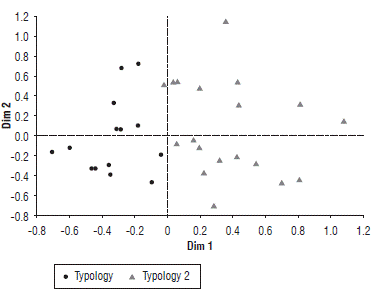
Regarding the second typology of producers, 55% of the observations of the samples were atributed to this category, showing a more advanced technological level than those from typology 1 (Fig. 2). In this way, compared to the fertilization variable, 67% of these producers apply chemical fertilizers, while 39% apply organic fertilizers. In the case of phytosanitary management (pests and/or diseases), there is a predominance of chemical management that is carried out in 68% of the properties, followed by cultural management with 37% and biological management with 27%. Regarding maintenance and/or phytosanitary prunings, the observations showed that producers perform them in 53% of the productive units (farms). As in the first typology, the variables of harvest, the type of material, and the location did not generate a trend; a fact that indicates that these variables can not guide the variability of production costs of the cacao crop.
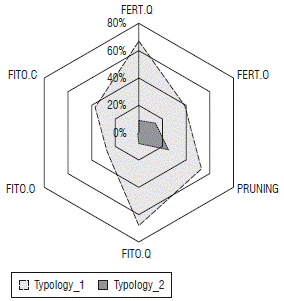
FIGURE 2 Radial diagram of the typologies identified (Fert.Q = Chemical fertilization, Fert.O = Organic fertilization, Fito Q = Phytosanitary management with chemical sources, Fito O = Phytosanitary management with organic sources, Fito C = Phytosanitary management with chemical and organic sources).
The results obtained in the typification phase in the municipalities of El Carmen de Chucuri and San Vicente de Chucuri, in which two groups were identified and differentiated by the intensity level of the productive activities carried out, contrast with what was observed by Mantilla et al. (2000). These authors identified that, at a technological level, the municipalities of El Carmen de Chucuri and San Vicente de Chucuri (altogether) have a greater tendency towards the technological management of cacao trees compared to other municipalities in the province. Likewise, the two typologies identified, or at least the one with the highest intensity level of productive activities, differs from the results published by Ramirez Sulvarán et al. (2014), in which cacao producers from the municipalities of Norte de Santander were identified as a single typology of mercantile-family characters.
On the other hand, there is agreement between the results observed in our study and the fourth typology described by Purdue University and CIAT (Lundy et al., 2017) in the province of Santander, where the productive level is diversified with different productive levels, in which the improvement has occurred, among other reasons, by the combination of traditional and new productive system practices. Finally, there is concordance between the results observed and the typologies mentioned in a methodological census of cacao carried out by DANE and cited by Superintendencia de Industria y Comercio (2011), in which three levels of technification are mentioned (medium, low and high); it is worth noticing that the first two are similar to those observed in El Carmen de Chucuri and San Vicente de Chucuri.
Costs structure
In order to verify the coherence of cost data with the results of the typification, the cost structures were subjected to a cluster analysis. In this way, the respondents were divided into two groups that were related or not to the execution of the activities of the crop that generate an expense (Fig. 3). The first typology comprises 31 farmers, of which 56% carried out rehabilitation during the survey period (i.e. 5 years), 38% renewed their plant material and 41% established new plantings. On the other hand, 29 farmers were included in the second typology, and from these, 38% carried out rehabilitation activities, 66% renovated their plant material and 10% established new crops. Although global activities or items are similar for both clusters, these items were subdivided into activities that, in turn, served as variables for the analysis of conglomerates, and whose difference originated the final values of the cost structures.
The cluster results showed that the typology 1 spans the cacao producers with low technification and low input use frequency. Moreover, this group showed the least number of activities executed specific to cacao (pruning, fertilization and phytosanitary management). Results of the cost structures show that, within the four cost activities considered, the lowest average value per cacao tree is the annual management activities, followed by rehabilitation, renewal and new plantings (Tab.1).
TABLE 1 Average total cost per cacao tree for typology 1 producers.

RH: rehabilitation, RN: renewal, NP: new plantings, AM: annual management.
COP (1 USD is ca. 3,162.40). Representative exchange rate March 11, 2019.
The cost structure for this typology showed relatively high labor values as a trend, showing that the annual management activities (AM) is the highest value with 93% and the new planting activities (NP) is the lowest value with 56%. In all the activities, the use of inputs was relatively low and its weight within the structure does not exceed 10%.
Regarding the monetary costs and those that do not generate real money expenditure (non-monetary), the percentage of what is paid is higher (monetary costs) in all cases (Tab. 2); the percentage values of the non-monetary costs ranged between 29% for renewal (RN) and 48% for SN (rehabilitation (RH) and AM activities have non-monetary costs of 32% and 31%, respectively). According to the above mentioned, under an analysis of disposable income (gross income minus monetary costs), a farmer could find an equilibrium price that is 31% lower than what would be needed under a traditional utility analysis (total income minus total costs).
TABLE 2 Monetary and non-monetary cost per cacao tree for typology 1

RH: rehabilitation, RN: renewal, NP: new plantings, AM: annual management. COP (1 USD is ca. 3,162.40). Representative exchange rate March 11, 2019.
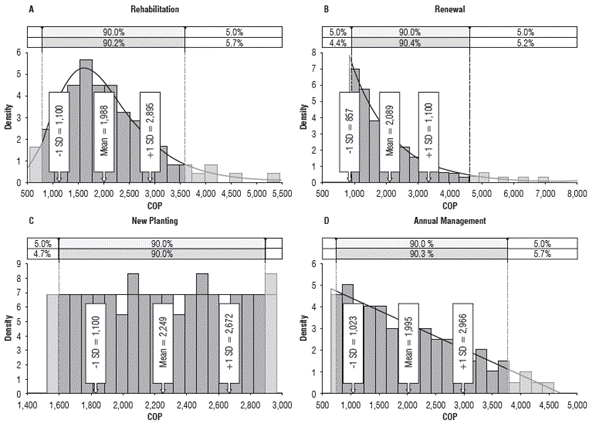
Furthermore, the results of the four cost activities show differences in the probability distribution that each one possesses (AIC criterion). In the case of rehabilitation, the largest adjustment was made under an ExtValue distribution (Fig. 4A), with distinctive tails to the left and right sides of the mean, with a value of COP$ 1998. This procedure was also performed in the range of values in which 90% of the observations are found from COP$ 1,047 to COP$ 2,958, with a higher probability of finding values below the average (57%). Likewise, the renewal activity -RN generated an exponential distribution (Fig. 4B) with a mean value of COP$ 2,108 and range values between COP$ 547 and COP$ 3,779; although it does not have tail values to the left of the mean, it has a higher value probability in this side of the distribution. Furthermore, new plantings show a uniform distribution (Fig. 4C) in which 90% of the values range between COP$ 1,825 and COP$ 2,670, with an average of COP$ 2,248; in this case, the observed frequency generates the same probability for all values. Finally, the annual management activity costs are distributed under a decreasing triangular function to the right (Fig. 4D) with a mean value of COP$ 1,901 and a range of 90% of the values between COP$ 896 and COP$ 2,910.
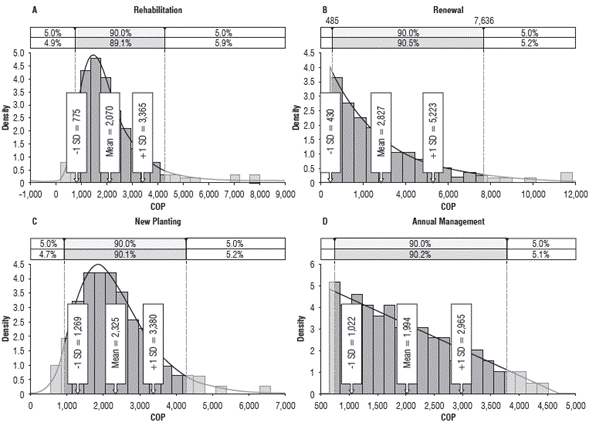
On the other hand, the second cluster shows the typology 2, producers with a relatively high level of crop management and activity execution. In general, among the four cost activities assessed (Fig. 5) the highest average value per tree was reported in the renovation activity with COP$ 2,800, followed by new planting, rehabilitation and annual management activities (Tab. 3).
TABLE 3 Average total cost per cacao tree for typology 2 producers.
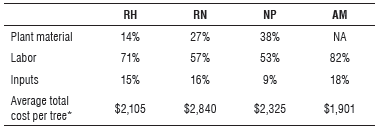
RH: rehabilitation, RN: renewal, NP: new plantings, AM: annual management. COP (1 USD is ca. 3,162.40). Representative exchange rate March 11, 2019.
As in typology 1, the cost structure of typology 2 showed a trend of relatively high values (over 50% in all cases) in the labor category (Tab. 3). The differentiating factor between the two typologies was shown in the item inputs, which is in all cases, higher in the second typology and confirms what was described in the previous typification.
The relationship between monetary and non-monetary costs was maintained for the RN, NP and AM activities, with a higher percentage of activities with real money disbursement over those that are not remunerated (non-monetary costs); in the case of the RH activity, the proportion was inverted and 64% of unpaid costs were reported with a 36% of monetary costs.
Regarding the weight of the items found in the two typologies, these coincide with those reported by Perfetti et al. (2012) in which the labor costs for the cacao management in Santander showed the highest weight percentage within the structure and surpassed the input costs by 54%. Similarly, Barón (2016) reported that for "new plantings", "rehabilitation" and "annual management" activities at the national level, the percentage weight of labor is higher than the percentage value of inputs. In this way, we can conclude that the labor sector is the most important within the cacao cost structure in Santander. Furthermore, Clavijo and Ardila (2015) estimated a production frontier function for cacao, establishing that this variable has a positive and significant effect on the economic efficiency of the crop in the area.
The distributions in which the costs of the activities from typology 2 were adjusted showed a differentiation in frequencies as they did in the first typology. For the case of RH, the largest adjustment (AIC criterion) was found with a Log Logistic function, with queues on both sides of the mean (as in typology 1), the range in which 90% of the data is found ranges from COP$452 to COP $3,820. For the case of RN, the data of typology 2 was adjusted in a similar way as in typology 1 under an exponential function; however, in this case, the average value is the furthest from the Y axis, with a value of COP $2,804. The NP activity data were adjusted under an ExtValue function, with queues at both ends, and high probability of occurrence in values close to the mean (COP $2,325), and 90% of the values lie in the range between $ 1,204 and $ 3,466. Finally, the AM activity, as in typology 1, was adjusted under a triangular function with a most probable value of $ 1,901.
Accordingly, when the comparison between both typologies is made, they showed a differentiation in the distribution of production costs of each of the activities financed. Likewise, weight percentage of each item within the structure showed a marked tendency in which the labor force shows the highest value and the lowest weight is recorded by inputs, while the percentage value is higher for inputs in the typology 2 compared to typology 1. To verify that differences in the variables that gave origin to each typology that generates differentiation in the cost associated to theme, the congregated groups are presented below (Fig. 6).
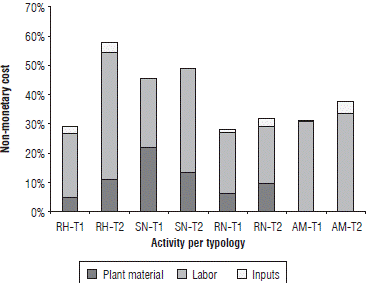
FIGURE 6 Cost distribution of four activities financed by the two typologies. RH: rehabilitation, RN: renewal, SN: new planting, AM: annual management.
In general, for all the activities financed (rehabilitation, renewal, new planting and annual management), typology 2 showed higher average values than typology 1, highlighting the renewal activity in which the difference of the mean value of typology 2 compared to typology 1 is COP$ 732; on the other hand, in other activities the difference does not exceed COP$ 107. The lowest average value corresponds to annual management activities in typology 1. Since the data are shown as distribution, it is important to mention that, except for this activity, which has higher mean values in typology 2, distributions have wider ranges, which shows the probability of finding values below the minimum cost in typology 1 in each activity. Based on these results, we can conclude that the cost structures defined for each typology are consistent with the results of the previous typification phase; subsequently, it is inferred that the methodology is useful for cacao productive systems in the demarcated territory.
The contribution of "non-monetary costs" to the cacao cost structure
According to the data previously discussed and summarized in Tables 2 and 4, the importance of the contribution of non-monetary costs to the cacao cost structures in Santander is recognized. In Figure 7, it can be observed that this type of cost varies depending on the type of producer and the item to which reference is made.
TABLE 4 Monetary and non-monetary cost per cacao tree for typology 2 producers.

RH: rehabilitation, RN: renewal, NP: new plantings, AM: annual management. COP (1 USD is ca. 3,162.40). Representative exchange rate March 11, 2019.
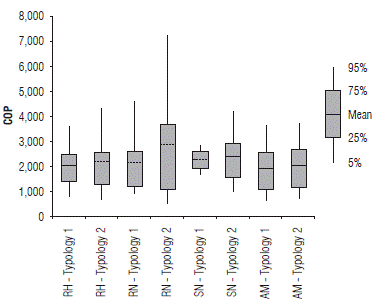
FIGURE 7 Contribution of non-monetary costs to the cacao production cost structures in Santander by per activity. RH: rehabilitation, SN: New plantings, RN: renewal, AM: annual management, T1: Typology 1, T2: Typology 2.
The general contribution of non-monetary costs to the general structure was greater than 28% with an average of 36% at the typology level for both cases and including the four cost activities; the rehabilitation activity in typology 2 reached a value of 58%. The comparison between similar activities in the two typologies, as well as in the average costs analyzed previously, showed a tendency towards superiority in the percentage value of typology 2. In this way, rehabilitation, new planting, renewal and annual management activities showed differences in favor of typology 2 of 28.6%, 3.3%, 3.9% and 6.5%, respectively. At the items level, labor force showed the highest values (28.61% on average) in all activities for the two typologies. The highest labor value was found in the rehabilitation activity in typology 2 with 43%, followed by new planting in typology 2 with 36%, and annual management of this same typology with 34%.
In practical terms, the values of both inputs and plant material (sexual and asexual seeds) that did not represent money disbursement by farmers, can be explained by the campaigns to promote planting that have been developed in the country since 2012 (base year for production cost consultation). These plans established agreements with public and private entities to provide themselves with certified seeds (MADR, 2012). In addition to strengthening capacities on seed issues at the farmer agriculture level, they have shown the physical provision of seeds to farmers as a fundamental component (MADR, 2015). This type of contributions from promotion campaigns generated an average reduction of 9% in the monetary disbursements in the farms surveyed. Moreover, and although the general objective was to increase the national cacao tree cultivation area (MADR, 2012), these campaigns could be framed as an element of social protection that allows poverty reduction (at the family and regional levels) and the promotion of economic growth (FAO, 2015).
On the other hand, non-monetary costs in the labor sector, which averaged 34% in the four activities financed for the two typologies, are related to the cacao production mode in the area and in general; besides, this is also valid in Latin America where family farming is fundamental for the cacao production chains (Arevalo et al., 2016). Although family work is not the only feature that characterizes this type of agriculture, it is the main element that can be found in the conceptual definitions of this type of production system (Salcedo et al., 2014); in this regard, this type of labor is rarely remunerated and in minimum amounts (Schejtman, 2008). Another fundamental fact in the contribution of unpaid labor (mostly family related), is the low value that opportunity costs represents for farmers when performing tasks within their own farm. This does not necessarily imply a lack of extra-farm employment, understanding that in Colombia the problem is not unemployment per se but low quality and low income (Leibovich et al., 2006). According to what we observed in our survey results and based on what was described by Barrett (1996) and IICA (2015), unpaid labor is also a financial and market risk management element for cacao farms of Santander. The nature of the labor contribution reduces the payment for farming activities and the prices necessary to establish an equilibrium point (income = expenditures), when compared to a producer framed in business agriculture in which all inputs and activities are remunerated. The quantitative difference to find this equilibrium point from a cacao producer in Santander is represented by the total production costs (Tabs.1 and 2) minus the non-monetary costs (Fig. 7).
Conclusions
The double-phase methodology (typification- costing) was consistent to obtain the start-up and annual production activities costs for producing cacao in Santander; this was corroborated with the differentiation obtained with the mean cost values (always higher in the typology of medium technification level) that were consistent with what was reported in the typification carried out. We recommend that it should be applied in other cacao producing territories to validate its consistency and generate feedback.
Labor is the most important category within the cost structure of cacao production in Santander. From this we can conclude that this productive system is not intensive in the use of inputs (chemical or organic) or seeds, and that current productivity is based on the work performance in which labor factor is used.
Non-monetary or implicit costs have a considerable weight in both types of producers, for the typology one, the non-monetary cost was 35% of total average cost per tree, while for the second type of producers it represented 47% of their total average cost per tree. This fact confirms the family nature within the cultivation systems in the studied area, and it is an element of risk management for cacao producers in the area. In comparison with industrial farming, family farming has a lower equilibrium price; this difference is equal to the non-monetary cost percentage. Regarding cacao as a national production system, the weight of the non-monetary cost could imply a guide for conducting public policies. For instance, if the traditional family farming system is changed to an industrial one, with paid labor, it could imply a greater risk of financial losses for farmers. In this sense, the policy must be oriented to reduce the unitary production cost. We recommend expanding studies on the behavior of labor in rural territories, addressing an integrated rurality vision.


