


 English (pdf)
 Article in xml format
 Article references
 Send this article by e-mail
 Cited by SciELO
  Cited by Google
  Similars in
SciELO
Similars in
SciELO  Similars in Google
 Permalink
Introduction
Potato (Solanum tuberosum) is cultivated in Colombia, especially in the provinces of Antioquia, Boyaca, Cundinamarca and Nariño, where Cundinamarca and Boyaca are the most important areas for potato production (Ñústez, 2011). According to Fedepapa (2014), 250 potato cultivars are produced in Colombia; but the most important are: Criolla Colombia, Criolla Dorada, Criolla Ocarina, Pastusa Suprema, Superior, Diacol Capiro, Ica Puracé, Tuquerreña, and Roja Nariño.
The Crinivirus genus comprises an important group of emergent plant viruses widely distributed in the world belonging to the Closteroviridae family (Martelli et al., 2013). Within their genomes two proteins are coded that oscillate between 26 and 28 KDa (group P26) and 8 and 10 KDa (group P10). These proteins are unique in the genus and are orthologous in the 15 species sequenced and reported in the GenBank (Kiss et al., 2013; Genbank, 2019). These proteins have been characterized in some criniviruses, in which their participation in infectious processes, cell movement (Grimsley et al., 1986; Medina et al., 2003; Medina et al., 2005; Wang et al., 2009; Kiss et al., 2013), and physical self-interaction (Stewart et al., 2009) have been demonstrated.
Potato yellow vein virus (PYVV) is a re-emergent Crinivirus that causes potato yellow vein disease (PYVD), which is characterized by chlorosis in veins and can remain in asymptomatic plants. It also infects Solanum lycopersicum, Rumex sp., Catharanthus sp. and Polygonium sp. plants (Salazar et al., 2000; Muñóz et al., 2017). The virus is transmitted by infected tubers, grafts, and by the whitefly Trialeurodes vaporariorum in a semi-persistent way (Salazar et al., 2000; Gamarra et al., 2006; Wale et al., 2008; Barragán and Guzmán-Barney, 2014; Hernández and Guzmán-Barney, 2014).
PYVV was first reported in Antioquia (Colombia) in 1943 in plants of the S. tuberosum group Phureja (Diploid) (Salazar et al., 2000), and it was later reported in S. tuberosum group Andigena (Tetraploid). In 1996 the PYVV virus dispersed to Ecuador, Peru and in 1998 to Venezuela (Salazar et al., 2000; EEPO, 2019).
PYVV is a virus limited to the phloem and accompanying cells. It has a tripartite genome composed by three molecules of single-stranded RNA, positive polarity and two defective RNAs (Eliasco et al., 2006; Muñoz et al., 2017). RNA 1 (8,035 kb) has three open reading frames (ORFs), RNA 2 (5,339 kb) and has five ORFs, and RNA 3 (3,892 Kb) has three ORFs. The P10 and P26 proteins of PYVV are present in both RNA 2 and RNA 3.
The Closteroviridae family is considered to be invariable, but there are differences among the genera. For example, Ampelovirus and Closterovirus genera are the most variable, and Crinivirus the least variable (Rubio et al., 2013; Erkiç-Güngör and Bayram, 2019). Low variability and genetic diversity have been reported for PYVV through single strand conformation polymorphisms (SSCP), restriction fragment length polymorphisms (RFLP) and sequence analysis of major capsid protein gene (CP), minor capsid gene (CPm) and heat shock protein homologue gene (HSP70h), although CPm is more variable and has a tendency for recombination (Offei et al., 2004; Guzmán et al., 2006; Rubio et al., 2013; Chaves-Bedoya et al., 2014; Cubillos and Guzmán-Barney, 2015).
Due to the importance of P10 and P26 gene orthologues group in pathogenicity, its viral cycle in Crinivirus, and the fact that these genes have not been studied in PYVV, it is necessary to know about the variability, evolution and presence of molecular viral variants in potato plants generated by selection pressure, mutations, genetic drift, migration and also inter and intraspecific recombination events. These factors may impact the PYVV infectious capacity within its host and the ability to colonize other plant species, increasing the hosts' range as in tomato plants (Ruiz et al., 2018). Our objective in this study was to analyze the P26 and P10 genes of PYVV isolates from two contrasting geographic regions of Colombia to determine their genetic variability, evolution, and possible relationships with the host.
Materials and methods
Plant material
Sampling was performed in potato plots with a high incidence of plants affected by PYVD symptoms in Nariño, Cundinamarca, and Boyaca (Colombia). From each crop plot leaf samples from the middle third of different plants of the potato S. tuberosum Andigena group (StA) and Phureja group (StP) were collected. The samples were covered with absorbent paper towels, stored in perforated plastic bags, and transported to the Biotechnology Laboratory of the Facultad de Ciencias Agrarias of the Universidad Nacional de Colombia, Bogota campus for the analysis.
Primer design
To obtain a set of primers for specific amplification of P10 and P26 genes of PYVV, we used the Primer 3 program v.0.4.0 (Koressaar and Remm, 2007; Untergasser et al., 2012) and Primer BLAST (https://www.ncbi.nlm.nih.gov/tools/primer-blast/). As templates, we used accessions AJ557129.1 (for P10 gene) and AJ508757.2 (for P26 gene) of PYVV Peruvian genome sequences from GenBank. The two primer pairs with the best characteristics in terms of length (20 to 25 bp), > 40% guanine-cytosine percentage, minimum dimerization and temperature delta between primers, flanking location for covering 100% of each gene, and melting temperature between 50 and 60°C were selected. The AmplifX program version 1.5.4 (http://ifrjr.nord.univ-mrs.fr/AmplifX) was used to simulate the migration of fragments of the P10 and P26 genes with the selected primers in a virtual agarose gel.
Total RNA extraction and verification of PYVV presence
Total RNA was extracted with the RNeasy Plant Minikit (Qiagen™) following the manufacturer's instructions, except for the use of the QIAshredder® column. The same column was used to purify and concentrate two replicates of each sample, and these were unified. RNA was diluted in 30 μL of RNAase free water (Qiagen™) and maintained at -20°C until use. To verify the presence of PYVV in the samples, the CP gene was amplified as a control, according to the protocol by Hernández and Guzman-Barney (2014).
Primer verification, RT-PCR and sequencing
All the reagents used for the reverse transcription (RT) and amplification (PCR) process were from the Invitrogen™ brand (Thermo Fisher Scientific, MA, USA), and RT-PCR was performed in a thermal cycler (C1000, BioRad®, Berkeley, CA).
Two samples from Nariño and Cundinamarca were selected for primer verification. SuperScript® III kit (First-Strand Synthesis System for RT-PCR®) was used for P10 and P26 RT in positive samples for amplification of PYVV-CP, following the manufacturer's instructions. In separated reactions we mixed 3 μL of total RNA, 0.5 μM of P10 and P26 primer reverse (designed in this investigation, Tab. 2), 1 mM of dNTPs, 1X of buffer, 10 mM of ditioeritrol (DTT), 1.6 u μL1 of RNaseOut®, 5 mM of MgCl2, 8 u μL1 of reverse transcriptase (Superscript®III), and RNAse free water to complete the final volume of 10 μL. After RT was performed, PCR for P10 and P26 genes were carried out in separated reactions with PCR® kit, 1X of buffer, 2.5 mM of MgCl2, 0.4 μM of forward and reverse primers (Tab. 2), 0.4 mM of dNTPs, 1 u μL-1 of high fidelity Taq Polymerase Platinum®, 0.6 μL of cDNA, and diethyl pyrocarbonate (DEPC) treated water to complete a final volume of 15 μL. The amplification cycle was as follows: 1 min at 94°C, followed by 34 cycles of 1 min at 94°C, 30 s at 58°C for annealing and 1 min at 72°C for extension, and 10 min at 72°C for final extension. For the amplicon visualization, 2 μL of amplified product was loaded in 1% agarose gel in TAE buffer. The gel was stained with 0.02 mg mL-1 of ethidium bromide. The kit Pure Link PCR Purification was used to purify P10 and P26 gene PCR products. Purified products were diluted in 30 μL DNAse free water and sent to Macrogen® for forward and reverse sequencing.
Variability and diversity of P26 and P10 genes of PYVV
Forward and reverse sequences obtained from each amplicon were assembled and a consensus sequence was generated using CAP3 of the PRABI-Doua- program (Huang and Madan, 1999). Complete P26 and P10 gene sequences were submitted to the EMBL/GenBank to verify the identity using the P26 and P10 genes of PYVV. After verifying the genes' identity, the best primers were selected for RT-PCR performance and sequencing of all the samples in the same way as described above.
For the variability analysis, the contigs of P26 and P10 genes of PYVV were grouped as follows: (1) potato genotype: Andigena (Tetraploid) and Phureja (Diploid); (2) geographical origin: Nariño (N), Cundinamarca (C) and Boyaca (B): and (3) total contigs. The Sequence Demarcation Tool was used for evaluating nucleotide identity through the pairwise matrix (Muhire et al., 2014). The Mega 7 Program (Kumar et al., 2016) was used for multiple alignments by codons with Clustal algorithm and to estimate the best-fit nucleotide substitution model by the Akaike Information Criterion (AIC). The best model was used for the construction of the maximum likelihood tree for each gene with the bootstrap test with 1000 replicas for generating the consensus tree (Nei and Kumar, 2000). The Mega 7 program was used to estimate the average of non-synonymous (dN) and synonymous (dS) mutations and their ratio (dN/dS). The program DNaSP 5.0 (Librado et al., 2009) was used for genetic variability in which we estimated total variable sites (s), total mutations (η), nucleotide diversity (π), total haplotypes (h), and haplotype diversity (dH). The neutrality test of Tajima's D (Tajima, 1989) based on the difference between segregating sites and the average of nucleotide differences, and the Fu and Li's F* test (Fu and Li, 1993) based on the differences between singletons and the average of the number of pairwise nucleotide differences were also used. The program Network 5 (Bandelt et al., 1999) was used for graphic representation of haplotypes for the visualization of phylogenetic networks through the Median-Joining (MJ) algorithm and the statistical parsimony method as described by Templeton et al. (1992).
Results
Plant material
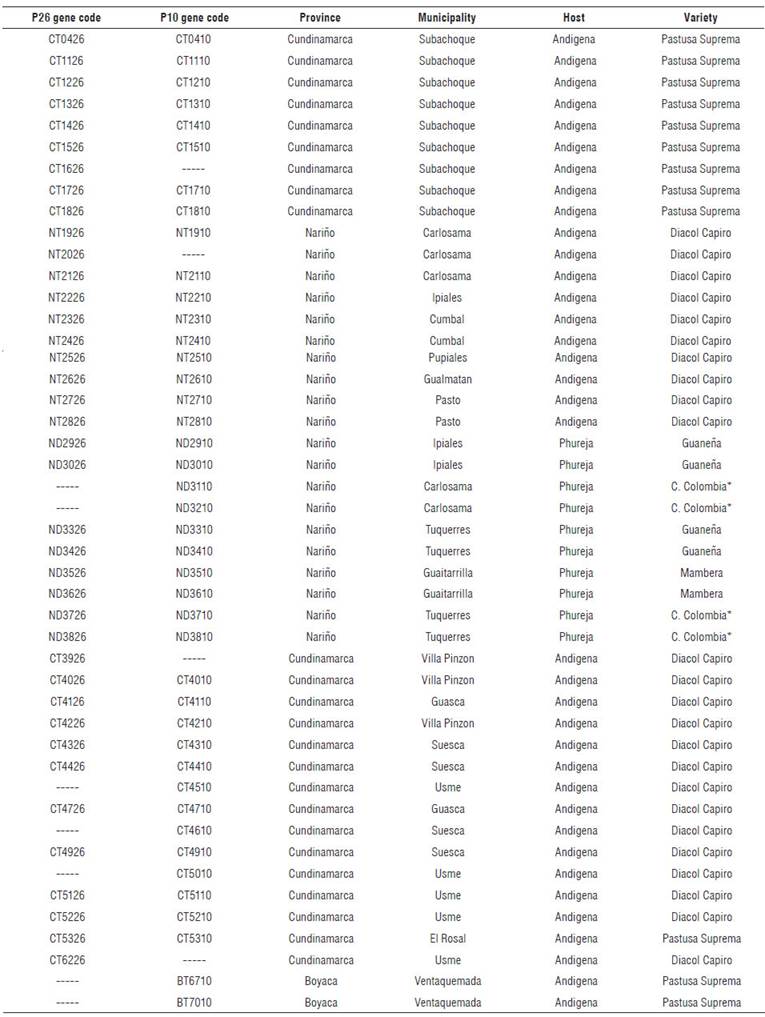
A total of 46 samples from symptomatic S. tuberosum Phureja and Andigena groups (Fig. 1), from six varieties (Tetraploids: Pastusa Suprema, Diacol Capiro, and Superior. Diploids: Criolla Colombia, Criolla Guaneña and Mambera) were sampled in eight municipalities from Nariño, six from Cundinamarca and one from Boyaca (Tab. 1).
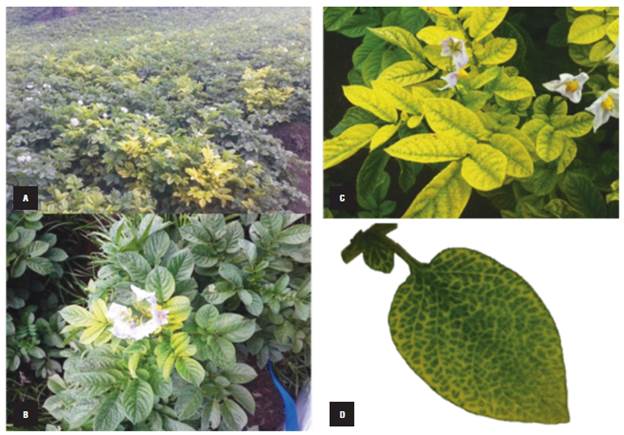
FIGURE 1 Potato plants affected by Potato Yellow Vein Disease (PYVD). The symptoms in the potato crop are observed as yellow plants distributed in foci. A) potato crop with high incidence of plants affected by PYVD, B) potato plant with initial PYVD symptoms, C) potato plant with advanced PYVD symptoms, D) detail of a potato leaf affected by PYVD.
Primer selection for amplification of P10 and P26 genes of PYVV
P26 and P10 genes were amplified during the preliminary test (Fig. 2) from samples CT0426 and NT1926 (Tab. 1) (positive to the PYVV-CP gene) through four pairs of primers (Tab. 2). We decided to select P10F and P10R primers for the P10 gene amplification and P26F gene and P26R for the P26 gene.
TABLE 2. Sequences of primers obtained for P10 and P26 genes amplification of Potato yellow vein virus (PYVV)
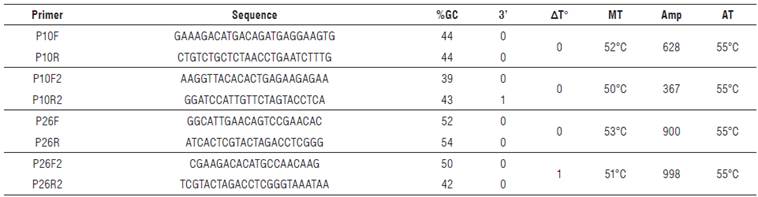
%6C: Guanine-Cytosine percentage; 3':3' complementarity; AT°: temperature delta between primers; MT: melting temperature; Amp: expected amplicon size in base pairs (bp); AT: annealing Temperature. Grey highlight: selected primer sequences for amplification of all samples.
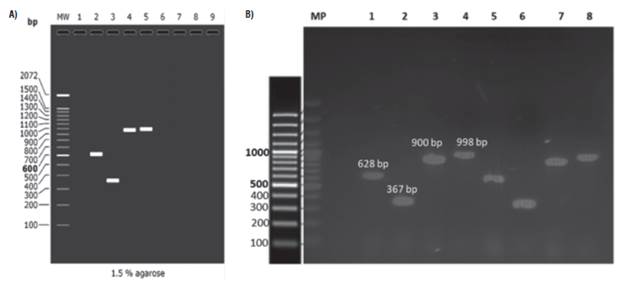
FIGURE 2 Representative amplification gel of P10 and P26 genes of Potato yellow vein virus (PYVV) by RT-PCR and amplicon migration comparison A) in silico and B) experimental amplification. A) In silico migration obtained by AmpliFx: lane 1: molecular weight marker, 2 and 3: P10 gene primers set, 4 and 5: P26 gene primers set. B) Representative experimental gel of amplification for P10 gene (Lanes 1, 2 and 5, 6) and P26 gene (lanes 3, 4 and 7, 8), CT0426 sample (lanes 1 to 4) and NT1926 sample (lanes 5 to 8).
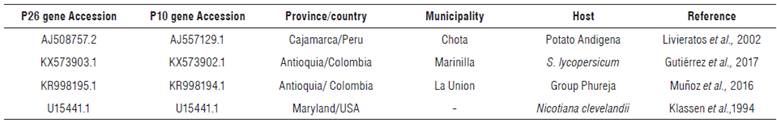
Analysis of sequences
Forty-two contig sequences of P26 gene and 45 of the P10 gene of PYVV from potato leaflets were obtained (Tab. 1). Three reference sequence accessions for P26 and P10 genes of PYVV genomes were included. The first one was obtained from the S. tuberosum Andigena group (Cajamarca, Peru) (Livieratos et al., 2002), the second one from the S. tuberosum Phureja group (Antioquia) (Muñoz et al., 2016), and the third one from tomatoes (Antioquia) (Gutiérrez et al., 2017). In addition, the sequences of the P26 and P10 genes of the Crinivirus LIYV were used as an out-group in the phylogenetic analysis (Tab. 3).
Haplotype diversity of P26 and P10 genes of PYVV and networks
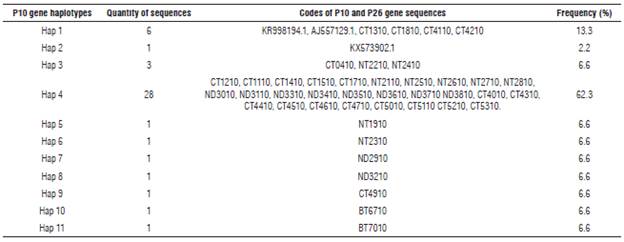
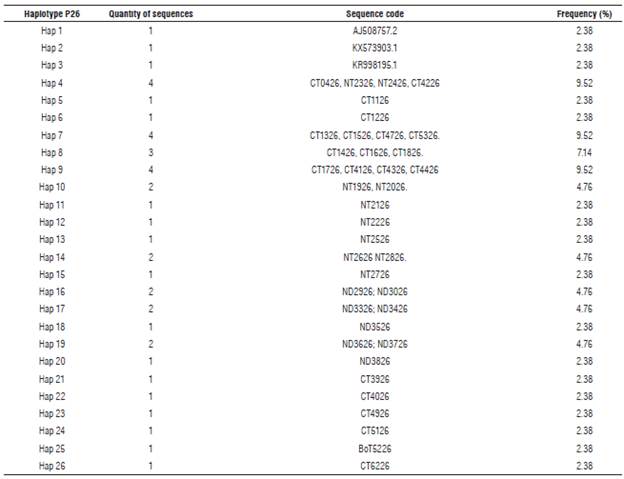
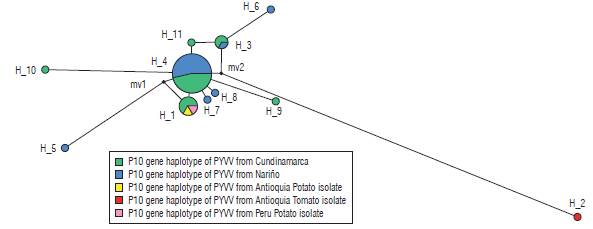
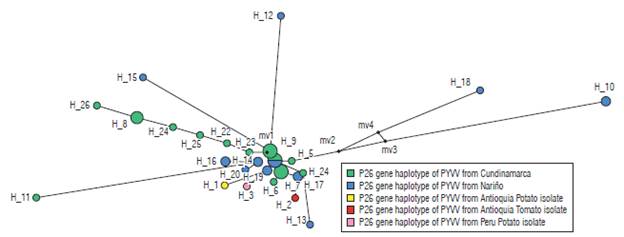
Eleven haplotypes (haplotypes 1 to 11) for the P10 gene of PYVV were obtained. These haplotypes had frequencies between 6.6% and 62.3% (Tab. 4). Haplotype 4 was the most frequently formed with 28 isolates from Cundinamarca and Nariño. This haplotype was the most ancestral, according to the haplotype network (Fig. 3). For the P26 gene of PYVV, 23 haplotypes (Haplotypes 1 to 23) were obtained with frequencies between 2.4% and 16.7% (Tab. 5) in which haplotypes 4, 7 and 9 were the most frequent and haplotype 4 was formed by four isolates from Cundinamarca and Nariño. This represents the ancestral haplotype for the P26 gene (Fig. 4), and haplotypes 7 and 9 were formed by sequences only from Cundinamarca.
Phylogenetic relationships
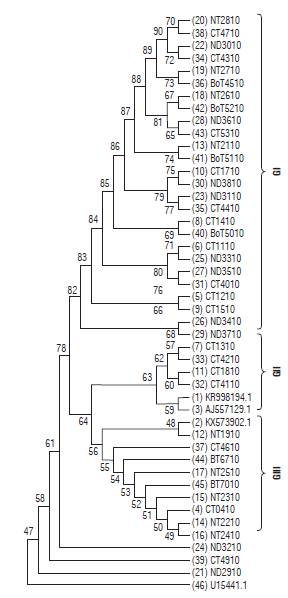
The consensus maximum likelihood tree (MLT) for the P10 gene of PYVV (Fig. 5) showed three clades; GI, GII and GIII related to the host (StA or StP). The GI clade was formed by viral sequences from StP plants. The GII and GIII clades were formed by viral sequences from StA plants. The GII was formed by sequences from Cundinamarca and Peruvian and Colombian accessions, and the GIII was formed by viral sequences from Cundinamarca and Nariño and a viral isolate accession from the tomato.
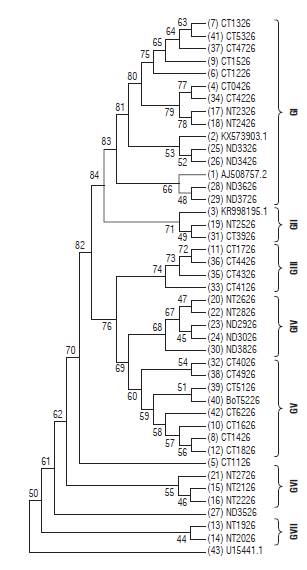
The MLT for the P26 gene of PYVV (Fig. 6) showed seven clades (GI to GVII). In contrast to the P10 gene, there is no grouping by host. Additionally, there is no specific relationship by geographical origin. Nevertheless, the viral sequences from Nariño are in groups GIV, GVI, and GVII; and the Cundinamarca sequences are in groups GIII and GV. Groups GI and GII are formed by sequences from the three provinces. The three reference accessions from PYVV-P26 gene were also in this group.
Genetic distances between sequences of the P10 and P26 genes from PYVV isolates
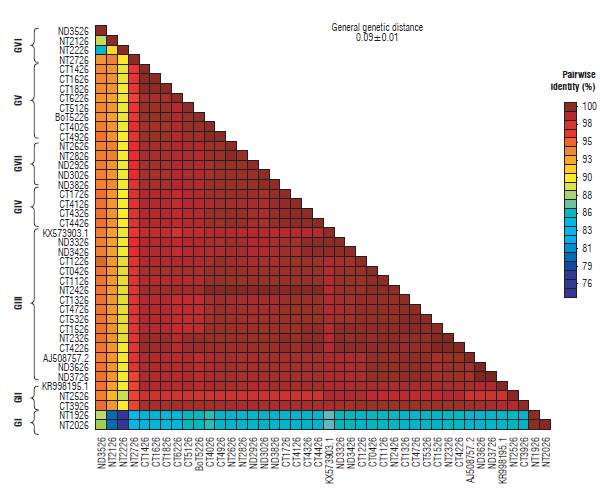
The similarity percentage for the P10 gene was between 96 and 100% except for sequences KX573902.1 and NT1910, which show a similarity of between 87 and 93% respectively. In addition, the general average of genetic distances for the complete sequences was 0.04±0.01 (Fig. 7). Similarly, the matrix for the P26 gene was between 93 and 100% except for sequences NT1926, NT2026, NT2126, NT2226, ND3526, and NT2726 with percentages of similarity between 76 and 93%. The general mean of genetic distances for this gene was 0.09 ± 0.01 (Fig. 8).
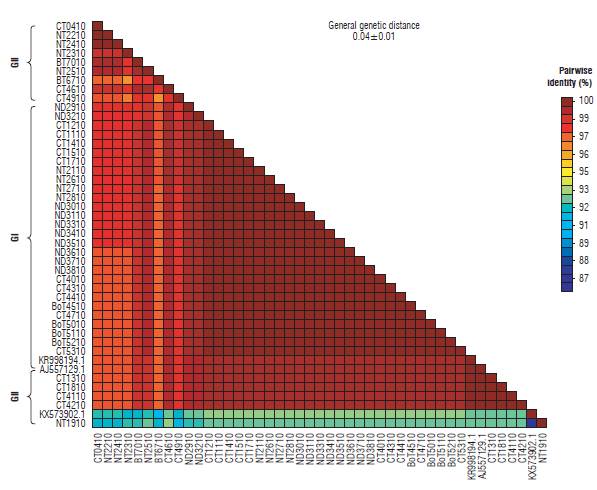
FIGURE 7 Matrix of genetic distances between sequences for the P10 gene isolates of Potato yellow vein virus (PYVV).
Variability, diversity and neutrality tests of the P10 and P26 genes of PYVV
In general, the P26 gene of PYVV showed 252 variable sites (S) from 693 total sites (36.4% variable sites in the gene), 333 total mutations (η), a nucleotide and haplotype diversity of 0.0603 and 0.97, and a rate between non-synonymous and synonymous mutations (co(dN/dS)) of 0.18. In the Tajima's D and Fu and Li tests significant negative values of -2.27 (<0.01) and -1.07 were found (Tab. 6, grey highlight).
TABLE 6 Estimated parameters of genetic variability for the P26 and P10 genes of Potato yellow vein virus (PYVV).
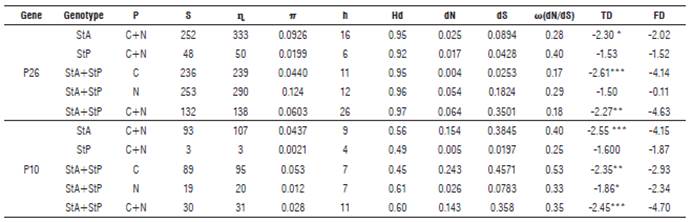
Genotype: StA: S. tuberosum Andigena group; StP: S. tuberosum Phureja group. C: Cundinamarca; N: Nariño; P: Geographical origin; S: total variable sites; η: number of total sites; π: nucleotide diversity, average of nucleotide differences per site; h: total haplotype number; Hd: haplotype diversity; dN: average number of even differences by synonymous; dS: average number of even differences by nonsynonymous sites; ω(dN/dS): dN/dS ratio; TD: Tajima's D test; FD: Fu and Li D test. *P<0.05, **P<0.01, ***P<0.001.
The P10 gene of PYVV had 30 S of 255 total sites (11.8% variable sites in the gene), 31 η, nucleotide and haplotype diversity of 0.028 and 0.60, and a rate between non-synonymous and synonymous mutations (co(dN/dS)) of 0.35. In the Tajima's D and Fu and Li tests, significant negative values of -2.45 (<0.001) and -4.70 were found (Tab. 6).
Internally in the groups generated for the P10 and P26 genes, greater variability was observed in isolates from tetraploid (StA) plants than in diploid (StP).
Discussion
RNA viruses can accumulate mutations in their genomes because their RNA-dependent RNA polymerases have weak corrective activity, unlike DNA polymerases. Consequently, some viral species can have greater genetic variability (Domingo and Holland 1997; Sanjuán et al., 2010; Sanjuán and Domingo, 2016). This makes viruses with RNA genomes more variable than those with a DNA genome. Therefore, populations of RNA viruses tend to evolve rapidly and adapt to the environmental conditions derived from the interaction with their vectors (García-Arenal and Fraile, 2001; García-Arenal and Fraile, 2011). Mutation and recombination are processes that influence genetic diversity since the first one introduces specific changes in the sequences generating new variants, and the second one is a process by which segments of different genetic variants are crossed during the replication process that allows the movement of variants to produce new haplotypes. In this sense, recombination does not create mutations but creates new combinations between pre-existing mutations (Pérez-Losada et al., 2015). The characterization of the genetic variability of viral populations supplies important information about the processes involved in the evolution of the virus and its dispersion, where epidemiology is crucial for the design of reliable diagnostic tools that allow selecting those genes that are more conserved in time and space, as well as for the development of efficient and long-lasting disease control strategies.
According to Rubio et al. (2013), the Closteroviridae family is not very variable because it is subject to negative selection, long-distance migrations, recombination processes, interaction between viral strains, and host-virus and virus-vector interaction. These are the main forces that exert pressure in the Closteroviridae, according to analyses carried out on structural genes such as CP. Moncef (2010) performed an analysis of the complete genomes for some species of genera in the Closteroviridae and reported that these viruses are subject to positive selection processes with dN/dS values ranging from 1.508 to 2.599. In addition, that author observed that only the Closterovirus (Citrus Tristeza Virus or CTV) and the Ampelovirus (Grapevine Leafroll-associated Virus 3 or GLRaV-3) are the only ones that have recombination processes; but this author did not detect any recombination processes for criniviruses.
In this study, we reported for the first time the amplification by RT-PCR and the acquirement of nucleotide sequences of the P26 and P10 genes of PYVV, from symptomatic and non-symptomatic samples of different potato varieties from Nariño, Cundinamarca, and Boyacá in Colombia for the variability study.
The haplotype analysis showed that both the P26 and P10 genes have high haplotype numbers with high diversity and low frequency (haplotype 4 with a frequency of 62.3% for the P10 gene and haplotypes 4, 7, and 9 with a frequency of 9.5% for P26 gene). Haplotype 4 for both genes corresponds to the most ancestral gene, and diversification has been generated from it in the different provinces evaluated in this study. In a study conducted by Chávez et al. (2013), 33 different haplotypes for the CP gene of PYVV were found, in which haplotype 28 was the most frequent with a value of 16.7. The most frequent haplotype groups for P10 and P26 genes of PYVV do not group sequences by host genotype or by geographic origin for the P10 gene, except for haplotypes with a single sequence. However, the P26 gene haplotypes do discriminate both by origin and genotype (except for the ancestral haplotype). This is supported by the maximum likelihood tree that shows the clades to be associated with the sequences of the specific haplotypes. This situation is not seen in the P10 gene tree, since no clear differentiation between the groups was observed by genotypes or geographical origin. This could be due to the increase in the use of vegetative seeds infected by the PYVV virus of different geographical origins, which allowed the spread of the virus in the potato-producing regions and, therefore, the distribution of variants in the geographical areas analyzed in this study. This, in turn, favors the development of new variants and recombinants when subjected to pressure in different environments. It is worth mentioning that the sequences NT1910 of the P10 gene and NT1926, NT2026, NT2126, NT2226, ND3526, NT2726 of the P26 gene showed differences between 87% and 93% for the P10 gene and 76% and 93% for P26 gene. This indicates that speciation processes are being developed in PYVV both in diploid and tetraploid plants from Nariño (Townsend, 2014; Koloniuk et al., 2018).
The Tajima's D and Fu and Li global tests showed a significant negative value for both genes, indicating that in the PYVV populations for these two genes, there was an excess of low-frequency haplotypes (rare alleles in high frequency). This low frequency could indicate that it is a population that is diversifying after a bottleneck or that there was a selection process that decreased the frequency of abundant haplotypes, increasing those that were rare at the time and that could be explained again by the flow of infected material between geographic regions. How ever, when analyzing the isolates of the StP host, negative values (but not significant) were observed for the Tajima test, indicating that this subpopulation of the PYVV was undergoing a neutral process or contraction period, or that the number of sequences obtained from StP was limited to offer enough statistical robustness.
When observing the estimated parameters of genetic variability and diversity, we can affirm that the P26 gene has a global nucleotide diversity of0.0603, but when the diversity of the hosts is observed, it can be seen that in plants of the species StA is much higher than 0.0926 compared to the global and plants of the StP species. This indicates that in this study the sequences obtained from the StA potato plants of the P26 gene provide most of the diversity. This result is repeated with the P10 gene, in which the global diversity is 0.028 and that provided by the isolates from the StA and the StP is 0.0437 and 0.0021, respectively. Similar results were obtained by Chávez-Bedoya et al. (2014), who reported the diversity of the CP, Hsp70 and CPm genes of the PYVV, which are higher for StA hosts in all cases (0.010, 0.016 and 0.046, respectively) and lower in the StP (0.008, 0.005 and 0.084, respectively) except for the CPm gene. This may occur since the StP group is diploid and the StA group is tetraploid, which implies that the virus could be subjected to higher selection pressure by having to evade the silencing machinery in a larger genome. On the other hand, it is possible to state that the nucleotide diversity is greater in the P26 gene than in the P10 gene. However, that diversity is generated by a larger number of synonymous mutations (dS) that neither affects the composition of amino acids nor the three-dimensional structure of the protein. This maintains protein function and consequently takes the populations of the PYVV to a process of negative selection. The fact that the P26 and P10 genes are more diverse than the CP, CPm, and HSP70 of the PYVV defines the functions that each one offers to the virus, since the P26 and P10 are associated with pathogenicity in Crinivirus, while those studied by Chávez-Bedoya et al. (2014) are structural genes that must be highly conserved to guarantee the correct assembly of the virion and the transmission through the vector.
This research allows the determination of the variability of the P10 and P26 genes, which is higher in isolates from the S. tuberosum Andigena group than in the Phureja group infected with PYVV. In addition, the influence of humans as a vector for the dispersion of the virus among potato producing regions in Colombia was established. This research also allows the planning of new studies aimed at evaluating the functionality of PYVV proteins P10 and P26 and the relationship of the variants to the presence or absence of symptoms in the field, the degree of severity, and the impact on the production and colonization of new hosts.

