Introduction
Although the area planted with cape gooseberry in Colombia increased in the period between 2010 and 2016, from 745 to 1,023 ha, the yield was reduced from 13.8 to 12.5 t ha-1 (Agronet, 2019), which constitutes a decrease of 9.4%. This can be probably caused by an increase in cracked fruits (Gordillo et al, 2004) and by other aspects, such as inadequate fertilization and disease management plans; the lowest yield was in 2013 with 9.8 t ha-1 (Agronet, 2019). In addition, cape gooseberry crops have been greatly impacted by adverse weather conditions, including the irregular supply of water by rainfall (Villareal-Navarrete et al, 2017; Aparecido et al., 2019).
One of the restrictions presented by the export of cape gooseberry fruits is the cracking problem, which causes the product to reach its destination with the presence of fungi and results in rejection of the fruits and consequent economic losses. The cracking of fruits results from mainly two causes: the first may be a poor and irregular supply of water to the crop with excessive enlargement of the fruits (e.g. through high water and nutrient supply) in the last developmental stage beyond what the tissue can support (Fischer, 2005), and the second occurs with deficiencies of calcium, which is probably associated with morphogenetic reasons that cause cape gooseberry fruits to not absorb the amounts of calcium needed to provide resistance in the cell walls and, thus, avoid cracking (Alvarez-Herrera et al., 2012).
At the field level, irrigation coefficients of 1.2 (120% of evaporation) increased the yield of fruits per plant in the plot in which Ca was added, compared with the application of a smaller amount of water (Gordillo et al., 2004). However, in a greenhouse with an application of a net irrigation coefficient of 1.3 and 100 kg ha-1 of Ca, the percentage of cracked fruits decreased, but the fruit production was lower (Álvarez-Herrera et al, 2012).
The water potential reveals the moment of maximum water requirements by a plant in a day or a crop cycle and determines the water potential of the soil when measurements are taken at predawn. It also facilitates irrigation scheduling, which results in better control of water stress at certain times of the day or at times when the temperature increases considerably (Cole and Pagay, 2015). In this regard, Taiz and Zeiger (2010) stated that, among the resources required by a plant for its growth, development, and physiology, water is the largest in terms of amount, and so is the aggravating factor that can be the most limiting, which accentuates the importance of irrigation and its key role in the production of crops. It is also known that the water status of a plant, combined with climatic conditions, regulates the rate of transpiration, which plays an important role in the absorption and mobility of calcium (Marschner, 2012).
Because irrigation and nutrition management with calcium greatly influence the obtention of good quality fruits (Álvarez-Herrera et al., 2014) and recent research recommends different irrigation doses, depending on whether quality (not cracked fruits) or quantity (large fruits) is desired (Álvarez-Herrera et al., 2015), it is necessary to know the water status of a plant under different irrigation regimes, for which, the determination of the water potential acquires great importance. Therefore, this research aimed to determine the water potential of cape gooseberry plants subjected to different irrigation regimes and calcium doses.
Materials and methods
Location of the experiment
The experiment was carried out in a greenhouse with a plastic cover at the Faculty of Agricultural Sciences, Universidad Nacional de Colombia, Bogota campus, at an altitude of 2,556 m a.s.l. and with coordinates 4°38'7" N and 74°5'20" W. The average greenhouse temperature was 18°C and the relative humidity was 60%.
Experimental design
A randomized complete block design was used with 12 treatments. The blocking criterion was the irrigation frequencies (4, 9 and 14 d). The treatments were in a 4x3 factorial arrangement, in which the first factor corresponded to the applied irrigation coefficients (0.7, 1.0, 1.3 and 1.6 of evaporation of the evaporimeter tank), and the second factor was the calcium doses (0, 50 and 100 kg ha-1), which generated 36 experimental units (EU). Each EU was composed of two cape gooseberry plants, for a total of 72 plants, which were planted in 20 L pots, 80 cm in diameter and 50 cm deep. Peat moss was used as a substrate.
Setup of the experiment
The plant material used was Physalis peruviana L., ecotype Colombia, because it is the most desired on the international markets due to its high content of sugars and vitamins (Fischer, 2000). The cape gooseberry seeds were planted in plastic trays with 72 cells, which germinated after 45 d and remained in the trays for 4 months from the time of sowing until they reached an average height of 25 cm.
The plants were planted at a distance of 2 m between plants and rows, and traditional cultural activities (phytosanitary management, pruning, trellis, and harvesting) of commercial crops in the producing areas were carried out. The high V trellis system was used. Edaphic and foliar fertilization were carried out based on the requirements of the crop and considering the fact that peat provides nutrients for a short period of time. The doses used in kg ha-1 were N: 150; P2O5: 220; K2O: 150; MgO: 60; S: 40 B: 1; Zn: 3; Cu: 2; and Mn: 0.5 fractionated from the time of planting, first in two quarterly applications and then three bi-monthly applications, and monthly foliar applications.
For the application of the irrigation levels, a drip irrigation system was used (two drippers per plant with a flow rate of 4 L h-1, each). Once the plants were planted, the different doses of calcium were applied in the substrate around the plants, distributed monthly with a class A evaporimeter tank built on a scale of 1:1 and installed inside the greenhouse in order to establish the amount of water applied according to the equation for calculating the consumptive use, which takes into account the potential evapotranspiration. The data measured in the evaporimeter inside the greenhouse were correlated with the data from the type A evaporation tank at the climatological station of the IDEAM (regional main category 6 and code 2403513) to validate the latter and extrapolate the date for open field conditions (Eq. 1).
where,
Etp = evapotranspiration in mm measured in the evaporimeter tank.
C = multiplication coefficient according to treatments.
A = area of the pot (254.4 cm2).
ηr = efficiency of drip irrigation (0.9).
The irrigation water-use efficiency (WUEi, %) was calculated from the dry biomass of the leaves divided by the total water applied in each treatment.
The leaf and stem water potentials were determined in the plants during the reproductive phase, beginning at 30 d in the vegetative phase, following the treatments with determinations every 4 h (8 am, 12 pm, 4 pm, 8 pm, 12 am, and 4 am (at predawn) using a Scholander pump (Model 615, PMS Instrument Company, Albany, OR, USA). For the determination of the leaf water potential (ψ leaf ), a leaf from the tertiary branch of each plant was taken, which was bagged in a plastic bag covered with aluminum foil for 15 min, taken out and placed in a pressure chamber to determine the potential. For the determination of the stem water potential (ψ stem ), a leaf of the tertiary branch was pocketed for 3 h and inserted into a chamber; the measurement was taken according to the methodology followed by Nortes et aI. (2005).
The instantaneous measurement of the temperature (T) and relative humidity (RH) of the air were recorded with an Extech RHT20 Datalogger (Extech Instruments, Waltham, MA, USA). With these data, the calculation of the vapor pressure deficit (VDP), given in kPa, was performed using the equation used by Murray (1967):
Data analysis
An analysis of variance (ANOVA) was performed for a completely randomized block design in order to determine if there were significant differences between the irrigation frequencies (blocks) and between the treatments (water level by calcium doses) for each of the measured response variables. In addition, a Tukey comparison test of averages was used at 5% to classify each of the levels of the evaluated factors. The VDP measurements calculated for the hours of measurement of the water potential were correlated with the stem and leaf water potential. The software SAS (version 9.2) was used for the data analysis.
Results and discussion
Leaf water potential (ψ leaf )
When analyzing the behavior of the ψ leaf in the cape gooseberry plants, circadian rhythm was observed (Fig. 1A), similar to what was found in persimmon (Diospyros kaki L. f.) by Griñan et al. (2019). There were only significant differences between the evaluated irrigation levels at 8 pm. Likewise, it was noted that, when the amount of water applied increased, the ψ leaf was higher than 0.1 MPa approx. on average throughout the different measurements throughout the day. This result coincides with that reported by Singh and Singh (2006), who found that increases in water stress caused a reduction in ψ leaf at predawn in Dalbergia sissoo Roxb., which varied from 0.4 to 1.16 MPa. The same authors pointed out that the higher the photosynthetic rate, the greater the water potential (ψ), which implies that well-watered plants will have normal development and an adequate ψ leaf .
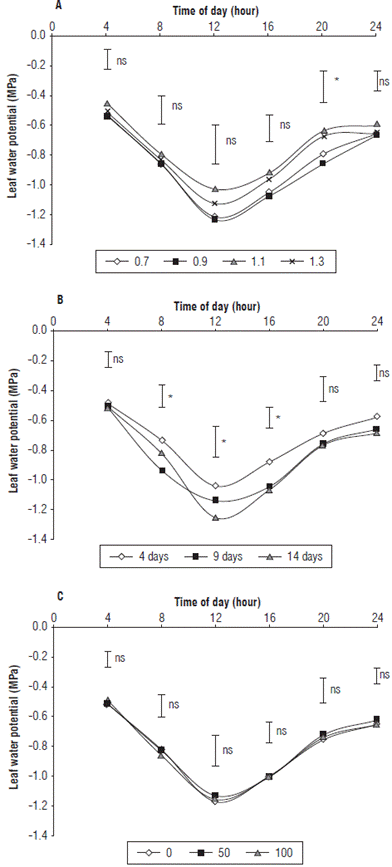
FIGURE 1 Leaf water potential in cape gooseberry plants planted in peat moss in greenhouses and subjected to A) different irrigation levels; B) irrigation frequencies and C) calcium doses in kg ha-1. The bars indicate minimal significant difference according to the Tukey test (P≤0.05). ns: not significant. *: indicates significant effect with P≤0.05.
The ψ leaf showed significant differences between the different irrigation frequencies applied only at certain hours of the day (morning, 8 am, noon, and in the afternoon, 4 pm, Fig. 1B), while in the hours without sunlight (predawn, 4 am, night, 8 pm, and 12 pm), the water status of the plant was homogeneous regardless of the frequency of irrigation. This indicates that the effect of the treatments on the ψ leaf increased when the plants received sunlight, which is in agreement with what is reported by Girona et al. (2006), who found that, in hazelnut, the daily variation of the leaf water potential is more related to the climate components, especially to solar radiation, than to the water potential of the soil. Likewise, Sousa et al. (2006) mentioned that the ψ leaf of grape plants at night has a high correlation with the water potential in the soil. The ψ leaf in the cape gooseberry plants showed values of -0.51; -0.84; -1.15; -1.01; -0.74 and -0.65 MPa for the different hours (4 am, 8 am, noon, 4 pm, 8 pm and midnight, respectively), with the maximum differences between treatments at noon.
The irrigation frequency of 4 d presented the highest values of 'leap followed by irrigation every 9 and 14 d, probably because, as the water stress is greater, the ψ leaf decreases in cape gooseberry plants. Similarly, Zhu et al. (2004) determined that the ψ leaf in apple trees decreased as the water stress increased and mentioned that the concentration of cytokinins at the leaf level also decreased as a result of the lower activity of this hormone in the root zone, which implies delays in processes such as cell division. Also, Kitsaki and Drossopoulos (2005) stated that, as the ψ leaf becomes more negative, the higher the ABA content is. Therefore, it can be inferred that the ψ leaf is a reliable measure of the level of stress to which a plant is subjected (Girona et al., 2006). In addition, in grapes, the growth rate of the shoots and the net assimilation of CO2 had greater correlation with the ψ leaf at noon than with the ψ leaf at predawn (Baeza et al., 2007).
Jaimez et al. (1999) stated that, in areas with high evaporative demand, plants have a loss of turgor that is related to low values of water potential. In addition, if the frequency of irrigation affects the water potential, the plant likely has difficulties with osmotic adjustment under stress conditions and, below values of -1.6 to -1.8 MPa, the stomatal conductance decreases and, consequently, the photosynthetic rates decrease. Similarly, Marsal and Girona (1997) evaluated the leaf water potential in peach trees and mentioned that values below -3 MPa severely affect plants. They also stated that, in full fruit growth, the sink effect is likely to generate greater water mobilization towards the fruit and decrease the amount of water in the leaves.
Regarding the effect of the different doses of calcium applied to the cape gooseberry plants, they did not affect the t ψ leaf , as shown in figure 1C. Although increasing the application of Ca2+ increased [Ca2+] in the leaves (unpublished data), there was no effect on the ψ leaf , probably because changes in the ψ leaf are strongly influenced by environmental conditions, especially by a vapor pressure deficit (VPD) (Singh and Singh, 2006).
Stem water potential (ψ leaf )
This potential had a behavior very similar to that of the ψ leaf with the ψ leaf greater at predawn (4 am) and at night (Fig. 2). However, between 8 am and 4 pm, lower values were reached, and, at midday, the minimum averaged -0.97 MPa. These values match those found for citrus at the same time, from -0.6 to -1.3 MPa (García-Tejero et al., 2010), and those defined by De Swaef et al. (2009) for most fruit trees, between -0.5 and -1.5 MPa.
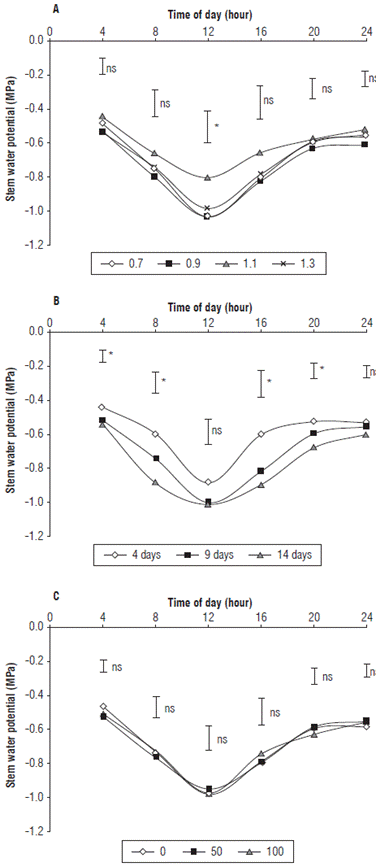
FIGURE 2 Stem water potential in cape gooseberry plants planted in peat moss in greenhouses and subjected to A) different irrigation levels; B) irrigation frequencies and C) calcium doses in kg ha-1. The bars indicate minimal significant difference according to the Tukey test (P≤0.05). ns: not significant. *: indicates significant effect with P≤0.05.
The ψ stem showed significant differences between the irrigation levels only in the measurements taken at noon (Fig. 2A). The irrigation level that presented the highest ψ stem values had a coefficient of 1.1, both at midday and at other times of the day, while the levels of 0.7, 0.9 and 1.3 throughout the day presented the lowest ψ stem values. It is likely that the amount with a coefficient of 1.3 caused a temporary root hypoxia effect that affected the potential value. The ψ stem values at predawn oscillated on average around -0.50 MPa, which are similar to the oscillations found by Nortes et al. (2005) in almond trees with average values of -0.4 MPa. These results are also in agreement with that found by Navarro et al. (2007), who stated that, in plants subjected to stress, the ψ stem at predawn and noon was less than in the control plants, which reflected the hydraulic signals that the roots send to the shoots. These authors also confirmed that, under stress conditions, maintaining the turgor pressure at the cellular level implies an osmotic adjustment and probable changes in the elasticity of the cell wall in such a way that a decrease in the ψ stem results. Likewise, measuring the ψ stem directly reflects the water status of the plant since it maintains a strong relationship with the flow in the vascular bundles, which highlights the importance of determining the ψ stem (García-Tejero et al., 2010).
The irrigation frequency generated significant differences in the ψ stem at predawn, but not at midday (Fig. 2B). This can be explained because ψ stem is a measurement that correlates very well with ψ soil , according to Sousa et al. (2006). Therefore, measuring ψ stem at predawn would indicate the moisture content of the substrate, while the ψ stem at midday has a strong correlation with the environmental conditions that are indicative of the evaporative demand (De Swaef et al., 2009). However, in wheat, Sato et al. (2006) found no correlation between the ψ stem at predawn and the ψ soil which could have originated from the moisture retention capacity of the soils, the ability of the plants to absorb water, the species, the growth status, and the environmental conditions.
In this regard, the values of both ψ stem and ψ leaf were lower at noon because, as the transpiration increases and the pressure decreases in the xylem, the cells begin to dehydrate, so it is common to find pressures of between -1 to -2 MPa (Boyer, 1995). This decrease was observed in the ψ stem of the cape gooseberry plants because stress generates problems in the development and growth of plants since it affects processes such as photosynthesis. Under stress conditions, the first defense mechanism in response to a water deficit is the partial closure of the stomata, which restricts the intake of CO2 (De Pauw et al., 2008), affecting the growth of fruits as well as other quality parameters (Álvarez-Herrera et al, 2015). In addition, Moriana et al. (2012) found that, in olive trees under stress conditions, the ψ stem at noon reached -2.0 MPa and that, when the plants had an isohydric response to drought conditions, stomatal control prevented dehydration and potential values were not affected. However, when the response was anisohydric, the plant water potential was more sensitive to water stress.
On the other hand, when analyzing the effect of the doses of calcium applied to the cape gooseberry plants, they did not show significant differences in the behavior of the ψ stem for any of the hours of the day (Fig. 2C), as happened with the ψ leaf , and showed a pattern of variation that described the ψ stem of the plants throughout the day. As with the ψ leaf it is likely that this measurement, being strongly influenced by climate, was not altered by the calcium fertilization. In contrast, Li et al. (2003) found that, when external Ca2+ applications were performed directly on the foliage, there was an increase in tolerance to drought and a decreased water potential because this element influenced the mitigation of oxidative stress by decreasing the activity of catalase, superoxide dismutase, and polyphenol oxidase.
Comparison between leaf and stem water potential and relationship with VPD
Figure 3 shows the average behavior throughout the day of the ψ leaf and ψ stem of the cape gooseberry plants. The ψ stem was lower than the ψ leaf with significant differences during all hours of the day except for predawn (4 am), where the values were -0.50 and -0.51 MPa for ψ stem and ψ leaf , respectively. This is consistent with the findings of Vélez et al. (2007), who mentioned that, in citrus, the measurement of ψ stem and ψ leaf at predawn, in treatments with an irrigation deficit and with an adequate water supply, had similar values. This suggests that, to have better control of the imposed water deficit, it is necessary to measure the daily variation of the stem. The equilibrium behavior between the observed potentials implies that at predawn, the water status was uniform throughout the whole plant, and the environmental conditions had a minimal influence, which in turn reflected the water potential of the substrate used according to the findings of Nortes et al. (2005). In addition, it could be suggested that this measurement would have a greater correlation in substrates than in clayey soils because of strong moisture retention that would limit the effect of deficit irrigation treatments, as expressed by Sato et al. (2006).
During the rest of the day, the differences between the measured potentials, probably, occurred as a result of the longer bagging time (3 h) for the measurement of the ψ stem . This process limits the influence of environmental conditions (temperature and radiation) and decreases the photosynthesis of the bagged leaf, creating a continuum between the stem and the leaf (Boyer, 1995). As a result, values that are lower than those recorded in the leaf are obtained. The bagging time (15 min) only decreased the temperature and the effects of solar radiation but did not generate a continuous equilibrium in the vascular system, as reflected in the differences of the potentials at different times of day with the exception of the measurement at predawn. Likewise, the greatest difference between the potentials was measured at noon, with which it can be inferred that this is the time when the environmental conditions affected the potential the most. For this reason, for cape gooseberry plants, the measurement of this parameter at midday would be a good indicator of maximum water stress because of the high sensitivity that it presents, similar to that found by Nortes et al. (2005).
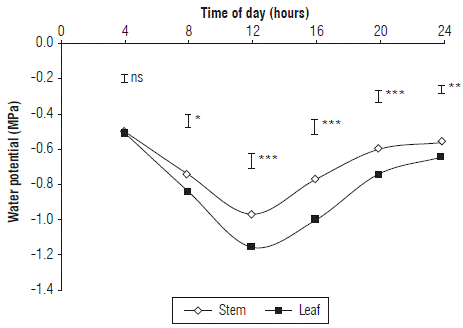
FIGURE 3 Leaf and stem water potential in cape gooseberry plants planted in peat moss in greenhouses. Bars indicate minimal significant difference according to the Tukey test (P≤0.05). ns: not significant. *: indicates significant effect with P≤0.05.
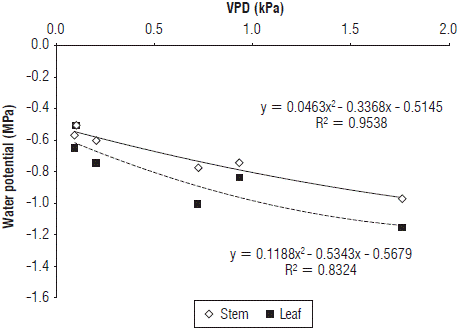
Because of the fact that the ψ stem and ψ leaf have been related to the environmental conditions, a relationship between these parameters of the water status of plants with the VPD was expressed, which has shown to have a strong correlation with the ψ in plum trees (Intrigliolo and Castel, 2006) and almonds (Nortes et al., 2005). Figure 4 shows that, as the VPD increased, both the ψstem and ψ leaf decreased towards more negative values, and the VPD explained this decrease with a correlation of 95.3% and 83.2%, respectively. This behavior is similar to that reported by different researchers for plum (Intrigliolo and Castel, 2006), rose (Urban and Langelez, 2003) and Dalbergia sissoo Roxb. (Singh and Singh, 2006), who found that the highest values of HVf were due to the lower values of VPD. Likewise, the relationship between the measured potentials and the VPD presented a polynomial trend. In this regard, Hogg and Hurdle (1997) stated that the relationship between the water potential and the VPD is not linear because stomatal closure is gradual as the VPD increases and stabilizes as a necessary response to keep the water potential high enough and avoid damage to the plant. However, Intrigliolo and Castel (2006) observed linear relationships in plums, and Sato et al. (2006) found a linear relationship between measurements at predawn of the water potential and the VPD, explained by night perspiration. Likewise, De la Rosa et al. (2013) stated that, in peaches, the ψstem at noon had a better correlation with the average temperature and with the VPD than with other climatic variables. However, they suggested that, to automate the measurements of the water status of plants, measurements of the maximum daily trunk contraction at noon would be a reliable alternative, similar to measuring the ψstem (Intrigliolo and Castel, 2005; Vélez et al., 2007) or stomatal conductance, which has an inversely proportional relationship with to ψstem in forest species (Hogg et al., 2000).
Water consumption and irrigation water-use efficiency (WUEi)
Table 1 shows the amount of water applied during the treatment phase to the cape gooseberry plants. The plants that received the most water corresponded to the treatment of 1.3 with an irrigation frequency of 9 d, while the lower application of water corresponded to the irrigation frequency of 4 d with a coefficient of 0.7. The daily water consumption varied from 1.4 to 2.8 L/plant-d (Tab. 2) for the treatments with an irrigation frequency of 4 d with a coefficient of 0.7 and an irrigation frequency of 9 d with a coefficient of 1.3, respectively, which reflects the fact that the variation in the irrigation regimes used reached 100%.
TABLE 1 Total application of water (L) in cape gooseberry plants throughout the production period (6 months).

The WUEi did not show significant differences for the irrigation level interaction with the calcium dose (P=0.8946), nor for the irrigation frequency (P=0.6402). However, there were differences when analyzing the effect separately from the irrigation level factor (P=0.0357*). The coefficient that showed the highest WUEi was 0.7, which was 30%, 39%, and 50% higher than in the irrigation levels of 1.1; 0.9 and 1.3, respectively. Thus, it can be stated that the less water applied to cape gooseberry plants, the greater the efficiency in the production of biomass and the lower the water potential (Tab. 3), as reported in cucumber (Rahil and Qanadillo, 2015) and tomato (Zotarelli et al., 2009; Savic et al., 2011). These authors mentioned that the treatments with higher WUEi had more daily applications of water with more frequent irrigations and that a higher number of applications saw less water loss by infiltration. In addition, Intrigliolo and Castel (2010) confirmed that, in plums in the first season, the irrigation deficit generated a higher WUEi. However, for the second and third seasons, the treatments began to decrease the WUEi, as a product of the wastage of the plant subjected to permanent stress. In parallel, Fischer and Lüdders (1999) found that the WUEi in cape gooseberry plants is affected by the temperature of the root zone and that, when the soil temperature approaches 30°C, the WUEi is higher than when the plants are planted in root zones of 22 and 14°C.
TABLE 3 Effect of the irrigation coefficient, the calcium dose and the frequency of irrigation on the irrigation water-use efficiency (WUEi) in cape gooseberry plants.
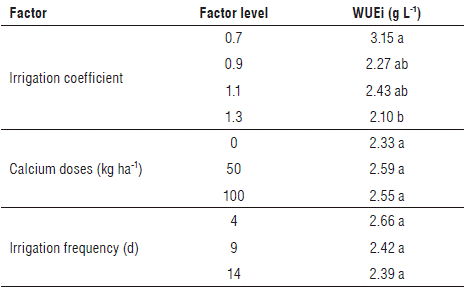
Average values with different letters in the same column and classified by factor indicate significant statistical differences according to the Tukey test (P≤0.05).
Because the irrigation level of 1.1 had the second largest WUEi and generated the largest number of large fruits and the highest production (Alvarez-Herrera et al., 2015), it can be stated that this is the suitable irrigation coefficient for the production of cape gooseberry since an irrigation level of 0.7 had a higher WUEi, but lower production with smaller fruits, as found in olive trees by Miranda et al. (2018).
Likewise, in spite of the water deficit, the cape gooseberry fruits had a higher amount of total soluble solids and lower total titratable acids, similar to those found in plums (Intrigliolo and Castel, 2010) and tomatoes (Savic et al, 2011).
Conclusions
The ψ leaf and ψ stem in the cape gooseberry plants presented a behavior similar to a circadian rhythm. The irrigation frequency of 4 d with an irrigation level of 1.1 showed the highest values of and The and y stem reached the highest values at predawn (4 am). The application of irrigation levels lower than the ETc produced water stress in the plants and led to crop wilting. The irrigation coefficient of 0.7 presented the highest WUEi; however, the plants in this treatment showed strong symptoms of water stress and lower values of ψ leaf and ψ stem .


