


 English (pdf)
 Article in xml format
 Article references
 Send this article by e-mail
 Cited by SciELO
  Cited by Google
  Similars in
SciELO
Similars in
SciELO  Similars in Google
 Permalink
Introduction
The correlation between traits is of paramount importance for breeding programs, especially for the selection of superior genotypes. Therefore, for traits that are difficult to measure or have low heritability, indirect selection uses an easily measurable trait with moderate to high heritability, thus allowing the breeder to obtain faster progress compared to direct selection using a difficult trait. Cruz et al. (2012) state that associations can generate indirect gains when the studied traits show a genetic correlation, especially on truncated selection of low heritability traits, which may increase selection efficiency.
It is known that the popping expansion (PE) can be genetically correlated with other grain characteristics such as kernel size, length, width and mass (Cabral et al, 2016; Ribeiro et al, 2016). However, these results vary since other authors report a positive correlation or a lack of linear correlation between the main kernel characteristics of popcorn, as described by Carpentieri-Pípolo et al. (2002) and Daros et al. (2004). Soylu and Tekkanat (2006) reported a significant and not significant positive correlation between PE and kernel size and PE and mass of 1000 grains, respectively.
In the literature, several studies on the association between traits show that the concomitant use of path analysis and Bayesian networks may generate accurate information for genetic improvement of popcorn (Felipe et al., 2015; Amaral et al., 2019). Path analysis is the unfolding of the correlation coefficient that informs not only the magnitude of the correlation values but also allows obtaining the cause and effect information of the correlation between two variables and how many other variables may influence this correlation (Cruz et al, 2012).
Bayesian networks (BN) are an alternative modeling approach, in which criteria are applied for selection models. In turn, it is important in the graphical representation of the causality relations between the system variables (Marques and Dutra, 2002), revealing information on the relationship of conditional dependence, which is represented by the joint distribution of a set of variables. In addition, it is an intuitive way to understand the direct and indirect relationships between variables (Felipe et al., 2015). The Directed Acyclic Graph (DAG) is the graphical representation produced by this probabilistic graphical model that represents a set of random variables and their conditional dependencies, connected directly by arrows (Margaritis, 2003).
The main advantage of the BN is that the modeling involves searching for a structure that is compatible with the joint distribution of the data, and the conditional dependence brought by the BN structure allows generating the most parsimonious representation of the dataset joint distribution (Amaral et al., 2019). This feature makes this model interesting for the purpose of predicting and selecting variables for genetic improvement.
It is known that the greatest expansion capacity is a desired trait in the commercial production of popcorn and that this capacity depends on factors, such as grain size, grain flake size and grain mass, among others, as well as chemical properties (Cabral et al., 2016). Furthermore, the evaluation and measurement methods are not clearly addressed in the literature. Thus, the objective of this work was to evaluate the cause and effect relationship between expansion capacity, weight, and grain size in popcorn hybrids using path analysis and Bayesian network.
Materials and methods
A total of 185 S3 inbred lines of popcorn were obtained from nine populations from different origins. The lines were separated by similar agronomic traits and within each population. The seeds of the lines were mixed in the same proportion to build up the population of origin, thus, obtaining nine synthetic populations. In the 2013/2014 crop, the synthetic populations were sown in Jaboticabal, São Paulo, Brazil (2°15'17"S, 48°19'20"W, and 605 m a.s.l.) The climates in both places are classified as tropical Aw according to the Koppen classification, with 60 mm average rainfall in the driest month and average temperature of 18°C in the coldest month of the year. The average temperature in the rainy season is 29°C. The soils are classified as Eutrophic Red Latosol and Dystrophic Red Latosol, respectively (Embrapa, 2006) and crossed in a complete diallel scheme by manual pollination. The progenies (diallel hybrids) were harvested, hand-milled, and part of the seeds was packed in a dry chamber, while another part was sown on the same site in the 2014/2015 crop.
The randomized block experiment consisted of 41 diallel hybrids with two replicates, in plots of two 5 m lines, spaced 0.8 m between rows and 0.2 m between plants. Crop management followed the requirements of the culture (Cruz, 2010). All ears in the plot were manually harvested at physiological maturity. After harvesting, all ears were threshed manually and kept in tagged paper bags in a dry chamber.
From each replicate, three 50-grain samples were prepared and further used to evaluate the traits studied in this work.
The work was divided into two steps. The first step consisted in estimating the traits for each 50-grain samples as follows: grain length (GL), defined as the distance between the tip and the base of the grain; grain width (GW), the distance from end to end of the widest part of kernel; grain thickness (GT), the distance between the two faces of the kernel, as proposed by Pordesimo et al. (1990), and caryopsis roundness index (CRI), the relationship between GL, GW and GT using the following equation proposed by Mohsenin (1970).
CRI = (GL x GW x GT)1/3 (1)
The traits GL, GW, and GT were measured with a digital caliper and expressed as millimeters. The second step consisted of estimating the traits for the complete 50-grain sample as follows: mass of 50 grains (MG) (considering a grain moisture content of 13%), measured using a precision scale and expressed as grams and popping expansion (PE), evaluated using a microwave (Brastemp®, 30 L, 0.8 KW/h, 800 W, 127 V, 30 x 53.9 x 42 cm, 16 kg). The grains were placed in paper bags and two repetitions per each genotype were used to subject the samples to the same popping time (2 min and 30 sec). PE was given by the ratio between flake volume (ml) and its sample mass (g) and expressed in ml g-1. The flake volume (VOL) was determined using a graduated 1000 ml cylinder, and homogenized by inverting the cylinder once, whereas flake size (FS) was given by the ratio between VOL and the number of popped kernels in the sample. VOL and FS were used only in the Bayesian network analysis.
The phenotypic (rf), genotypic (rg) and environm ental (ra) correlations were estimated using the following expressions:
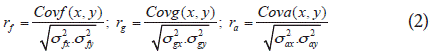
where: Covf(x,y), Covg(x,y), and Cova(x,y) are, respectively, the phenotypic, genotypic and environmental correlations between the x and y varia bles; rf, rg and ra are the phenotyp-ic, genotypic, and environmental variances, respectively. The significance of coefficient b was evaluated by the F test and the correlation coefficient was analyzed by the t-test.
A multicollinearity test was performed between the variables and, according to this criterion, VOL and FS were removed from the database. Then, the rf matrix was used for unfolding the correlation coefficient into cause and effect studies of kernel traits on grain expansion capacity determined by the phenotypic path analysis (FPA). The correlation and path analyses were performed using the Genes software (Cruz, 2013).
As a complement, a graphical analysis (Directed Acyclic Graph) was performed using Bayesian networks (BN).
The BN is a graphical representation of a probability distribution over a set of variables (Felipe et al., 2015). The Directed Acyclic Graph (DAG) represents the BN using nodes connected by arrows, and is used as an output to the modeling approach. In this case, it is used to illustrate the association between traits. This graph characterizes a joint probability of the data, which brings scale benefits due to the factorization (Aliferis et al., 2010). In a set of variables {X1, X2, …, Xp} with joint distribution Pr(X1, X2, …, Xp)
and a DAG D that is compatible with this joint distribution (Pearl, 2000), the following factorization can be performed:

where: Pai are the parents of Xi in D.
The BN analysis involves searching for a structure that is compatible with the joint distribution of the data. The selected structure has already been used as a prediction tool, as described by Felipe et al. (2015). In this study, the BN was only used in the context of traits association.
For the present work, the Hill-Climbing algorithm ("search and score" approach) was used to construct the BN from the means of each plot. The model was adjusted using the package "bnlearn" of the R software (Scutari, 2009).
Results and discussion
The majority of phenotypic (rf), genotypic (rg) and environmental (ra) correlation coefficients were significant (Tab. 1). Regarding the genetic correlation, six had a positive and significant rg (0.59, 0.62, 0.44, 0.84, 0.57, 0.33 to GL x GW, GL x MG, GW x GT, GW x MG, GT x MG and CRI x PE, respectively). Also, five had negative and significant rg (-0.72, -0.43, -0.49, -0.48, -0.39 to GW x CRI, GW x PE, GT x PE, CRI x MG and MG x PE, respectively). A positive correlation indicates that as one trait increases, the other trait also increases and that selection aiming at gain on one trait may reflect on the other trait (Vencovsky and Barriga, 1992). In addition, five genetic correlations had higher values than the environmental correlation, indicating that the observed linear association between these pairs of traits is little influenced by the environmental factors.
TABLE 1 Phenotypic (rf), genotypic (rg) and environmental (ra) correlations between six grain traits of 41 diallel popcorn hybrids.
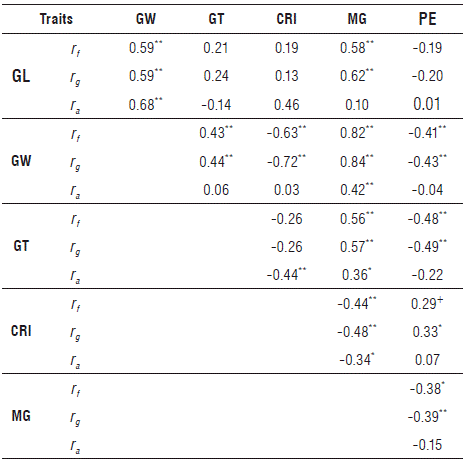
*, **: significant at 5 and 1% by t-test; PE: popping expansion; GL: grain length; GW: grain width; GT: grain thickness; CRI: caryopsis roundness index; MG: mass of 50 grains.
On the other hand, of the significant 11 rg values, six (GL x GW, GW x CRI, GW x PE, GT x PE, CRI x MG and MG x PE) had environmental correlations higher than the respective genetic correlations. According to Vencovsky and Barriga (1992), environmental correlations occur when the same variation of environmental conditions affects two distinct traits, in which negative and positive values indicate that the environment favored one trait to the detriment of another or harmed both due to the same causes of environmental variations.
Several authors point out the importance of the correlations between traits of popcorn hybrids (Soylu and Tekkanat, 2006; Cabral et al., 2016) especially regarding the degree of genetic and environmental association between the main commercial attributes of the crop. This is important because genetic correlations are inheritable and, therefore, can be used in breeding programs in the direct or indirect selection of superior genotypes. In addition, information on the correlations between grain traits may increase the accuracy of genotype selection in breeding programs, especially regarding popping expansion.
The highest significant rf estimates were calculated for GW and MG (0.82) and GW and CRI (-0.63), although the second one is a negative correlation. Among the rg estimates, the highest was also observed for GW and MG (0.84) and for GW and CRI (-0.72). The highest ra estimate was obtained between GL and GW (0.68) and between GT and CRI (-0.44) (Tab. 1).
Regarding PE, rf and rg were positive and significant for CRI and negative for GL, GW, GT, and MG. A positive significant genotypic correlation (rg) 0.33 was observed between PE and CRI, and negative but not significant between PE and GL. Non-significant correlations imply no linear correlation but not necessarily lack of association between two traits (Cruz and Regazzi, 1997). The significant genotypic correlations between PE x GT and PE x GW were calculated as -0.49 and -0.43, respectively. The three main grain dimensions suggest that smaller grains have higher popping expansion during popping. It is known that grain shape greatly influences its popping expansion (Lyerly, 1942). Cabral et al. (2016) calculated the genetic correlations between these three characteristics and PE and reported negative values for GL and GW, but positive for GT. Lyerly (1942) stated that round grains have higher PE than elongated grains.
The MG trait is related to the overall kernel size of the sample. In this study, the genotypic correlation (rg) between PE and MG was significant and negative, -0.39. It is noteworthy that MG had positive and significant correlation coefficients with all-grain dimensions (GW, GT, and GL). Carpentieri-Pípolo et al. (2002) reported a negative correlation between popping expansion and ear total mass and grain mass per plant, important traits of crop grain yield. Daros et al. (2004) reported non-significant values for PE and grain yield. These results confirm the important effect of kernel size on PE. Cabral et al. (2016) suggested transforming these measurements into popcorn volume (PV) (Super-trait) ha-1 (PV, m3 ha-1) to reduce the effect of these correlations on the selection of productive parents with popping expansion above the national average.
To split the correlation coefficients in path analysis, a multicollinearity analysis was performed between variables (Cruz et al., 2012). The obtained condition number (NC) was 81.41, classified as weak; therefore, path analysis can be performed without statistical problems. Coimbra et al. (2005) stated that in the presence of multicollinearity, inconsistent estimates of the regression coefficient could be observed, while the direct effects of the explanatory variables on the response variable would be overestimated, and the irrational values would not explain the studied biological phenomenon.
It was observed that the highest values of positive direct effects on PE were for MG, GL and CRI and negative values for GT and GW (Tab. 2). These effects corroborate the results of rg and rf shown in Table 1.
TABLE 2 Estimates of the direct and indirect effects of grain traits on the popping expansion (PE) of popcorn.
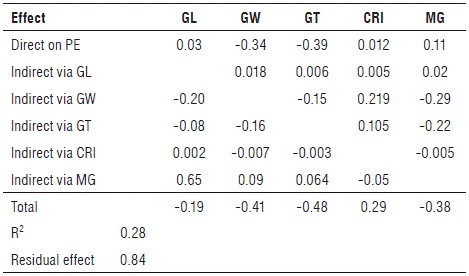
PE: popping expansion; GL: grain length; GW: grain width; GT: grain thickness; CRI: caryopsis roundness index; MG: mass of 50 grains.
The highest total effect on PE (-0.47) was observed for GT. However, of that value, -0.15 is represented by GW indirectly. The second-largest total effect (-0.41) was observed for GW while GT contributed with -0.16, the largest share.
These results confirm that PE is strongly influenced by kernel size and that increasing kernel size may negatively affect PE. The total effect of MG on the PE was -0.38 and the direct positive effect was 0.11. In this case, the path analysis indicates a rather pronounced complex relationship between MG and PE, with the negative correlation between MG and PE due to the indirect effects of kernel size, especially GW and GT. However, when the three dimensions (GL, GW, and GT) are transformed into CRI, a positive total and direct effect on PE is observed. These results suggest that the CRI trait should be used for indirect selection aiming at genetic gains in EC. The residual effect was 0.84, indicating that a correlation in path analysis, to be statistically and genetically relevant, would need to be greater than the residual value of 0.84 (Souza, 2013).
The associations between the evaluated traits using BN can be visualized using Directed Acyclic Graph (DAG) (Fig. 1). In this study, BN was used only to visualize the relationship between the traits of popcorn, in order to assess the dependence relationship of the studied variables.
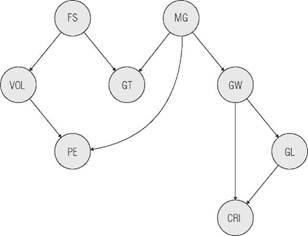
FIGURE 1 Bayesian network for the kernel traits of popcorn: grain width (GW), grain length (GL), caryopsis roundness index (CRI), flake volume (VOL), flake size (FS), grain thickness (GT), mass of 50 grains (MG), and popping expansion (PE).
In the Bayesian network, the associations are arranged hierarchically, so it becomes easy to visualize the importance in terms of prediction and conditional dependence of the direct association between the evaluated traits (Felipe et al., 2015). Thus, DAG reveals that only MG and VOL are directly related to PE, indicating dependence on the mass of 50 grains and the popped volume of the popcorn. It is known that this relationship exists since PE is determined by the relationship between these two traits.
According to Yu et al. (2004), Bayesian networks can be used to demonstrate biological phenomena in experimental data. Thus, grain dimensions such as width, length, thickness, and diameter are not directly related to PE and do not need to be used in prediction models (Fig. 2). It is noteworthy that among the dimensions measured in the grain, only GT can influence flake size (FS). All the above considering that flake volume depends exclusively on FS and that, based on these results, increasing kernel thickness may lead to genotypes with low EC values.
DAG shows no direct or indirect relationship of GL and CRI with PE. It is also observed that GT and GW are directly associated with MG and grain size and can indirectly influence the PE. These results corroborate the path analysis (Tab. 2) and those presented by Cabral et al. (2016) using correlation and path analysis.
Although the analyses had few divergences, the concomitant use of these strategies can increase the selection efficiency on traits aiming at increasing PE in popcorn breeding programs.
Conclusions
There is a significant negative genetic correlation between the popping expansion and grain width and thickness. The correlations between the mass of 50 grains with the popping expansion are due to the indirect effects of grain width and thickness.
Grain thickness, width, length and diameter are not directly associated with the popping expansion according to BN.
We suggest using the Bayesian network, together with path analysis to aid in the selection and evaluation of traits in popcorn breeding programs.

