Introduction
The blackberry (Rubus glaucus Benth.) belongs to the Rosaceae family. It is a perennial shrub with semi-erect stems and is cultivated between 1,800 and 3,200 m a.s.l. (Afanador-Kafuri et al., 2015). Blackberry has become one of the most important berry fruits in markets of the United States and the European Union, along with strawberries, raspberries, and blueberries (Clark and Finn, 2011). Blackberry shipments to final markets in the U.S. increased more than 530% in the first decade of this century. In addition, production in the United Kingdom and Mexico for fresh markets and in China for processed product markets has contributed to the growth of blackberry marketing worldwide. Among the reasons that this market has increased are the development of genotypes with longer shelf life, better handling facilities, enhanced marketing and promotion, and growing interest of consumers in functional products (Lewers et al., 2010; Ali et al., 2011; García and Vaillant, 2014; García et al., 2014) as well as the fact that these berries are more profitable than other similar raspberries (Clark and Finn, 2011). Given the importance of this fruit in the world market, breeding programs were developed looking for an improvement of major traits. At the beginning of blackberry breeding programs, fruit size that was related to yield was the primary objective. However, plant productivity, stem architecture, diseases, and insect resistance as well as plant adaptations were also considered. However, fruit quality is currently the driving force in breeding programs (Brock, 2017). Different traits relating to fruit quality that satisfy the preferences of the consumer as well as different shipment characteristics that facilitate commercialization of long-distance fresh markets have been considered. Furthermore, for the processed product market, fruits are sold fresh and frozen to be used in jams, juice, ice cream and yogurt flavoring (Morales et al., 1996). Also, health properties associated with their consumption, such as their antioxidant capacity and other functional properties, have aroused growing interest among scientists (Seeram et al., 2006; Espin et al., 2007; García and Vaillant, 2014).
There are currently more than 400 genotypes worldwide due to important advances reached in breeding programs in the United States, New Zealand, Mexico, and Brazil. Genotypes like Brazo and Tupy became successful in Brazil and Mexico. The U.S. has developed the largest number of genotypes and hybrids with special characteristics, such as 'Navaho', 'Ouachita', 'Boysen' and 'Chester Thornless', and others (Clark and Finn, 2011).
In Colombia, despite the social and economic importance of the crop, clearly identifiable certified planting material is scarce; and in some cases, it has low genetic quality due to the lack of current breeding. Previous studies on blackberry fruit quality have been carried out, and the main variables have been described. Espinosa et al. (2009) focus their research on fruit length, weight, width, and maturity, as well as total soluble solids (TSS) content and acidity. Grijalba et al. (2010) evaluate weight, TSS, and number of basal stems in thorny and thornless genotypes, but they do not find significant differences between these two genotypes. Carvalho and Betancour (2015) mention fruit weight, TSS content, titratable acidity, maturity index, color index, and firmness as the most suitable parameters for characterizing the quality of Andean blackberry.
These studies are based on non-certified plant material, since in Colombia there are as yet no registered varieties. Therefore, future results must be carefully compared. In this research, the blackberry breeding program of Corporacion Colombiana de Investigación Agropecuaria (Agrosavia) established an observation plot with promising genotypes for quality or yield, based on the previous results. The plot was established in Silvania, in the province of Cundinamarca. This is the largest blackberry production zone at the national level. In 2017, blackberry production was 30,970 t with a yield of 9.4 t ha-1. The climate of Silvania is tropical with significant rainfall during most of the months and a short dry season (Agronet, 2017).
Plant material characterized for several traits of interest in certain geographical regions will allow a better understanding of the relationships between variables and genotypes and may benefit a plant breeding program (Lewers et al., 2010). Considering that fruit size, soluble solids content, acidity, shape, and color are important characteristics for both fresh and processed markets, the aim of this research was to evaluate the fruit quality attributes of 10 Colombian blackberry genotypes in order to identify genotypes that have remarkable potential traits in the berry market and as a genetic source to be included in breeding programs.
Materials and methods
Field experiment
In 2016, a blackberry observation plot was established in Silvania, Cundinamarca, Colombia (04°24'10.6" N, 74°19'16.3" W and 2,215 m a.s.l.). The climatic conditions of Silvania are characterized as having a mean annual temperature of 11.5°C and 689 mm precipitation. Soil texture in the blackberry orchards was sandy with a medium percentage of organic matter (8.93%); soil pH measured with the potentiometric method was 5.18. The content of available P was 87.15 mg kg-1; K, Ca and Mg measured with ammonium acetate 1 N pH 7.0 were 0.17 cmol(+) kg-1, 1.48 cmol(+) kg-1, and 0.56 cmol(+) kg-1, respectively.
Plant material and experimental procedure
Blackberry (Rubus glaucus Benth.) plants of 10 genotypes were maintained in field plots in Silvania, Cundinamarca. These plants were established in performance plots for the project "Selected, identified and registered blackberry cultivars for commercial certification" included in the macro-project "Integrated development of sustainable production models for the cultivation of blackberry in Colombia". These genotypes were sown in rows spaced every 3 m in a completely randomized block design with four replicates per genotype with 10 fruits per block and genotype. Blackberry fruits of these ten genotypes were selected because of their interesting fruit quality traits, which were evaluated in three harvest dates throughout 2016 during the dry and rainy periods (Tab. 1).
TABLE 1 Origin and multiplication method used in the evaluated blackberry genotypes.
| Genotype code | Common name | Town and/or department of origin | Propagation institution | Multiplication method |
|---|---|---|---|---|
| VERG 1 | San Antonio | Antioquia | ||
| VERG 2 | Sin espinas | Antioquia | Universidad Católica de Oriente - UCO | |
| VERG 3 | Francesa | La Ceja, Antioquia | in vitro | |
| VERG 4 | UTP1 | Santa Rosa de Cabal, Risaralda* | Universidad Tecnológica de Pereira | |
| VERG 5 | UTP5 | Manizales, Caldas* | - UTP | |
| VERG 6 | ILS 2268 SNBGV 5014 | Manizales, Caldas | ||
| VERG 7 | Guapante | Guarne, Antioquia | ||
| VERG 8 | Pantanillo | La Ceja, Antioquia | AGROSAVIA | Sexual seed |
| VERG 9 | San Antonio | Envigado, Antioquia | ||
| VERG 10 | ILS 2281 SNBGV 5001 | Envigado, Antioquia |
*Source: Marulanda et ai. (2011).
The first fruit quality trial was carried out at the beginning of January 2016 after 10 months of production. This period was characterized by an absence of rainfall (0.0 mm), a mean day-time temperature of 19.4°C, and a mean nighttime temperature of 17.2°C. The second trial was carried out in February, one month later, in which the precipitation increased to 3.2 mm. The mean temperatures for day and night during February were 18.8°C and 16.3°C, respectively. The third harvest was carried out in May, with 6.5 mm of precipitation and a mean temperature of 18°C.
Physicochemical fruit quality analyses
Ten mature blackberry fruits (stage 5 of the color scale of the Colombian Technical Regulation NTC 4106, published by Icontec, 1997) were evaluated for each block and cultivar with four repetitions per each genotype. The assessment comprised every fruit quality parameter in each of the three harvest dates. The berries were transported to the laboratory the same day they were harvested for sample preparation and analysis. The following quality parameters were assessed: seed/fruit weight percentage, fruit weight and diameter, firmness, color, volume, soluble solids content, total acidity, and pH. These parameters are described below.
Fruit weight and diameter
Fruit weight (FW), as well as equatorial (ED) and longitudinal or polar diameter (LD) of 10 fruits, were recorded with a calibrated electronic scale (Mettler PE 300 digital scale, Ohio, USA) and a digital caliper (Mituyoyo, São Paulo, Brazil).
Firmness
Fruit firmness (kgf) was measured for 10 fruits using a texturometer (Chatillon TCD200, Ametek MTC, Largo, Florida, USA) with a flat probe of 10.92 mm of diameter, 3.45 mm thickness and a speed of 0.60 mm/min. Since fruits were not completely spherical, the test was performed perpendicularly to the flatter face of the fruit and around the equatorial zone.
Color
The three standard CIELAB parameters (L*, a*, b*) were established on the two opposite sides of the fruit that offer the largest surface area. A Minolta chromameter (Minolta, Ramsey, NJ, USA) was used. The parameters (a) (redness) and (b) (yellowness) were used to calculate two indices that express color (HUE angle) as well as the chroma or color intensity (McGuire, 1992). The HUE angle is calculated from the arctangent of b*/a*, and represents red-purple at an angle of 0°, yellow at 90°, bluish-green at 180°, and blue at 270°. The chroma was calculated using the following equation:
Volume
This characteristic was measured through water displacement in a graduated cylinder. The juice, pulp and seed/ fruit weight percentages were established after weighing and squeezing 10 blackberry fruits and filtering the mass using muslin to separate the juice from the pulp and seeds. The extracted juice was measured and weighed, and the seeds were separated from the residue. Both the pulp and seeds were weighed.
Soluble solids content, total acidity, and pH
The extracted juice was analyzed for the following parameters: Soluble solids content (SSC) using an ATAGO PAL-1 refractometer (Atago Co. Ltd, Tokyo, Japan); pH using a digital potentiometer (Mettler Toledo AG, Schwerzenbach, Switzerland); and total acidity (TA) by titration of 2 ml of juice diluted with 24 ml of distilled water and titrated to pH 8.2 with 0.1 N NaOH. TA was calculated as malic acid. The maturity index (MI) was calculated as the relationship between SSC (°Brix) and acidity.
Statistical analysis
The data obtained were subjected to an analysis of variance complemented with a Tukey's multiple comparison test, using the GLM procedure (α ≤0.05) found in the SAS software (Statistical Analysis System, Inc., version 9.3). Furthermore, a correlation analysis among all attributes was performed according to the Pearson's test (α ≤0.05).
Clustering genotypes
In order to classify these 10 evaluated genotypes into homogeneous groups according to their quality attributes, a principal component analysis (PCA) was carried out using the PRINCOMP procedure of the SAS software (Statistical Analysis System, Inc., version 9.4). This analysis was also performed in order to eliminate the redundant information contained in all average variables (fruit weight, total sugar content, acidity, pH, juice content, etc.). Based on the principal components (PC) retained, a cluster analysis was performed using the CLUSTER procedure (Ward algorithm) of the SAS software. In order to describe the defined groups, basic statistics were generated (mean, minimum and maximum values and coefficient of variation).
Results and discussion
Physical parameters of fruits
Weight
From the global analysis, significant differences in fruit weight were found among genotypes. Genotype 3 showed the highest mean value (5.99 g), and genotypes 10, 2 and 1 reported the lowest values (4.52 g), as illustrated in Figure 1.
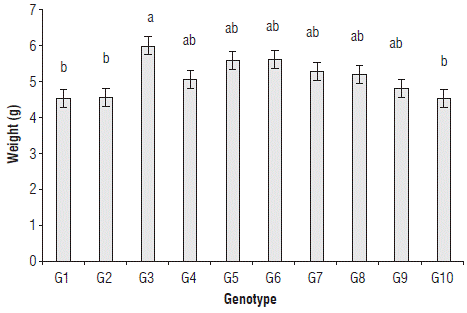
FIGURE 1 Mean fruit weight of ten blackberry genotypes assessed in Silvania, Cundinamarca. Each value represents the mean ± SE of ten berries per replicate with four replicates over three harvest dates per genotype. Means followed by the same letter within a single column bar are not significantly different (α = 0.05).
Fruit weight values found in all these genotypes were in the same range as those found by Hassimotto et al. (2008) and Farinango (2010) in studies conducted in Brazil and Ecuador, respectively. However, the values found in this study were lower than those found by Ayala et al. (2013), who report weights between 5.07-9.06 g for blackberries cultivated in Tolima, Colombia. According to the NTC 4106, all materials studied are classified as having medium or small fruits, corresponding to a commercial category C or D.
Clark and Finn (2011) recommend a weight around 8 or 10 g; regarding these results, all ten of the assessed blackberry genotypes have a similar size compared to important genotypes developed by this industry such as 'Osage' and 'Ouachita', although they were a bit smaller than 'Prim-Ark® Traveler'. Regarding size, these genotypes could probably be accepted in both national and international markets and would be more appropriately prepared as frozen berry mixes similar to raspberries.
Longitude and equatorial diameter
The 10 materials evaluated in the current study showed longitude values between 21.4 mm and 24.1 mm without showing significant differences. However, the equatorial diameter showed significant differences between genotype 8 and genotypes 2 and 1. Genotype 8 showed the highest value (21.07 mm), whereas genotypes 2 and 1 reported values of 18.27 and 19.11 mm, respectively (Fig. 2). The size of most of the blackberry fruits studied corresponds to the commercial categories B or C according to NTC 4106. Taking into account that all genotypes were classified as C or D for fruit weight means that these fruits are less dense or less compact than those reported in the NTC. Results found for genotype 2, which correspond to a thornless genotype, match the results described by Grijalba et al. (2010), who report that this thornless genotype is characterized by having a low fruit weight and a small size. The size of these genotypes is in the range found for blackberry varieties cultivated and commercialized in Colombia and other countries, such as Ecuador and Brazil (Hassimotto et al., 2008; Farinango, 2010). The correlation between diameters (LD and ED) was 0.53; therefore, both estimators should be taken into consideration for future studies. These two characteristics are important as they are related to the size of the fruit (Ayala et al., 2013) and both the industry and consumers have preferences for large fruits. Most people associate large size with quality, but this correlation is not completely true.
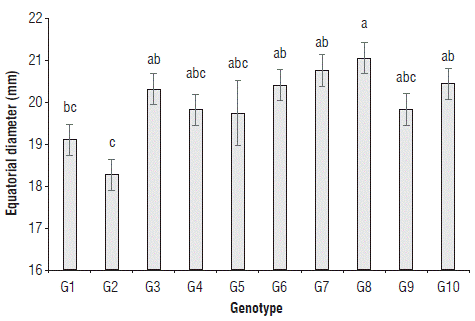
FIGURE 2 Mean equatorial values for the diameter of ten blackberry genotypes assessed in Silvania, Cundinamarca. Each value represents the mean ± SE of ten fruits per replicate with four replicates over three harvest dates per genotype. Means followed by the same letter within a single column bar are not significantly different (α = 0.05).
Firmness
This is an important index for blackberry shelf life since it is directly related to postharvest handling potential, considering that it is necessary to remember that fruit becomes softer with ripening. Therefore, the challenge is to achieve ripe fruit with high soluble solids content, low acidity, and that are shiny and with a uniform color, a developed flavor, and enough firmness for commercial shipping and handling. Genotype 1 achieved the highest firmness value with 4.1 kgf and showed significant differences from genotypes 4 and 3, which obtained the lower values of 2.46 and 2.03 kgf. These results show that fruit firmness was lower for all the genotypes under study (Fig. 3), compared to the blackberry genotypes that García and García (2001) report. However, these were firmer than thornless genotypes such as Brazos and Navaho, reported by Perkins-Veazie et al. (2000), with values of 1.86 and 2.45 kgf; but they were also in the same range as those reported by Moreno and Deaquiz (2016) and Segantini et al. (2018).
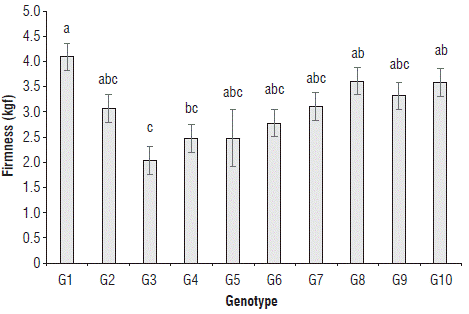
FIGURE 3 Mean firmness values of ten blackberry genotypes assessed in Silvania, Cundinamarca. Each value represents the mean ± SE of ten blackberry fruits per replicate with four replicates over three harvest dates per genotype. Means followed by the same letter within a single bar are not significantly different (α = 0.05).
According to these results, genotypes 1, 8 and 10 could be used to improve postharvest handling potential in a breeding program. However, genotypes 1 and 10 also showed the lowest fruit weight, which reduces their market potential. Thus, genotype 8 could be a good candidate for a breeding program.
Fruit volume and juice, pulp content and seed/fruit weight percentage
The fruit volumes obtained for all genotypes showed acceptable values that were adequate for commercialization. However, despite the large differences in volume from 4 cm3 to 5.9 cm3, there was no significant difference among genotypes. Nonetheless, a significant correlation of 0.794 (α<0.0001) between fruit volume and weight was found. A small volume could be considered an advantage as fruit can be packed more easily compared to large blackberry fruits, especially because all genotypes showed fruits with uniform conical or barrel shape and uniform drupelets. However, the market prefers large fruits as consumers associate size with quality.
Juice content reported significant differences among the genotypes (Fig. 4). Genotypes 1, 2, 4, 5 and 6 achieved the highest juice content compared to genotype 9, 10, 7 and 8 that showed the lowest values.
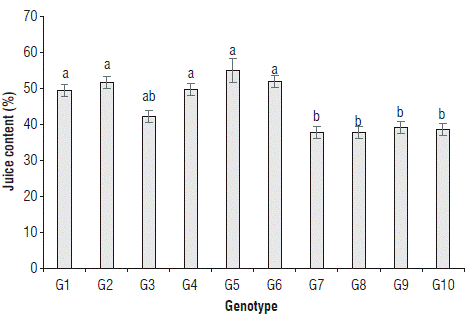
FIGURE 4 Mean percentage of juice content of ten blackberry genotypes assessed in Silvania, Cundinamarca. Each value represents the mean ± SE of juice released for ten berries per replicate with four replicates over three harvest dates per genotype. Means followed by the same letter within a single column bar are not significantly different (α = 0.05).
Genotypes 8 and 7 reached the highest value (51%) for pulp content, while genotypes 6 and 5 reported the lowest value. However, before recommending any genotype, it is important to point out that genotypes 6 and 4 showed the lowest seed/fruit weight percentage (3.85%) and these genotypes showed markedly significant differences with genotypes 10 (5.64%) and genotypes 7, 9 and 8 (5.3%) (Fig. 5). This characteristic relating to low seed perception is critical for both fresh and processed berries (Clark and Finn, 2011).
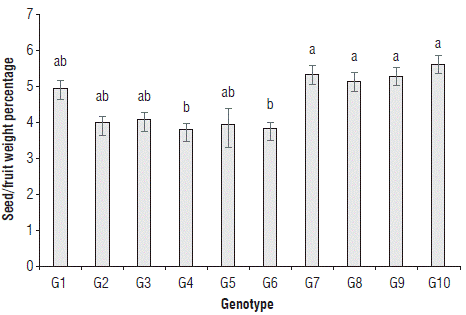
FIGURE 5 Seed/fruit weight percentage of ten blackberry genotypes assessed in Silvania, Cundinamarca. Each value represents the mean ± SE of ten berries replicated over three harvest dates per genotype. Means followed by the same letter within a single column bar are not significantly different (α =0.05).
Parameters such as juice and seeds are very important for fresh and processed fruit markets as they determine their potential yield and the production cost related to downstream operations.
Color
Fruit ripening and color of blackberry fruits are associated with better customer acceptance. Consumers look for fully dark but shiny red-purple drupelets, but not completely red as this means unripe fruit. Based on the results, it can be proposed that the color of all genotypes corresponds to a red color but with different grades of saturation. Figure 6 shows that genotype 4 had significant differences compared to genotype 10, highlighting its stronger red-purple color according to the HUE angle values found. This color is related to the presence of anthocyanins and according to these results it seems that genotype 4 shows a higher anthocyanin content (Zielinski et al., 2015).
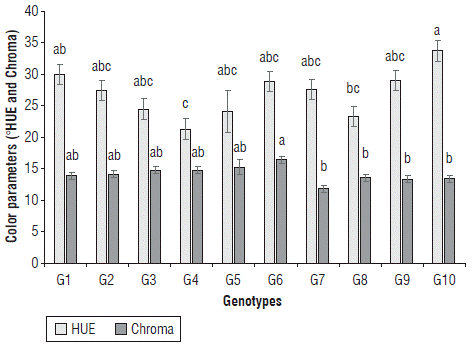
FIGURE 6 HUE and chroma values of ten blackberry genotypes cultivated in Silvania, Cundinamarca. Each value represents the mean ± SE of ten fruits replicated over three harvest dates per genotype. Means followed by the same letter within a single column bar are not significantly different (α = 0.05).
Genotype 6 achieved the most intense color compared to genotypes 8, 10, 9, and 7 which reported the lowest color intensity when interpreting chroma values. Genotype 4 could be considered a good option for breeding since it has a good balance between the red-purple color and intensity. According to these color parameters, most of the genotypes show a red-purple color when they are ripe, although small differences exist among them. However, there were no genotypes with marked differences in color, like 'Natchez', 'Osage' or 'Ouachita', which are characterized by having a black color when ripe.
Chemical parameters of fruits
pH, soluble solids content and titratable acidity
The highest pH values (2.8) were observed in genotypes 7, 4, and 2 establishing markedly significant differences from genotypes 9, 1, and 10 (Fig. 7). The pH parameter showed important differences among genotypes and can be considered a good indicator. Nevertheless, pH values found in all the genotypes were lower than those reported for genotypes Ouachita (3.2), Natchez (3.1), Navaho (3.2), and Osage (3.6) (Perkins-Veazie et al., 2000; Clark et al., 2019).
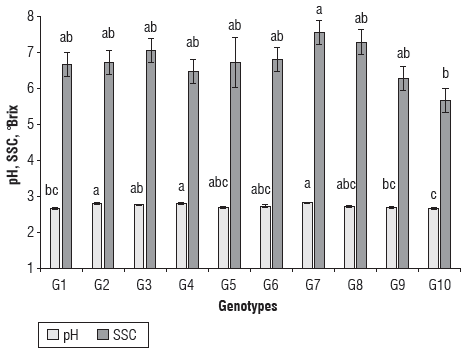
FIGURE 7 pH and soluble solids content (SSC) of ten genotypes assessed in Silvania, Cundinamarca. Each value represents the mean ± SE of the pH and the SSC values of juice obtained from ten berries per replicate, with four replicates over three harvest dates per genotype. Means followed by the same letter within a single column bar are not significantly different (α = 0.05).
The SSC is one of the most common fruit maturity indices and is a very important variable in the food industry as well as a good indicator of consumer appraisal (Abiodun and Akinoso, 2014). Significant differences between genotypes 7 and 10 were found, as the first one achieved the highest SSC (7.55), while genotype 10 only obtained a value of 5.68 °Brix. According to these results, most of these genotypes were harvested in ripeness stage 4 according to NTC 4106. It is also important to point out that genotypes 7, 8 and 3 reach SSC values as high as those achieved in popular genotypes such as 'Brazos', 'Caingangue', 'Choctaw', 'Comanche', 'Guarani', 'Tupy', and 'Xavante', according to Santos Guedes et al. (2013). On the other hand, these values are lower than those reported for genotypes Natchez, Osage, Ouachita, Prime-Ark® 45, Prime-Ark®Traveler, Cancaska, and Chester (Threlfall et al., 2016). Joo et al. (2011) report SSC values between 8 and 11%. Thus, genotype 8 can be recommended for a plant breeding program because of its red color and high total SSC.
Regarding total acidity, genotype 4 yielded the lowest value (2.48%) compared to the highest acid contents in genotypes 7, 8, 1 and 5 (3.1-3.24%); but there were no significant differences among them. These values reached by all genotypes under study were higher than those reported by genotypes Brazos, Caingangue, Cherokee, Choctaw, Comanche, Ebano, Guarani, Tupy, and Xavante (Santos Guedes et al., 2013). Genotypes Natchez, Osage, Ouachita, Prime-Ark® 45, and Prime-Ark® Traveler are characterized by their acidity values lower than 1.4%. Thus, it is necessary to continue looking for genotypes with less acid fruits and that are appropriate for Colombian conditions. Despite the fact that acid fruits have a longer shelf life since acidity acts as protection against microorganisms, this advantage is not so important for the industry which searches for fruits that combine low acidity and high sugar content in order to reduce sugar consumption and, therefore, the processing cost.
Flavor is also an interesting fruit quality characteristic and is composed basically of aroma, astringency, acidity and sweetness qualities (Clark and Finn, 2008). Total acidity and SSC are important fruit quality attributes that determine the taste and processability of fruits (Vrhovsek et al., 2008). Markets prefer a balance of sweetness and acidity, as high acidity with high soluble solids content is associated with a full and intense flavor, whereas lower acidity results in a "flat" flavor. Also, high acidity is related to longer anthocyanin stability (Clark and Finn, 2011). Then, if genotypes show high acidity, their SSC should also be high, otherwise other genotypes with lower acidity must be found.
Maturity index
The impact of fruit ripeness in blackberries is very important as it establishes fruit shelf life and consumer appeal. The sweetest blackberries are obtained when fruits are completely ripe, but the fruit is also softer at this stage. It is necessary to look for the most appropriate ripening stage to harvest the fruit, not only to satisfy consumer preferences, but also to reach a longer shelf life. More than SSC or acidity, the ratio between these two attributes is a better maturity indicator and is called the maturity index (MI). In Colombia, the standard maturity index for blackberry harvests ranges from 2.2 to 3.1 (Icontec, 1997). This variable was discriminative, showing significant differences between genotypes 4, 2, and 7 (2.69, 2.57, and 2.56, respectively), while genotype 10 had the lowest score of 1.98 (Fig. 8), which is not appropriate for consumers, since it has the most pronounced acid taste.
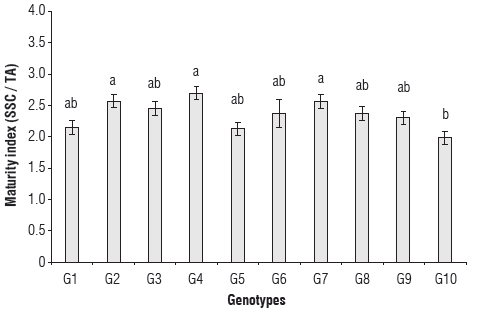
FIGURE 8 SSC/Total acidity ratio (maturity index) for ten blackberry genotypes cultivated in Silvania, Cundinamarca. Each value represents the mean ± SE of the SSC/Total acidity ratio of the juice of ten berries per replicate, with four replicates over three harvest dates per genotype. Means followed by the same letter within a single column bar are not significantly different (α = 0.05).
Clustering genotypes
To classify the ten assessed genotypes into homogeneous groups based on the variables fruit weight, soluble solids content, acidity, pH, juice content, seed/fruit weight percentage, equatorial diameter, firmness, and color (°HUE), we performed a principal component analysis (PCA). The first three components explained 81.62% of the total data variability. The first component reported 39.76% whereas the second one showed 26.68% and the third one 15.18%. Moreover, the first component was associated with the variables seed/fruit weight percentage, firmness, and color (°HUE); the second component was related to the equatorial diameter, and finally, the third component was related to pH and acidity, as seen in Table 2.
TABLE 2 Variables and their relation to the first three principal components (PC).
| Variables | PC1 | PC 2 | PC 3 |
|---|---|---|---|
| Fruit weight | -.380456 | 0.347499 | 0.261560 |
| Soluble solids content | -.273206 | 0.369684 | 0.011704 |
| Acidity | 0.176598 | 0.330511 | 0.609547 |
| pH | -.360983 | 0.031391 | -.532782 |
| Juice content | -.212779 | -.453601 | 0.457970 |
| Seed/fruit weight percentage | 0.430697 | 0.309257 | -.250258 |
| Equatorial diameter | -.013141 | 0.569760 | 0.004723 |
| Firmness | 0.456069 | -.005135 | 0.049697 |
| Color (°HUE) | 0.424465 | -.079420 | -.034471 |
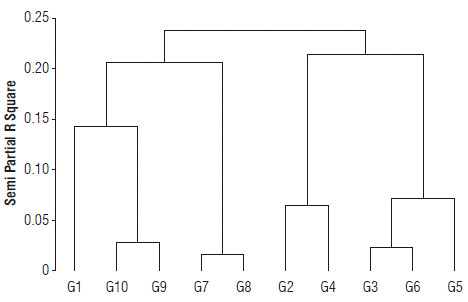
Figure 9 shows a dendrogram with the classification of these 10 genotypes in the dendrogram (Fig. 9), five groups were formed by cluster analysis.
Table 3 lists the means for each group of each of the variables; the groups are comprised as follows:
TABLE 3 Averages for each group for each of the variables in the analysis.
| Variables | Group 1 | Group 2 | Group 3 | Group 4 | Group 5 | General |
|---|---|---|---|---|---|---|
| Fruit weight (g) | 5.3 | 5.7 | 4.7 | 4.8 | 4.5 | 5.1 |
| Soluble solids content (°Brix) | 7.5 | 6.8 | 5.9 | 6.6 | 6.7 | 6.7 |
| Acidity (%) | 3.1 | 3.1 | 2.9 | 2.6 | 3.2 | 3.0 |
| pH | 2.8 | 2.7 | 2.7 | 2.8 | 2.7 | 2.7 |
| Juice content (%) | 37.9 | 49.8 | 38.9 | 50.7 | 49.4 | 45.4 |
| Seed/fruit weight percentage | 5.3 | 4.0 | 5.5 | 3.9 | 5.0 | 4.6 |
| Equatorial diameter (mm) | 21.0 | 20.2 | 20.2 | 19.1 | 19.1 | 20.0 |
| Firmness | 3.3 | 2.5 | 3.5 | 2.8 | 4.2 | 3.1 |
| Color (°HUE) | 25.4 | 25.9 | 31.5 | 24.4 | 29.9 | 27.0 |
Group 1, consisting of two genotypes (G7 and G8), is characterized as the group with the highest mean soluble solids content value (°Brix) (7.5), compared with the other groups. Fruit weight, acidity, pH, seed/fruit weight percentage, equatorial diameter and firmness were higher than the general mean of all the genotypes.
Group 2, consisting of the three genotypes (G3, G5 and G6) was characterized by having the highest juice content value (49.8%), as well as the highest fruit weight value (5.7 g). The content of soluble solids, acidity and equatorial diameter exceeded the general average for all genotypes.
Group 3, constituted two genotypes (G9 and G10) and showed the highest average values for color (31.5°HUE) and seed/fruit weight percentage (5.5%) for all the groups. The equatorial diameter (20.2 mm) and firmness (3.5) values exceeded the general average.
Group 4 included two genotypes (G2 and G4) and stood out by having the highest mean value in terms of juice content (50.7%). The other variables had lower mean values compared to the average of the other genotypes, except for pH, which exceeded the corresponding general average (2.8).
Finally, group 5 comprised the genotype G1, characterized by the highest acidity (3.2) and firmness (4.2) values of all the groups, and surpassed the general average for juice and seed/fruit weight percentage and color (°HUE).
Analyzing the results independently from each of the three harvest times it can be concluded that to evaluate new materials it is important to carry out long term studies. In such research it would be important to meticulously monitor edaphoclimatic conditions, since these drastically affect the behavior and performance of the crop, and as well, the crop needs adaptation time. This agrees with what Clark et al. (2019) report, who found an increase in yield, soluble solids content, and weight in an evaluation period of three years after the crop was established. Also, Conway (2018) reports that warm and dry climates produce less acid and sweeter fruits, but when temperatures are higher than 30°C the flavor and sweetness content are reduced, especially in humid climates. The results achieved in this research pointed out that equatorial diameter, fruit length, juice content, SSC and acidity have low values during the rainy season, whereas pH reached the highest values in this season. In addition, the maturity index showed the highest values in the dry season, supporting the proposal that dry seasons produce the best performance for all blackberry genotypes. Regarding firmness, the values increased with time, reaching the highest values in the third harvest.
Thus, to attain a deeper knowledge of these genotypes and obtain more reliability for them to be recommended as part of a breeding program, longer evaluation periods should be considered.
Conclusions
According to the overall results, genotypes 8, 4 and 6 are recommended for a breeding program based on various desirable characteristics. Genotype 8 is outstanding for traits like size, firmness, SSC and red-purple color; genotype 4 is interesting for its low seed/fruit weight percentage, red color, low acidity, pH, and high MI; and genotype 6 is outstanding for its high juice content, low seed/fruit weight percentage, and color intensity. Despite the low number of genotypes evaluated (only 10), these showed significant differences that allowed classifying them into five different groups.


