


 English (pdf)
 Article in xml format
 Article references
 Send this article by e-mail
 Cited by SciELO
  Cited by Google
  Similars in
SciELO
Similars in
SciELO  Similars in Google
 Permalink
Introduction
Soybean (Glycine max (L.) Merril) is one of the main oleaginous crops in the world (Cruz et al., 2016). This quality relates to its productive potential, chemical composition, and nutritive value, which allows it to have multiple uses, for both human and animal feeding. This crop is also of socio-economic importance since it is a raw material that is indispensable to boost several agro-industrial complexes (Mauad et al., 2010).
Brazil is the second-largest producer of soybeans; in the 2017/2018 harvest, it produced 116,996 million t, being only behind the United States, which produced 119,518 million t of this grain (EMBRAPA, 2018). After the 1970s, soybean production became of high relevance to agribusiness. Currently the Brazilian territory has the availability of natural resources that can be favorable for the maintenance and expansion of its production (Silva et al., 2011). However, some regions with production potential do not have recommended and tested genotypes, such as the Brejo da Paraiba region.
Plant breeding programs can overcome some limitations, given that soybean cultivars have a broad genetic diversity related to adaptation, especially for photoperiod sensitivity and temperature, which are indispensable factors for crop expansion (Viana et al., 2009). It is necessary to access the genetic variability available for future uses in breeding programs since this will make possible the selection of parent plants that will form the population with the highest proportion of desirable recombinants (Vasconcelos et al., 2015).
In addition to an adequate genotype selection, the success of soybean cultivation depends on several factors. The most important one is the use of high-quality seeds, resulting in high vigor plants that will perform better in the field. The use of high-quality seed allows access to genetic advances, quality assurance, and adaptation technologies in different regions, ensuring higher yields (Franca-Neto et al., 2016).
Soybean is considered a short-day plant; for this reason, most of the world's cultivated area is located at latitudes greater than 30. The adaptation of soybean to the latitude conditions of the Brazilian Midwest, North, and Northeast regions was one of the major challenges faced by soybean breeding programs (Almeida et al., 2011). In the Northeast region, there is a great demand for soybean for animal feeding in farms of almost all states. As a highly valued crop, it has great potential for gains for producers in the region, meeting regional and global market demands (Campos et al., 2016).
The precipitation of the Brejo da Paraiba region allows the cultivation of many vegetable crops of short and perennial cycle, including some species that require high amounts of water (Costa et al., 2015). However, there is a lack of practical and scientific information in the literature regarding the recommendation of genotypes for this region.
The objective of this study was to analyze the genetic diversity of soybean genotypes provided by the germplasm bank of the Universidade Federal Viçosa through uni and multivariate techniques and recommend the superior genotypes for the analyzed characteristics.
Materials and methods
The experiment was conducted at the Departamento de Ciências Biológicas (DCB), Centro de Ciências Agrárias (CCA) of the Universidade Federal da Paraíba (UFPB), campus II, located in the municipality of Areia, in the Brejo Paraibano Microregion at an altitude of 623 m a.s.l. and with coordinates 06°57'48" S and 35°41'30" W. The annual average temperature was 24.0°C with a relative average humidity of approximately 80% and annual average precipitation of 1,400 mm (Costa et al., 2015). The climate, according to Köppen (1936), is classified as As, a tropical climate, semi-humid, with rains during the autumn-winter season.
The seeds were donated by the plant breeding program of the Universidade Federal de Viçosa. The following genotypes with a relative maturity degree above 9 were pre-selected: M8867RR, M8766RR, M9144RR, SYN1059 RR, M-SOY 9350, ST 920 RR, TMG1175RR, M8372IPRO, M8527RR, M8644IPRO, TOPAZIO RR, UFV - 16 (Cap-inópolis) and UFVS: Berilo RR, 2013, 2012, 2010, 2005, QUARTZO, 2001, and 2008. The seeds were sown in a commercial substrate (Basaplant®) and arranged to place three seeds of the genotypes per cell. Fifteen days after germinated, plants were transferred to 5 L plastic pots maintained under greenhouse conditions.
The harvest was performed continuously; when the pods reached the point of physiological maturity and presented predominance of a brown color, they were harvested to avoid future losses, considering that soybean has a dehiscent characteristic. The experiment was located in a region with a high level of humidity (close to 80%) with regular rainfall during short periods of drought. For this reason, the seeds were harvested because they presented a decrease in humidity.
A ruler and pachymeter were used for quantitative evaluations such as hypocotyl length, leaf width and length, flower diameter, plant height, seed length and width. To perform the germination index analysis, we divided the number of germinated seeds by the total number of seeds and multiplied by 100 to obtain the result as a percentage.
A completely randomized design with five replicates was used. Data were previously subjected to analysis of variance, with a subsequent Tukey test (P≤0.05) to compare the means. For the multivariate analysis, a residual covariance matrix was obtained and as a measure of dissimilarity, the generalized distance of Mahalanobis (D2) was estimated; based on this, it was possible to apply the Tocher and UPGMA grouping method. The cut-off point of the dendrograms generated by the hierarchical methods, as well as the number of groups were estimated based on the method of Mojena (1977) based on the relative size of the levels of fusions (distances) in the dendrogram. The Singh criterion was also applied to quantify the relative contribution of these characteristics to the genetic divergence. Finally, the canonical correlation was also used. The analyses were performed using the Genes computational program (Cruz, 2013).
Results
From the 20 genotypes used, only 10 reached physiological maturity. The germination index of the seeds is shown in Table. 1. The genotypes that had the highest germination percentage were M8867RR, M8766RR, SYN1059 RR, TMG1175RR, UFVS: 2012 and 2005. The genotypes M8527RR and M8644IPRO had the lowest percentage of germination (6%).
TABLE 1 Seed size and germination index of 20 soybean genotypes.
| Genotypes | Seed size | % germination |
|---|---|---|
| UFVS Berilo RR | Big | 26.60 |
| UFVS 2013 | Big | 20.00 |
| M8867RR | Big | 33.30 |
| UFVS 2012 | Medium | 33.30 |
| UFVS 2010 | Big | 20.00 |
| M8766RR | Medium | 33.30 |
| M9144RR | Big | 20.00 |
| UFVS 2005 | Big | 33.30 |
| SYN1059 RR | Big | 33.30 |
| UFVS QUARTZO | Big | 20.00 |
| M-SOY 9350 | Big | 13.30 |
| ST 920 RR | - | 13.30 |
| UFV - 16 (Capinópolis) | - | 13.30 |
| UFVS 2001 | - | 13.30 |
| UFVS 2008 | - | 20.00 |
| TMG1175RR | Medium | 33.30 |
| M8372IPRO | - | 13.30 |
| M8527RR | - | 6.60 |
| M8644IPRO | Medium | 6.60 |
| TOPAZIO RR | - | 13.30 |
Fields filled with "-" did not reach the breeding stage and had no seeds to be quantified.
According to the analysis of variance by the F test at 5% probability, a significant difference was observed for leaf width, flower diameter, and seed width (Tab. 2). For hypocotyl length, leaf length, plant height, and seed length, no significant difference was observed.
TABLE 2 Summary of the ANOVA for the seven traits evaluated in ten soybean genotypes.
| SV | MQ | |||||||
|---|---|---|---|---|---|---|---|---|
| DF | HL | LW | LH | PH | FD | SL | SW | |
| Treatments | 9 | 2.82ns | 1.41* | 1.54ns | 331.16ns | 1.72* | 0.67ns | 0.74* |
| Residues | 20 | 2.25 | 0.43 | 0.81 | 147.91 | 0.50 | 0.39 | 0.29 |
| CV | - | 17.25 | 25.94 | 28.06 | 26.04 | 13.65 | 9.06 | 12.33 |
| CVF | - | 0.93 | 0.47 | 0.51 | 110.38 | 0.57 | 0.22 | 0.24 |
| CVE | - | 0.75 | 0.14 | 0.27 | 49.30 | 0.16 | 0.12 | 0.09 |
| CVG | - | 0.18 | 0.32 | 0.24 | 61.08 | 0.40 | 0.09 | 0.15 |
| h2 | - | 19.95 | 70.00 | 47.21 | 55.33 | 70.69 | 42.24 | 61.18 |
| CVg (%) | - | 4.97 | 22.70 | 15.32 | 16.73 | 12.24 | 4.47 | 8.93 |
| CVg/CVe (%) | - | 0.24 | 2.28 | 0.88 | 1.24 | 2.50 | 0.75 | 1.66 |
SV - source of variation; MQ - medium square; DF - degree of freedom; HL - hypocotyl length; LW - leaf width; LH - leaf length; PH - plant height; FD - flower diameter; SL - seed length; SW - seed width; CV - coefficient of variation; CVF - phenotypic variation; CVE - environmental variation; CVG - genotypic variation; h2 - heritability coefficient; CVg - genetic coefficient of variation; CVG/ CVE - ratio between genotypic variation and environmental variation; ns - not significant and ** significant at 5% probability by the F test.
The characters that had heritability values (hT) above 60% were leaf width, flower diameter, and seed width, which indicates that phenotypic selection can be performed with higher accuracy in relation to the other analyzed variables. This can be confirmed by the values of CVG/CVE, above 1 for the same characters.
The means of the characteristics were analyzed by the Tukey test (P≤0.05) (Tab. 3). The highest averages in these characteristics were obtained by five genotypes, M8867RR, SYN1059 RR, UFVS: Berilo RR, 2013 and 2012. The values obtained for leaf width ranged from 1.83 to 3.63 cm. Based on this characteristic the most recommended genotype was SYN1059 RR. For flower diameter, the values ranged from 3.91 to 6.26 cm, and the superior genotypes were M8867RR, UFVS: Berilo RR and 2012. For seed width, the values ranged from 3.71 to 5.27 cm, and the genotype that obtained the highest value was UFVS 2013.
TABLE 3 Mean of three traits evaluated in ten soybean genotypes according to the Tukey test.
| Genotypes | Traits | ||
|---|---|---|---|
| LW | FD | SW | |
| UFVS Berilo RR | 1.83b | 6.26a | 4.25ab |
| UFVS 2013 | 1.86b | 4.74ab | 5.27a |
| M8867RR | 2.20ab | 6.24a | 4.76ab |
| UFVS 2012 | 2.60ab | 5.74a | 3.71b |
| UFVS 2010 | 3.50ab | 5.14ab | 4.22ab |
| M8766RR | 1.93b | 4.53ab | 3.73b |
| M9144RR | 2.00b | 5.18ab | 3.92ab |
| UFVS 2005 | 3.16ab | 4.75ab | 4.40ab |
| SYN1059 RR | 3.63a | 3.91b | 4.77ab |
| UFVS QUARTZO | 2.50ab | 5.57ab | 4.47ab |
LW - leaf width; FD - flower diameter; SW - seed width. Means followed by the same letter in the column do not differ at 5% probability according to the Tukey test.
The Tocher's clustering method, from the generalized distance of Mahalanobis (1936), makes it possible to divide the genotypes into three genetically distinct groups (Tab. 4).
TABLE 4 Grouping of ten soybean genotypes evaluated for seven traits established by the Tocher method, using the generalized Mahalanobis distance as a measure of dissimilarity.
| Groups | Genotypes |
|---|---|
| 1 | UFVS 2012; UFVS 2005; UFVS 2010; M9144RR; UFVS QUARTZO; M8867RR |
| 2 | UFVS Berilo RR; UFVS 2013; M8766RR |
| 3 | SYN1059 RR |
In group 1, six genotypes that show genetic similarity (60% of the total) were included. Group 2 was composed of three genotypes with genetic similarity (30% of the total). Group 3 comprised only one genotype (10% of the total), indicating that it has genetic dissimilarity with the others.
A co-phenotype correlation coefficient of 0.76 was obtained using the Mahalanobis dissimilarity matrix to generate the dendrogram by the UPGM A method. This correlation confirms an adequate relation between the distance matrix and the generated dendrogram (Fig. 1). Using the Mojena method, it was possible to obtain two groups: one with the genotypes M8766RR, M9144RR, M8867RR, UFVS: Berilo RR, 2010, 2012, 2005, 2013 and QUARTZO; and another with only the SYN1059 RR genotype.
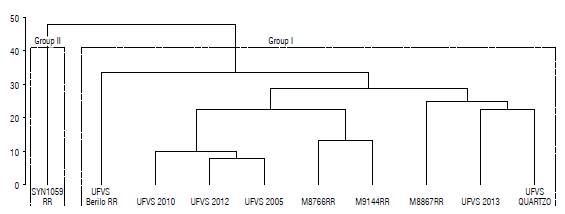
FIGURE 1 Dendrogram of the analysis of ten soybean genotypes by the UPGMA method obtained from the generalized distance of Mahalanobis, generated with seven characteristics. Coefficient of correlation (r) = 0.76.
In both the Tocher and UPGMA methods, the SYN1059 RR genotype was isolated in a different group from the others, which indicates a significant genetic dissimilarity when compared to the other genotypes tested.
From the Singh method (1981), which consists of the relative contribution of the characters to the diversity (value in %), based on the generalized distance of Mahalanobis, it was observed that the leaf width (35.45%) was the characteristic that contributed the most to the data variability, followed by the characteristics flower diameter (19.13%) and plant height (18.34%) (Tab. 5).
TABLE 5 Relative contribution of seven characteristics to the genetic dissimilarity of 10 soybean genotypes according to the method proposed by Singh (1981).
| Traits | Value In % |
|---|---|
| HL | 8.08 |
| LW | 35.45 |
| LH | 2.08 |
| PH | 18.34 |
| FD | 19.13 |
| SL | 8.51 |
| SW | 8.41 |
HL - hypocotyl length; LW - leaf width; LH - leaf length; PH - plant height; FD - flower diameter; SL - seed length; SW - seed width.
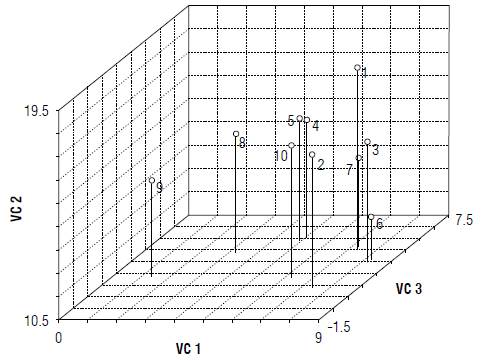
In order to analyze the canonical correlation, the first three canonical pairs had a genetic contribution of 90.14% (Tab. 6), thus permitting the presentation of the genotypes in a graphical dimension, where six groups were observed (Fig. 2), different from the cluster analyses mentioned above.
TABLE 6 Canonical correlation of the relative characteristics evaluated in the 10 soybean genotypes.
| Traits | Eigenvalues % | Accumulated % |
|---|---|---|
| HL | 48.02 | 48.02 |
| LW | 21.95 | 69.97 |
| LH | 20.17 | 90.14 |
| PH | 4.92 | 95.07 |
| FD | 2.92 | 98.02 |
| SL | 1.59 | 99.61 |
| SW | 0.38 | 100.00 |
HL - hypocotyl length; LW - leaf width; LH - leaf length; PH - plant height; FD - flower diameter; SL - seed length; SW - seed width.
Discussion
For the selection of promising soybean genotypes, those with significant values of leaf width, flower diameter, and seed size are of interest since they contribute to a higher photosynthetic surface, pod size, and physiological quality of the plant, which are associated with higher yields.
Given that the main commercial product of soybeans is the grain, it should be pointed out that the size of the seed affects its physiological quality, as mentioned by Pádua et al. (2010). Thus, the selection of larger seeds is indicated, because these will theoretically originate more vigorous plants. Therefore, the genotypes M8867RR, SYN1059 RR and UFVS 2005 are recommended based on the superiority of this characteristic (Tab. 1).
Another important attribute for selection is the existence of genetic variability. According to Martins et al. (2012), the characteristics that have significant differences according to the F test indicate the existence of genetic variability (Tab. 2). According to Domiciano et al. (2015), the values of the CVG/CVE ratio above 1 indicate that the plant breeding of the species through morphological characteristics is possible to be carried out through phenotypic selection of promising genotypes.
The multivariate analysis is a tool widely used in genetic divergence studies, as evidenced by Santos et al. (2011) and Almeida et al. (2011) in studies with soybean. This analysis offers the possibility of using various techniques, such as the Tocher grouping, or UPGMA dendogram the Singh method, and the canonical correlation. Viana et al. (2009) mentioned that the characters used in these analyzes allow the identification of genotypes with higher agronomic limits, identifying superior materials for breeding programs.
According to Martins et al. (2012), it is not viable to cross varieties contained in the same group as in the Tocher method since they present significant genetic similarity, which theoretically reduces the obtaining of superior materials. It would be recommended to cross genotypes that are in different groups, which increases the genetic dissimilarity and facilitates obtaining superior materials. However, besides the genetic divergence, it is necessary to observe mainly the values of heritability and variances.
For the Tocher grouping, the UPGMA method and the graphic dispersion, showed a difference in the formation and distribution of the genotypes within the groups. According to Azevedo et al. (2013), it is possible that this occurs since there is a difference between the accuracy and grouping criteria of the methods.
Based on the Singh test (Tab. 5), it is possible to notice the importance of the leaf width characteristic, since it contributes to genetic divergence and is closely related to the photosynthetic capacity of assimilatory tissues; thus, a higher leaf width may increase energy synthesis and finally improve the productive use (Petter et al., 2016)
Conclusions
The genotypes M8766RR, M8867RR, SYN1059 RR, UFVS Berilo RR, and UFVS 2012 showed the best values for leaf width, plant height, and flower diameter, having great potential to be cultivated in the target region, and are indicated for the continuity of the soybean plant breeding program.
The crosses between these genotypes are indicated as promising to obtain hybrids, since they have genetic variability and higher averages in the characteristics that contributed the most to the genetic divergence, such as leaf width, flower diameter, and seed width.

