


 English (pdf)
 Article in xml format
 Article references
 Send this article by e-mail
 Cited by SciELO
  Cited by Google
  Similars in
SciELO
Similars in
SciELO  Similars in Google
 Permalink
Introduction
The availability of input data is one of the greatest difficulties for using agricultural simulation models. Some models require large amounts of input data that are difficult to obtain and expensive (Jones et al., 2017; Rosa et al., 2020).
However, since crop growth modeling has progressed over the last decades (Siad et al., 2019), the evolution of simulation models combined with the simplification and robustness of the programs tends to increase precision (Steduto et al., 2009; Steduto et al., 2012; Tonitto et al., 2018).
Researchers from the Food and Agriculture Organization (FAO) aiming to meet the demand for more widely usable models developed the AquaCrop model (García et al., 2017). AquaCrop is a crop water productivity model designed to assess the effect of management and the environment on the production of different crops, simulating yield responses to water (Issoufou et al., 2020; López-Urrea et al., 2020). Among its other advantages, AquaCrop requires a small number of input data and their insertion is easier (Steduto et al., 2012; Raes et al., 2018a).
The literature considers that analyses to obtain soil physical-water attribute values still use difficult and time-consuming methods; also, the interpretation of their measurements is not direct due to the complexity and specificity of the evaluated soils (Lin et al., 1999; Bünemann et al., 2018). The standard methodologies require sensitive and expensive equipment that does not match the structure of most laboratories in Brazil. In addition, the results often produce errors and are not reliable (Oliveira et al., 2002). Therefore, the physical-water attribute data for insertion into the models may not be so easy to obtain or either operational.
In this regard, AquaCrop has shown advances in its development, making it possible to indirectly obtain some parameters or attributes of the agricultural environment as, for example, the use of pedotransfer functions to obtain the main soil physical-water attributes, considering only texture (Raes et al., 2018a; 2018b). In order to overcome this problem, AquaCrop allows: i) the introduction into the model saturated hydraulic conductivity (K sat ) values, field capacity (6 FC ), permanent wilting point (6 PWP ) and saturation (6 sat ) volumetric values; and ii) the generation of values of soil physical-water attributes (Ksat, 6 FC , 6 PWP and 6 sat ) based on soil texture (clay, silt and sand), using pedotransfer functions.
The alternative of using only the soil textural classification in AquaCrop is simple and quite interesting for carrying out analyses in places with little soil physical-water attribute data. In the literature, there are several studies with AquaC-rop, but none have evaluated the performance using the input method of the physical-water attributes (measured or estimated). However, this option can lead to considerable errors that have not yet been properly studied nor evaluated. This aspect is limiting, since the soil hydraulic properties, together with hydraulic gradients, control the water flow towards the roots (Pinheiro et al., 2019) and the soil physical-water attributes are fundamental to the interactions in the soil-plant-atmosphere continuum.
Considering the difficulty of obtaining the main physical-water attributes required as input in some simulation models, the objective of this study was to evaluate the performance of the AquaCrop model for estimating the productivity of soybean and maize crops in the region of Campos Gerais, according to the option of entering soil physical-water attributes into the model.
Materials and methods
The present study was carried out in the region of Campos Gerais, located in the States of Parana and São Paulo, which is the reference for grain production in Brazil. Maize and soybean historical crop data (2006/07 to 2013/14 harvest) of the ABC Foundation - Research and Agricultural Development were used. The experimental plots and stations used in the study were located at the Agrometeorology sector of the ABC Foundation (Tab. 1), which includes flat to gently undulating relief typical of the region. The soil tillage system is no-tillage with homogeneous vegetable mulching. The crop rotation system used is alternated between soybean and maize in summer, and wheat and black oats in winter. Pest and disease control is performed according to the usual methods in the region, and fertilization is performed by supplying all the nutrients necessary for full crop development. The data came from a historical experimental series carried out at the experimental stations of the ABC Foundation, harvests from 2006/07 to 2013/14.
TABLE 1 Locality, soil, climate, geographic coordinates and altitudes of ABC Foundation experimental stations.
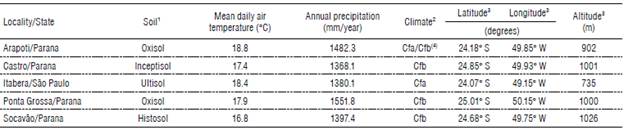
1Classification obtained from ABC Foundation soil maps (scale 1:10000); 2adapted from Alvares et al. (2013); 3geographic coordinates measured with GPS device; 4climate transition site according to Koppen's climate classification for Brazil: Cfa = humid subtropical, oceanic climate without dry season and with a hot summer and Cfb = humid subtropical, oceanic climate without dry season with a temperate summer.
The model used in the analyses was AquaCrop version 4.0. This experiment is part of several studies in the region of Campos Gerais, located in the States of Parana and São Paulo, in which the first phase consisted of testing the AquaCrop model using the parameters recommended by the model's creators.
To verify AquaCrop performance under agricultural production conditions, 42 and 64 simulations of maize and soybean production (kg ha-1), respectively, were compared to real yields (kg ha-1) from previous experiments carried out in the field, using harvests from 2006/07 to 2013/14. AquaCrop uses simulated groups of conservative parameters (that do not depend on cultivation conditions and water regimen, temporal scale, management practices, climate or geographic location) and non-conservative parameters (depending on the crop under study and the environmental conditions of cultivation). The required conservative parameters were based on the recommendations of Raes et al. (2013), and the non-conservative parameters were adjusted according to protocol data of the ABC Foundation.
To begin simulation, the AquaCrop model requires input data on soil, climate, crop and management (Raes et al., 2018a and 2018b). To obtain data, data entry varied according to the experimental stations and agricultural crop following methodological aspects.
Soil physical-water attributes scenarios
With the soil data input, two scenarios were considered in soybean and maize crops simulations: i) Standard - input of all measured soil physical-water attributes needed in AquaCrop, corresponding to each experimental station analyzed; and ii) Alternative - generation of the soil physical-water attribute values using AquaCrop pedotransfer functions, based on soil textural classification for each experimental station.
Soil
For each experimental plot (50 x 100 m), five representative points were analyzed in the field. The soil layers considered at each point were 0.0-0.10 m, 0.10-0.25 m and 0.25-0.40 m in order to reach the effective rooting depth of crops. For each layer, data were entered into AquaCrop according to simulation scenarios (standard or alternative). At each point and soil layer disturbed and undisturbed soil samples were collected totaling 75 soil samples (5 experimental stations, 5 experimental points and 3 depths). Volumetric water content at saturation (m3/m3) and field capacity (m3/m3) were determined according to Teixeira et al. (2017) using undisturbed soil samples collected with volumetric rings (5 cm diameter and 3 cm height). The water content at field capacity (m3/m3) was determined while the water balance was kept stable in the tension table at a tension of 0.01 MPa. The water content at permanent wilting point (m3/m3) was estimated in the soil water retention curve, created with SPLINTEX pedotransfer software (Prevedello, 1999). The volumetric water content at 1.5 MPa tension was considered as the permanent wilting point. The saturated hydraulic conductivity (mm/d) was determined with a constant head permeameter developed and calibrated at the Department of Soil and Agricultural Engineering of the Federal University of Parana, according to Teixeira et al. (2017). Soil texture was measured with disturbed soil samples using the densimeter method, according to the methodology of Teixeira et al. (2017). The soil volumetric water content at planting time (m3/m3) was estimated according to Souza et al. (2013). Thus, it was considered that the soil reached the water content at field capacity at the moment prior to planting when there was a heavy rainfall. From this date onwards, the daily inflow and outflow water in the soil began to be accounted for until planting time.
Climate
The climate data used came from the agrometeorological stations in each experimental field. The minimum and maximum air temperature (°C) and rainfall (mm) data were obtained from the climate databases provided by the Agrometeorology sector of the ABC Foundation. The reference evapotranspiration (ETo; mm/d) was estimated with the Penman-Monteith method (ASCE-EWRI, 2005).
The mean yearly atmospheric CO2 concentrations (ppm) were provided by the AquaCrop program, measured at the Mauna Loa observatory in Hawaii (Raes et al., 2018b).
Crop
The required data were the planting date, duration of each phenological cycle (d), plant population (plants ha-1) and effective rooting depth (m). The data came from historical experiment series carried out at the experimental stations of the ABC Foundation, harvests from 2006/07 to 2013/14.
Management
A fertilization level near optimal was considered. As the areas were under a no-tillage system, soil cover of mulch was considered to be 50% of the total soil covering in all experimental stations.
The input data were inserted into AquaCrop generating a soil and climate database for each experimental field in harvests between 2006 and 2014. The management data were the same for all simulations, only requiring a change in the crop data.
Statistical analyses were performed following the recommendations of Souza (2018). The respective values of real crop (kg ha-1) and estimated (kg ha-1) productivities obtained in standard or alternative simulation scenarios were compared statistically using linear regression analysis, correlation coefficient (r; Eq. 1), concordance d (Willmott, 1982; Eq. 2) and performance c (Camargo and Sentelhas, 1997; Eq. 3) indices. The analyzed results were organized by localities to verify the possibility of relating the result to the soil type of each experimental station.
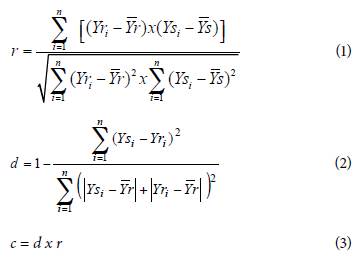
where: r = Pearson correlation coefficient (dimensionless); d = d index (dimensionless); c = c index (dimensionless); Yr, = real yields observed in the field at each i-experiment (kg ha4);
 = real average yields from all cultivars observed in the field (kg ha-1); Ys, = estimated yield observed in the model at each /-experiment (kg ha1);
 = observed average yields from all cultivars estimated in the model (kg ha-1); n = number of harvests in the localities (dimensionless).
The interpretation criteria of c performance was classified as excellent (c>0.85); very good (0.75<c≤0.85); good (0.65<c≤0.75); medium (0.60<c≤0.65); tolerable (0.50 <c≤ 0.60); bad (0.40 <c≤ 0.50); and terrible (c<0.40).
Results and discussion
The measured values (standard) of physical-water attributes from the soils for some experimental stations were different or close to those considered as alternative by AquaCrop (Raes et al. 2013), obtained according to textural classification of each soil (Tab. 2).
TABLE 2 Estimated (alternative) and measured (standard) soil physical-water attributes in the experimental areas of the ABC Foundation in the Campos Gerais region.
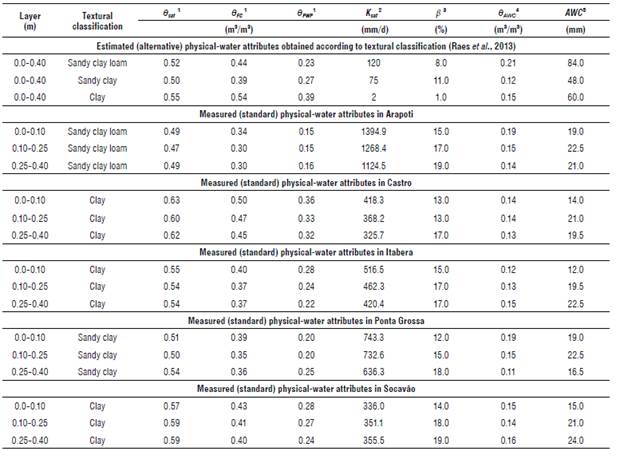
1θsat, θ FC , θ PWP = volumetric water content at saturation, field capacity and permanent wilting point, respectively; 2 K sat = saturated hydraulic conductivity; 3 β = porosity without water; 4 θ AWC = θ FC - θ PWP = available water in the soil; 5 AWC = θ AWC × z = available water capacity at the z depth.
The measured θ sat values (standard) in Arapoti were lower than the alternative values. In Castro and Socavào, the measured θ sat values were higher, and in Itabera and Ponta Grossa these values were very similar. The values of θ sat (considered equal to the total soil porosity) and θ FC allowed calculating the porosity without water (β= θ sat - θ FC ), consisting of the porous space not occupied by water (Tab. 2). The literature indicates that β should be enough for the oxygen diffusion in the soil to meet the oxygen demand of agricultural crops (Erickson, 1982; Reichardt and Timm, 2004). Thus, β values are more important than the magnitude (lower or higher) of θ sat and θ FC values. Studies indicate that β should be higher than or equal to 0.1 m3/m3 or 10% (Erickson, 1982; Reichardt and Timm, 2004). In order not to hamper the normal functioning of the plant root system, Yevtushenko et al. (2016) consider that β should not be below 0.15 m3/m3 or 15% in the surface layer.
Generally), β values calculated with the measured data (standard; Tab. 2) indicated better aeration conditions for soybean and maize crops than the estimated values (alternative; Tab. 2). The following means were verified: β = 17.0% (standard) and β = 8% (alternative) for sandy clay loam soil in Arapoti; β = 15% (standard) and β = 11% (alternative) for sandy clay in Ponta Grossa; β = 15.9% (standard) and t = 1.0% (alternative) for clay soils located in Castro, Itabera and Socavào; and β = 15.9% (standard) and β = 4.4% (alternative) for all soils analyzed from the Campos Gerais region (sandy clay loam, sandy clay and clay). Therefore, since they? are considered in the calculation the values of β (alternative) can penalize the yields estimated in AquaCrop, obtaining higher errors compared to the values of real crop productivity or estimated productivity with the measured physical-water attributes (standard).
The measured values of θ FC and θ PWP (standard; Tab. 2) were lower compared to the estimated values (alternative; Tab. 2), except for sandy clay soil (0-10 cm) in the experimental station of Ponta Grossa, where θ FC was equal to the estimated value (alternative). It is important to consider that the measured (standard) and estimated (alternative) values of θ FC and 6 PWP showed differences between the evaluated methods. However, the measured (standard) and estimated (alternative) values of soil available water (θ AWC = θ FC - θ PWP ) were very close, resulting in the following means: θ AWC = 0.16 m3/m3 (standard) and θ AWC = 0.21 m3/m3 (alternative) for sandy clay loam soil in Arapoti; θ AWC = 0.15 m3/m3 (standard) and θ AWC = 0.12 m3/m3 (alternative) for sandy clay soil in Ponta Grossa; θ AWC = 0.14 m3/m3 (standard) and θ AWC = 0.15 m3/m3 (alternative) for clay soils located in Castro, Itabera and Socavào; and θ AWC = 0.15 m3/m3 (standard) and θ AWC = 0.16 m3/m3 (alternative) for all soils analyzed from the Campos Gerais region (sandy clay loam, sandy clay and clay). Therefore, in terms of soil available water capacity, it is important to note that the measured (standard) and estimated (alternative) θ FC and θ PWP values showed no differences in the simulations.
Considering the available water values (θ AWC = θ FC - θ PWP ) and the root system depth (z; 0-10 cm, 10-25 cm and 2540 cm, respectively) of each layer, calculations of water capacity (AWC = θ AWC x z) to z = 40 cm with the measured (standard) and estimated (alternative) soil physical attributes indicated the following values (Tab. 2): AWC = 62.5 mm (standard) and AWC = 84.0 mm (alternative) for sandy clay loam soil in Arapoti; AWC = 54.5 mm (standard) and AWC = 60.0 mm (alternative) for clay soils in Castro; AWC = 54.0 mm (standard) and AWC = 60.0 mm (alternative) for clay soil in Itabera; AWC = 58.0 mm (standard) and AWC = 48.0 mm (alternative) for sandy clay soil in Ponta Grossa; AWC = 60.0 mm (standard) and AWC = 60.0 mm (alternative) for clay soil in Socavào; and AWC mean = 57.8 mm (standard) and AWC mean = 62.4 mm (alternative) for all soils analyzed from the Campos Gerais region (sandy clay loam, sandy clay and clay). The occurrence of water deficiency in the simulations is unlikely in the Campos Gerais region. In a study in Ponta Grossa region, Scheraiber (2012) verified that the occurrence ofwater deficiency (mm/ decade) is practically zero in soil simulations with water balance containing: AWC = 60 mm, available water fraction (p) between 0.3 and 0.7, and crop coefficient (kc) from 0.75 to 1.1. Thus, it is believed that simulated water storage values of the harvests will not be responsible for probable differences that may occur between values of estimated productivity with the measured (standard) and estimated (alternative) physical-water attributes.
The measured K sat (standard) values were much larger than the estimated (alternative) values for all textural classifications studied. Therefore, the studied soils (standard) have drainage characteristics (t) different from the alternative ones. According to Raes et al. (2018c), the drainage characteristic is a less constant unit responsible for the size given to the potential water depletion curve of a soil layer, originally at saturation, at the end of the first day of free drainage in the soil. The drainage (t) is a variable that depends on the saturated hydraulic conductivity. Thus, the use of estimated attributes (alternative) considers that water depletion of a soil layer would occur more slowly than the measured attributes (standard).
The measured (standard) and estimated (alternative) K sat values had the following means (Tab. 2): 1263 mm/d (standard) and K sat = 120 mm/d (alternative) for the sandy clay loam in Arapoti; K sat = 704 mm/d (standard) and K sat = 75 mm/d (alternative) for sandy clay soil in Ponta Grossa; K sat = 395 mm/d (standard) and K sat = 2 mm/d (alternative) for clay soils in Castro, Itabera and Socavao; and K sat = 630 mm/d (standard) and K sat = 40 mm/d (alternative) for all soils analyzed from the Campos Gerais region (sandy clay loam, sandy clay and clay). The amplitude of measured values (standard) is acceptable for the evaluated areas since the K sat has high variability in different soil types.
The correlation coefficients indicated that the associations between real crop yield and estimated (Yr vs. Ys) in AquaCrop are less accurate when using the alternative (estimated) scenario of soil physical-water attributes in the simulations (Tab. 3 and Fig. 1). In the simulations with the standard (measured) scenario, r≥0.88 was obtained for soybean (Castro) and r>0.81 for maize (Castro). In simulations with the alternative scenario, the associations indicated a higher dispersion with lower r occurring in Castro (r = 0.41 for soybean) and Socavão (r = 0.56 for maize). When analyzing the soil physical-water attributes (Tab. 2) it was not possible to identify the reason for this higher dispersion. Castro and Socavão have clay soil that limits the aeration porosity (β) to 1% and K sat = 2 mm/d. The attribute values could have interfered in the yield estimation results in AquaCrop; however, Itabera showed the same values of β and K sat and did not exhibit a reduction of r.
TABLE 3 Performance of the AquaCrop model, according to standard and alternative simulation scenarios, for soybean and maize crops in Campos Gerais region.
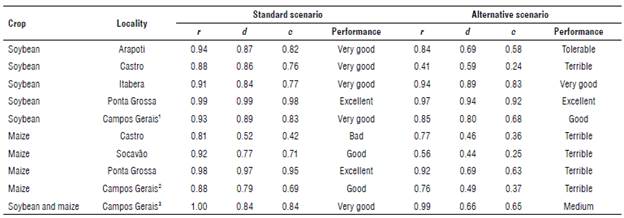
1Experiments with the soybean crop in Arapoti, Castro, Itabera and Ponta Grossa; Experiments with maize crops in Castro, Socavao and Ponta Grossa; Experiments with soybean and maize crops in Arapoti, Castro, Itabera, Ponta Grossa and Socavao.
The r values of the association Yr vs. Ys were lower in the alternative scenario. However, the drop in performance was mainly due to the d index values (Tab. 3). The use of estimated (alternative) soil physical-water attributes, based only on the soil textural class, somehow altered the simulated yield values (Ys) and data dispersion distanced from 1:1 line (Fig. 1). Castro and Socavão again were the locations that had the highest reduction in d index values. Considering maize and soybean and maize crops, the Yr vs. Ys conjunction analyses for Campos Gerais also drew attention to a reduction in d index values.
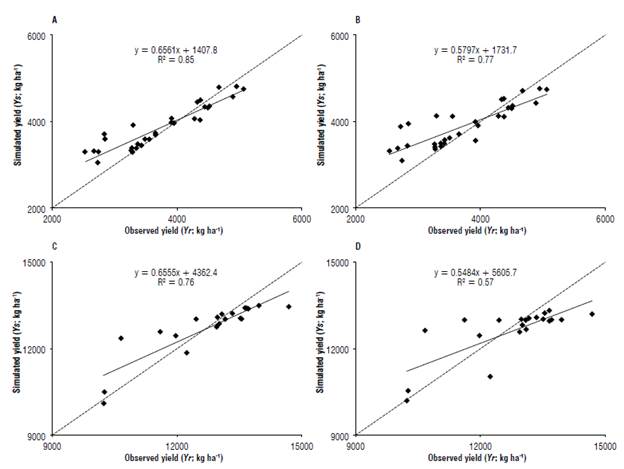
FIGURE 1 Linear regression and corresponding determination coefficient between the real crop and estimated mean productivity with AquaCrop in the Campos Gérais region, in the following simulation scenarios with soil physical-water attributes: A) measured (standard) simulation for soybean; B) estimated (alternative) simulation for soybean; C) measured (standard) simulation for maize; and D) estimated (alternative) simulation for maize.
The performance of soybean and maize crop yield estimates with AquaCrop using the input data from the alternative scenario varied between terrible and very good, with a predominance of terrible (Tab. 3). Only Ponta Grossa (excellent) and Itabera (very good) showed satisfactory performances for the soybean crop. With the exception for Ponta Grossa, all performances obtained in AquaCrop were lower in the alternative scenario simulations than those obtained in the standard (measured) scenarios.
The alternative scenario in AquaCrop should be used with much restriction. Using soil texture to predict the values of soil physical-water attributes proved to be an easier way to estimate the productivity of soybean and maize crops; however, it resulted in low performance for estimating soybean and maize yields in Campos Gerais. The positive results for the soybean crop in Ponta Grossa (excellent) and in Itabera (very good) were insufficient, since they did not allow the identification of cause and effect relationships with the measured physical-water attribute values.
Considering the results obtained in this study, we believe that AquaCrop has great potential to be used for soybean and maize crops in the region of Campos Gerais, with all soil physical-water attributes measured (standard) and, the ability to achieve reliable results for scientific studies in the Brazilian scenario.
Conclusions
The simulation scenario in AquaCrop using measured soil physical-water attributes (standard) provided better results (very good to excellent), indicating the need of inserting the real soil physical-water attribute values for more accurate productivity simulation results.
The simulation scenario with estimated soil physical-water attributes (alternative) in AquaCrop should be used restric-tively. Using only soil texture indicated an easier method for estimating the productivity of soybean and maize crops, but with low performance for estimating soybean and maize yields in Campos Gerais.

