


 English (pdf)
 Article in xml format
 Article references
 Send this article by e-mail
 Cited by SciELO
  Cited by Google
  Similars in
SciELO
Similars in
SciELO  Similars in Google
 Permalink
Introduction
Moringa oleífera (MO) belongs to the Moringaceae family and is mainly distributed in Latin America, Asia, and Africa (Tao-Bin et al., 2018). The high concentration of nutrients in leaves, pods and seeds, as well as its rapid growth in poor soils with a pH of 5.0 to 9.0 and resistance to droughts, have transformed this plant into an attractive partial solution to problems such as malnutrition in the most vulnerable sectors of the population (Rashid et al., 2008).
Fresh MO leaves have 7 times more vitamin C than oranges, 10 times more vitamin A than carrots, 17 times more calcium than milk, 9 times more protein than yogurt, 15 times more potassium than banana and 25 times more iron than spinach. Therefore, MO has been widely used for human and animal consumption (Fahey, 2005; Anwar et al., 2007; Moyo et al., 2011; Bonal et al., 2012; Gopal-akrishnan et al., 2016). MO seeds have around 33-41% oil, containing high concentrations of oleic acid (>70%). MO 011 is commercially known as "ben oil" due to its content of behenic acid (docosanoic), which shows high resistance to oxidation, has various medicinal uses, and high nutritional value. In addition, seed residues generated during oil extraction contain a peptide that has proved to be one of the best naturally occurring coagulating agents (Rashid et al., 2008; Sánchez-Machado et al., 2010).
Some parts of the MO plant, such as leaves, pods and seeds, have several medicinal properties. Therefore, these plant parts have been used to treat diseases such as hypertension, diabetes, anemia, fertility problems, neurodegenerative, liver and kidney diseases as well as skin disorders and cancer (Gowrishankar et al., 2010). In 2007, MO was named the "Botanical of the Year" by the National Institute of Health (NIH) due to its nutraceutical and medical properties (Gupta et al., 2018).
In recent years, Mexico has increased MO production, mainly in the states of Sonora and Guerrero, supporting the commercialization of the edible parts of the plant and the development of new products from them (Sánchez-Machado et al., 2010). However, factors such as growing conditions, climatic change, location of crops and soil type promote different nutritional components in the plant. Moreover, when high temperatures are reached, enzyme denaturation occurs (Gopalakrishnan et al., 2016). The aim of this work was to evaluate the nutritional quality (proximate composition, phenolic compounds, and antioxidant capacity) of different parts of the MO plant from two different regions of the Mexican Republic and to offer reliable information to the consumer and producer who use parts of MO in their products or as a nutritional supplement.
Materials and methods
Sample collection
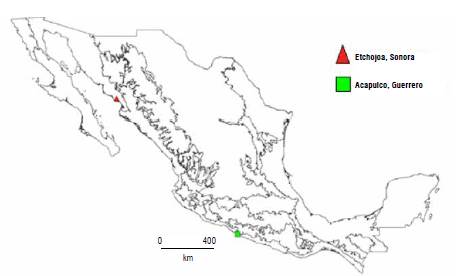
Leaves, seeds and husks were collected from places in two Mexican states (Etchojoa, Sonora and Acapulco, Guerrero) in November, 2016 (Fig. 1). Due to the collection date, flowers could only be collected from Guerrero. Samples were dried at 60°C for 12 h in an electric oven (DP43C, Yamato Scientific America, Santa Clara, USA). The dry samples were milled (electric mill, NutriBullet, Los Angeles, USA) and collected in closed plastic bags (Ziploc®) at room temperature, and then stored in a cabinet to avoid light, until their analysis.
Proximate composition
The proximal analysis of the samples was performed following the AOAC methods for protein (960.52), fat (920.85) and ash (923.03) (AOAC, 2000). Total dietary fiber was calculated based on the gravimetric enzymatic method according to Prosky et al. (1998), using a thermostable a-amylase and amyloglucosidase (Merck, Darmstadt, Germany). Insoluble dietary fiber was determined by the same procedure, but methanol (Merck, Darmstadt, Germany) was not added after the enzymatic treatment. Finally, soluble dietary fiber was calculated by subtracting the total dietary fiber from the insoluble dietary fiber. Carbohydrates were estimated as the remaining percentage reached 100% of the proximal composition (FAO/WHO, 2004).
Phenolic compounds
Total phenol determination was carried out following the Folin-Ciocalteu spectrophotometric method described by Singleton and Rossi (1965), using gallic acid as a standard for the calibration curve, with an optimal concentration range of 0.05 to 0.2 mg ml-1. The crude extract was obtained by adding 100 mg of the sample in 10 ml of methanol (30%) in deionized water. The sample was stirred for 10 min at 8000 rpm, then centrifuged for 10 min (5000 rpm), and the supernatant was recovered. An aliquot of 125 μl of the crude extract was added to 500 μl of deionized water and stirred for 15 seconds (3000 rpm). Afterwards, 125 μl of Folin-Ciocalteu reagent was added to the sample which was maintained for 6 min in the dark; then 1.25 ml of Na2CO3 (7%) + 1 ml of deionized water were added and the sample was left in the dark for 90 min. Finally, the absorbance at 750 nm was registered using a spectrophotometer (6405 UV/Vis, JENWAY, San Diego, USA). The results were expressed as mg of Gallic Acid Equivalents (GAE) 100 g-1 of sample (mg GAE 100 g-1) (R2 = 0.9991).
Condensed tannins were determined following the vainil-lin method proposed by Hagerman et al. (1989), using (+) catechin as a standard in concentrations from 0.0039 to 1 mg ml-1. A crude extract was obtained from 200 mg of dry sample in 10 ml of absolute methanol and stirred at 8000 rpm for 20 min. Later, 1 ml of the crude extract was mixed with 5 ml of freshly prepared vanillin reagent (1% vanillin in methanol and 8% hydrochloric acid in methanol 1:1) in a falcon tube. The tube was kept in a water bath for 20 min at 30°C. Finally, the absorbance at 500 nm was read in a spectrophotometer. At the same time, a correction factor with 1 ml of the crude extract mixed with 5 ml of hydrochloric acid (4%) in methanol (instead of vanillin reagent) was evaluated. The final concentration was expressed as mg (+) Catechin Equivalents (CE) 100 g-1 of the sample (mg CE 100 g-1) (R2 = 0.9997).
Total flavonoids were determined according to the method proposed by Borrás-Linares et al. (2015), using a standard curve of (+) catechin in a range of concentration from 0.015 mg ml-1 to 0.5 mg ml-1. The crude extract was obtained from 200 mg of dry sample in 5 ml of aqueous methanol (60:40) mixed in a falcon tube and stirred for 10 min using a vortex. Later, the tube was sonicated for 30 min at room temperature and centrifuged at 10,000 rpm for 15 min at 4°C. The supernatant was recovered and 250 μl of this supernant + 75 μl of NaNO2 (5%) was poured into a test tube and stirred. After, 150 μl of AlCl3 (10%) + 500 μl of NaOH (1M) + 1.52 ml of deionized water were added to the tube to total 2.5 ml which was placed in repose for 5 min. The final concentration of flavonoids was expressed in mg (+) catechin equivalents 100 g-1 of the sample (mg CE 100 g-1).
Antioxidant capacity (TEAC and ORAC)
Trolox equivalent antioxidant capacity (TEAC) or ABTS+ antioxidant capacity was determined following the method described by Van der Berg et al. (1999). The crude extract was obtained with 20 mg of sample in 5 ml of acetone/water (1:1 v/v) mixed in a test tube. The mix was then sonicated for 10 min and centrifuged at 5000 rpm for 5 min. The radical ABTS+ was prepared dissolving 38 mg of the reactive ABTS (Merck, Darmstadt, USA) in 1 ml of potassium persulphate 2.45 mM in deionized water. To determine the antioxidant capacity, 0.15 ml of the ABTS+ solution was diluted in 14 ml of phosphate buffer at pH 7.4. The resultant absorbance was 0.7±0.020 at 734 nm. Then, the absorbance at initial time (t=0) was measured in 990 μl of the radical ABTS+ solution, and 10 μL of the sample was immediately added. The mix was left to rest for 6 min and the absorbance at 734 nm (t=6) was measured. Antioxidant capacity was calculated by comparing the absorbance values of the sample to a Trolox standard (TS) curve (100 μM TS g-1 to 3000 μM TS g-1) (R2 = 0.9903).
The ability to trap peroxyl radicals (ROO°) or oxygen radical absorbance capacity (ORAC) was determined according to Ou et al. (2001). The crude extract was obtained with 50 mg of sample in 5 ml of acetone/water (1:1 v/v) mixed in a test tube. The mix was then sonicated for 10 min and centrifuged at 5000 rpm for 5 min and the supernant was recovered. To standardize the crude extract, 15 μl was taken and diluted with 1.98 ml of phosphate buffer solution (pH 7.4). Afterwards, 1.5 ml of fluorescein solution was collected (7.7 μl of stock fluorescein solution, 0.5315 mM in 50 ml of crude extract) and placed in a quartz cell.
In the same quartz cell, 0.75 ml of diluted crude extract was added. The cell was placed in a water bath for 5 min at 37°C and 0.75 ml of AAPH (2,2'-azobis (2-amidinopro-pane) HCl) (0.415 g of AAPH in 10 ml of phosphate buffer solution) was added. The first reading was made in the fluorometer (TBS-380, Turner Biosystems, Massachusetts, USA) (X excitation= 493 and X emission= 515) and the sample was returned to the water bath. The sample was read every minute until the value corresponded to 10% of the initial value. Results were expressed in Trolox equivalent micromoles per gram of dry sample (umol Trolox g-1) using a standard curve (R2 = 0.9971).
Statistical analysis
All analyses were performed in triplicate (n = 3) and standard deviation was determined. Additionally, a principal component analysis was carried out using NTSYSpc, version 2.20f, to elucidate main traits that intervened in the differences of MO parts and origins. This multivariate statistical analysis factorized the standardized variance and covariance matrix in their Eigenvalues and Eigenvectors to show the total variability of all experimental units, MO parts and origins. The reduced Euclidean planes allow comparing the means of the distance of the projection of each experimental unit in the three principal components three Eigenvectors with the highest Eigenvalues (Jonhson, 1998; Núñez-Colín and Escobedo-López, 2014).
Results and discussion
Proximal composition
Ashes
There was a difference between ash contents from MO leaves obtained in Sonora and Guerrero (Tab. 1). Guzmán-Maldonado and Fuentes (2015) analyzed samples from Celaya and Guanajuato, Mexico, reporting an ash content of 12.3%. Moreover, Sánchez-Machado et al. (2010) studied samples from Sonora, Mexico reporting ash contents of 14.60% in MO leaves. It is possible that Guerrero's environmental conditions (the type of weather and soil, sowing region, and crop conditions) may have affected the ash content. MO seeds showed an ash content of 4.48% for Sonora and 4.31% for Guerrero. These values were lower than those reported by Abdulkarim et al. (2005) in samples from Selangor, Malaysia (6.5%) and Sánchez-Machado et al. (2010) in Sonora, Mexico (7.62%). The analysis of the seed shell showed ash values of 2.96% and 4.92% for Sonora and Guerrero, respectively. The ash content of MO flowers collected in Guerrero was 8.86%, which is similar to the 9.68% reported by Sánchez-Machado et al. (2010).
TABLE 1 Proximal composition (%, dry base) of the different structures of Moringa oleifera*.
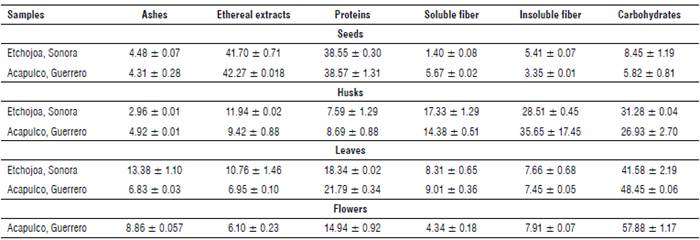
*The values reported are the average of n = 3 ± standard deviation.
* The total fiber results are not shown in the table, but they represent the sum of soluble fiber + insoluble fiber.
The results suggested that there is an influence on the ash contents according to the sowing region, as can be observed in the results obtained from MO leaves and seed shells. Faizi et al. (1998) report that it is normal to find these types of differences in the results due to the sowing region. Lalas and Tsaknis (2002) mention that factors such as the soil type, water stress, plant age and genetic factors are reflected in the proximal composition of MO plants.
Proteins
The content of proteins in MO leaves was 18.34% for Sonora and 21.79% for samples from Guerrero. Makkar and Becker (1996) and Sena et al. (1998) report similar values to the ones obtained for MO leaves from Guerrero (25.10% and 22.90% from Nicaragua and Balayera, Nigeria, respectively). On the other hand, Reyes et al. (2006) report protein contents of 17.80% in samples from Managua, Nicaragua, resembling the percentage of protein observed in samples from Sonora. Previous studies have shown a variation in protein contents in MO leaves according to the planting area. Moyo et al. (2011) report protein contents of 30.3% in MO leaves from Africa, while Dhakar et al. (2011) report 27.1% in Pakistan. It is noteworthy that the protein content of MO leaves from Sonora and Guerrero is higher than the values reported in chard (Beta vulgaris subsp.) (2.9%) (Macías de Costa et al., 2003) or edible algae (5 to 13%) (Sánchez-Machado et al., 2004).
Moringa oleifera seeds showed a protein content of 38.55% (Sonora) and 38.57% (Guerrero); these values are similar to those reported by Amaglo et al. (2010) (35.7%) and Vaknin and Mishal (2017) (37.59%). However, the protein content of MO seeds from this study differs from the 20.66% value reported by Gidamis et al. (2003).
MO seed shells resulted in the lowest values of proteins compared to the other analyzed parts of the plant (7.59% for Sonora and 8.69% for Guerrero). The main applications of seed shells are for obtaining bioadsorbents (Do Carmo et al., 2013) and biofuels due to their high carbohydrate content (Raman et al., 2017). That is the reason why there are fewer reports related to the protein content of this MO part.
Moringa oleifera flowers showed a protein content of 14.94%. This value is lower than the one reported by Sánchez-Machado et al. (2010) (18.92%) in samples from Sonora, Mexico. It is not possible to make a broader comparison of the total protein content in MO flowers due to a lack of references. However, a related study found 9,443 peptides with molecular weights between 40-70 kDa, suggesting the possible use of these proteins in the fermentation industry as well as in the development of functional peptides (Shi et al., 2018).
Lipids
The lipid content in MO leaves showed differences between the evaluated regions (Tab. 1). Samples from Sonora showed a lipid content of 10.76%, whereas samples from Guerrero showed a content of 6.95%. Sánchez-Machado et al. (2010) report a value of 4.60% for lipid contents in MO leaves collected in Sonora, Mexico. Besides, Makkar and Becker (1996) report a percentage of 5.40% of lipids in MO leaves; this is lower than the lipid contents obtained in the present research. This variation could be attributed to the specific area of sowing, harvest season, the age of the plant, and the climate conditions of the region (Sánchez-Machado et al., 2010).
MO seeds from Sonora showed 41.70% lipids and the ones obtained from Guerrero showed 42.27% (Tab. 1). These values are similar to the ones reported by Anhwange et al. (2004) and Anwar and Bhanger (2003), which are 40.39% and 41.58%, respectively. In this research, no significant differences were found in lipid contents between the sowing areas. However, authors such as Bhutada et al. (2016) state that these contents may vary from 16% to 47% depending on the sowing regions.
The lipid content of MO seeds is a critical factor since it is one of the most interesting products of this plant, and the oil is currently accepted as a substitute for olive oil. Additionally, its lipid content is higher than the lipid content of soybean, which contributes to its nutritional importance (Vaknin and Mishal, 2017).
Seed shells collected in Sonora had a lipid content of 11.94% and those obtained from Guerrero showed values of 9.42%. It is noteworthy that seed shells contain significant amounts of lipids, but currently there are no reports related to the use of these parts. Nowadays, seed shells are mainly used for bioethanol production due to their high content of carbohydrates (39.8%) that can be converted into simple sugars (Martín et al., 2010).
The lipid content in MO flowers from Guerrero (6.10%) was higher than the 2.91% reported by Sánchez-Machado et al. (2010) and the contents reported by FAO (2003) (4.1%). It is important to mention that oil from MO flowers is a plentiful source of linoleic, oleic and linolenic acids (Sánchez-Machado et al., 2010), which gives the MO flower the potential for extraction of this oil, in addition to the acids extracted from the seeds.
Fiber
Total fiber contents (soluble fiber + insoluble fiber, Tab. 1) of leaf samples were 15.97% and 16.46% for the states of Sonora and Guerrero, respectively. The results are within the range (16% to 24%) reported by Aree and Jongrungruangchok (2016) in MO leaves from Thailand, and they are also similar to the 19.2% reported by Dhakar et al. (2011) in samples from Pakistan. However, fiber contents in MO leaves were lower than the percentages reported by Guzmán-Maldonado and Fuentes (2015) and Sánchez-Machado et al. (2010), who mention values of 27.8% and 30.97%, respectively in MO leaves from the regions of Sonora and Guanajuato, Mexico. The percentage of fiber in MO leaves is high when compared to foods such as spinach (2.2%), cabbage (2.5%), chard (1.6%) and artichoke (5.4%) that are commonly recommended due to their high fiber content (Titchenal and Dobbs, 2005).
The fiber content in MO seeds was 6.81% in samples from Sonora and 9.02% in those obtained from Guerrero. These results are similar to the 9.0% reported by Anwar et al. (2006), and they are also within the range of 5.6% to 7.5% mentioned by Anwar and Bhanger (2003). Anudeep et al. (2016) point out that MO seeds have a high potential for food applications due to their high content of total dietary fiber (33%) and a high percentage of soluble fiber (6.5%). The parts with the highest fiber percentage were the seed shells with values of 45.84% for Sonora and 50.03% for Guerrero. Seeds have higher fiber contents compared to MO pods (39.2%) and cortex (33.1%), according to the data reported by Abdulkadir et al. (2016). The seed fiber contents are also similar to the fiber content (46.78%) reported by Sánchez-Machado et al. (2010) for MO pods in samples from Sonora, Mexico. Ali and Kemat (2017) used MO seed shells to obtain bioethanol due to their high content of lignocellulosic material. Warhurst et al. (1997) obtained activated charcoal with MO seed shells because of their high content of lignocellulose. These are the only applications performed to MO seed shells, and there are not many studies proposing an integral use of them.
The flower samples from the state of Guerrero showed a fiber content of 12.25%. This value is lower than that reported by Sánchez-Machado et al. (2010) of 32.45%. There are only a few reports that show the percentage of fiber in MO flowers. However, the percentages of fiber present in the Jamaican flower (8.5-12.0%) are similar to those obtained in the MO flowers, which makes MO a feasible alternative for adding crude fiber in the diet (Sáyago-Ayerdi and Goñi, 2010).
Carbohydrates
Moringa oleifera leaves had carbohydrate contents of 41.58% and 48.45% in the regions of Sonora and Guerrero, respectively (Tab. 1). Sánchez-Machado et al. (2010) report 35.3% in leaves collected from Sonora, Mexico and studies report lower values than those obtained in the present research. However, Toro et al. (2016) mention values of 52.10% of carbohydrate content for MO leaves grown in the region of Bolivar, Colombia.
The percentage of carbohydrates in MO seeds obtained from Sonora showed a value of 8.45%, while those obtained from Guerrero showed a value of 5.82%. These results are similar to the ones obtained by Olagbemide and Alikwe (2014) (8.67%) in seeds of MO cultivated in Ibadan, Nigeria. However, the results differ from the values of carbohydrate percentages reported by Aja et al. (2013) (18%) in seeds collected from Ebonyi, Nigeria. The highest percentage of carbohydrates reported for MO seeds were 40% in samples collected in the region of Irene, Pretoria, South Africa (Mabusela et al., 2018), which differs from that obtained in the present work. These differences could be attributed to the different planting regions and crop conditions.
On the other hand, MO seed shells show carbohydrate contents of 31.28% in samples from Sonora and 26.93% in samples from Guerrero in Mexico. Abdulkadir et al. (2016) mention values of 26.9% of carbohydrates in the cortex and Sánchez-Machado et al. (2010) report carbohydrate values of24.98% in MO seed pods. It is important to mention that there are no previous reports of carbohydrate analysis for MO seed shells; however, these results are similar to the ones obtained for seed pods and cortex.
For the percentage of carbohydrates in flowers, samples from Guerrero showed 57.88%. This value is higher than the one reported by Sánchez-Machado et al. (2010) (36.04%) and lower than the one indicated by Arise et al. (2014) (66.45-73.25%) in MO flowers collected in Kwara, Nigeria. MO flowers show a higher content of carbohydrates compared to the leaves, consistent with that reported in previous studies by Sánchez-Machado et al. (2010). A variation in the carbohydrate content related to the sowing region is notable in all the analyzed parts of the plant, and this is attributable to the geographical area of sowing, the time of cultivation, and the availability of water and fertilizer, since they are the main factors affecting the nutritional characteristics of the plant (Velázquez-Zavala et al., 2016).
Phenolic compounds
Results obtained for total phenols, tannins and flavonoids of the different parts of the MO plant are shown in Table 2. Moringa oleifera flowers showed the highest concentration of total phenols (1908.71 mg GAE 100 g-1). The results were similar to the value reported by Alhakmani et al. (2013) (1931 mg GAE 100 g-1) in MO flowers from Al Batinah, Oman. However, the obtained values differ from the results reported by Pakade et al. (2013) (2970 mg GAE 100 g-1) for MO flowers from Limpopo and Atteridgeville, South Africa.
TABLE 2 Content of phenolic, tannins, and flavonoids in the different structures of Moringa oleifera.
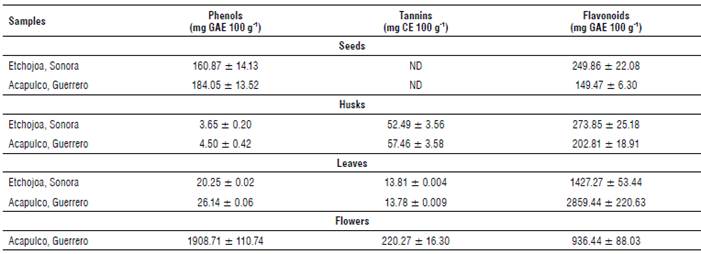
GAE - Gallic Acid Equivalents; CE - Catechin Equivalents.
When comparing these results to other edible flowers, values are similar to those found in Calendula officinalis (120-150 mg GAE 100 ml-1) (Alhakmani et al., 2013) and Hibiscus sabdariffa (2400 to 10,000 mg GAE 100 g-1) (Fernandes et al., 2017). Likewise, MO flowers showed the highest concentration of condensed tannins (220.27 mg CE 100 g-1); however, contents are lower than those reported for linden flowers (19.5 g GAE 100 g-1 of extract) and Crataegus monogyna flowers (11.5 g GAE 100 g-1 of extract), which are consumed as medicinal plants (Ropiak et al., 2016). The anti-nutritional nature of tannins due to their capacity to form insoluble complexes with proteins and carbohydrates (Chaparro et al., 2009) does not impede the consumption of MO flowers as food or herbal remedies since flowers do not provide important quantities of these compounds.
Regarding the results of flavonoids, MO leaves collected in Guerrero showed the highest values (2859.44 mg GAE 100 g-1). They were twice as high as those obtained from leaves from Sonora (1427.27 mg GAE 100 g-1). Cabrera-Carrion et al. (2017) studied the effect of age and height on the concentration of flavonoids in MO leaves and found values from 1183 to 3485 mg 100 g-1, which are similar to the values obtained in leaf samples from both states. The flavonoid differences between the evaluated states can be attributed to conditions such as age, height and geographical region. Furthermore, the results are comparable to previous studies reporting a high content of phenolic compounds and flavonoids in MO leaves (Gopalakrishnan et al., 2016; Cabrera-Carrion et al., 2017).
Antioxidant capacity
TEAC and ORAC
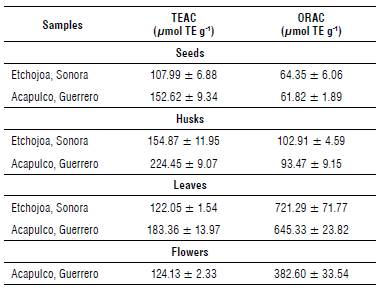
These methods were used to quantify the antioxidant capacity of different MO parts and their results are shown in Table 3. TEAC showed the highest antioxidant capacity in MO husk collected in Guerrero (224.45 μmol Trolox Equivalents (TE) g-1), while ORAC indicated that MO leaves from the region of Sonora showed the highest antioxidant capacity (721.29 umol TE g-1). These results suggested that there is no correlation between the TEAC and ORAC methods. Variations in results between these two methods are attributed to the different antioxidant compounds contained in samples since they have different kinetics and reaction mechanisms (Zulueta et al., 2009). The antioxidant capacity of MO leaves is related to that reported by Guzman-Maldonado and Fuentes (2015) and Cuellar-Nunez et al. (2018) who obtained values of 500.02 μmol TE g-1 and 636 μmol TE g-1, respectively. MO leaves show higher antioxidant capacity compared to epazote (31.5 μmol TE g-1), oregano (25 μmol TE g-1) and parsley (60 μmol TE g-1) (Mercado-Mercado et al., 2013).
Principal component analysis (PCA)
The three principal components (Eigenvalues) explain 90.3% of the total variation; the first component represents a separate variance of37.84%, while the second component represents 34.79%, and the third one a total of 17.67%. These main components contributed with the greatest influence (Tab. 4).
TABLE 4 Eigenvalues and explained variance of the principal component analysis (PCA) using 13 biochemical variables on different structures of Moringa oleifera.
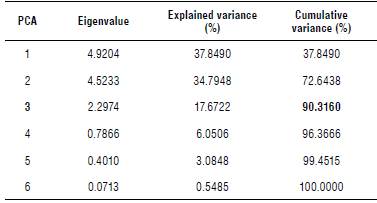
The value In bold represents the cumullve variance (%) ≥90%.
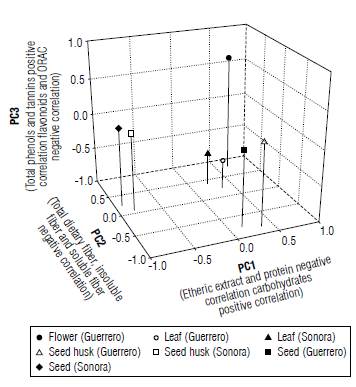
Moreover, each of the main components refers to different variables (Eigenvectors); component one (main) is composed of the ethereal extract variables with -0.9860, carbohydrates 0.9142 and protein -0.8746, whereas component two is represented by dietary fiber which showed a value of-0.8849, insoluble fiber -0.790 and soluble fiber -0.895 (Fig. 2). Component three is made up of up to four variables representing the highest phenols with 0.7021, tannins 0.7083, flavonoids -0.6598 and antioxidant capacity determined by the ORAC method with -0.6319 (Tab. 5). There was a difference between the different parts of the plant; nevertheless, there are only minor changes between regions. Seeds are the part that showed greater differences compared to leaves, husks and flowers.
TABLE 5 Eigenvectors and cumulative variance (%) of the analysis of the principal component analysis (PCA) using 13 biochemical variables on different structures of Moringa oleifera.
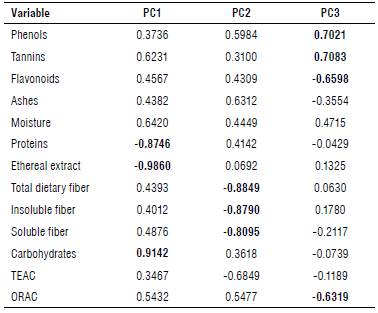
TEAC - Trolox Equivalent Antioxidant Capacity; ORAC - Oxygen Radical Absorbance Capacity.
Values In bold represent the significant correlations between the principal components and the variables.
Conclusions
The different parts of MO analyzed showed differences in the proximal composition and functional compounds as phenols, flavonoids and tanins. However, the comparative analysis (principal component analysis, PCA) did not show important differences between the samples obtained from the States of Guerrero and Sonora. The companies in Mexico that market products of the MO plant can get it from both regions and so they treat them as similar. MO seeds and flowers could be an alternative to enriched foods (wheat flour or cereals) due to their high protein values. The use of MO flowers could be recommended as an antioxidant supplement due to their high values of phenols and flavonoids. These values are even higher than the ones observed in leaves, which are currently the most commercialized part of the MO plant.

