


 English (pdf)
 Article in xml format
 Article references
 Send this article by e-mail
 Cited by SciELO
  Cited by Google
  Similars in
SciELO
Similars in
SciELO  Similars in Google
 Permalink
Introduction
Bananas (Musa, Musaceae) represent an important role in the diet of millions of people in the tropical and subtropical regions of the world, and they are a staple food that contributes to food security and the reduction of malnutrition (Oyeyinka & Afolayan, 2019). This crop is considered to have some of the best phytochemical characteristics with rich sources of minerals, vitamins, carbohydrates, flavonoids, and phenolic compounds (Kookal & Thimmaiah, 2018). The consumption per capita of bananas varies between 50 and 150 kg, reaching 400 kg in the producing continents such as Africa (Brito et al., 2015). The largest banana producer worldwide is India, while Colombia was ranked 11th among producers worldwide for the year 2019, with a production of 2.9 million t (FAOSTAT, 2020).
The technical management of fertilization in banana export production could represent approximately 40% of the production cost and is one of the most representative (Torres-Bazurto et al., 2019). Several factors condition the absorption of mineral nutrients by the plants in which we can find physical-chemical properties of soil and physiological conditions associated with the plant phenological stages. Additionally, the distribution of assimilates towards the bunches plays an essential role (Espinosa & Mite, 2002), where it is important to highlight the decrease in root formation in the post-flowering stage (Galan et al., 2018).
Nitrogen fertilization of bananas in the Caribbean region far exceeds the necessary amount that the crop extracts from the soil since other sources from which this element may come are not considered (Dorel et al., 2008). The response of the banana crop to N fertilization is multifactorial and, therefore, the N content in soil, the dose, the source, and the time of N application are relevant to satisfy the needs of the plants and to guarantee optimal yield and quality of the commercial product (Sun et al., 2020). Within perennial crops, antagonistic and synergistic relationships between nutrients can often be observed that are reflected in the yield (Espinosa & Mite, 2002). Regarding the relationship between K, Ca, and Mg in banana, when any of these elements is in high proportions, the absorption of other elements is reduced (IPNI, 2015a). Despite the above, there is very little information on the relevant results about the different associations between elements. There are approximately 200-300 banana cultivars; therefore, information on the nutrient aspects for growing cultivars on a large scale (such as Williams) are of the utmost importance (Ashokkumar et al., 2018). This study sought, as a general objective, to evaluate the effect of N doses on the relationships between the mineral nutrients in the bunches of Williams banana during two production cycles in the Uraba region of Colombia, in order to adjust recommendations of N doses according to the needs of the plants.
Materials and methods
Location, plant material, and treatments
The study was carried out in the Uraba region in the department of Antioquia (Colombia), in the experimental field of the company Augura (municipality of Carepa), located at 7°46'46" N and 76°40'20" W at 20 m a.s.l. The soils of the study were classified according to the USDA taxonomic classification as fine Fluventric Eutrudepts, clay loam over clay Fluvaquentic Eutrudepts, and fine loam Vertic Endoaquepts (IGAC, 2007).
The climatic conditions at the study site were the following: mean relative air humidity of 87%, maximum air temperature of 32.3°C, minimum air temperature of 23.2°C, and mean air temperature of 26.7°C (regional mean is 27°C). The mean solar brightness was 5 h per d for a total of 1,700 h per year. The mean annual precipitation was 845 mm during the first production cycle (from August 2011 to April 2012) and 2,088 mm for the second production cycle (from February to December 2012). Each production cycle lasted 10 months.
A banana (Musa AAA Simmonds cv. Williams) crop of giant Cavendish subgroup, Williams clone, was used with a mean plant height of 3.5 m. This is one of the two most cultivated clones for export (Robinson & Galán Saúco, 2012). A sixth-generation banana plantation was used.
Fertilization plans were established as recommended by Cenibanano in the Uraba area, based on the soil analyses carried out and the proposals of Sánchez Torres and Mira Castillo (2013) who recommend not applying Fe, Mn and Cu since the soils contain these elements in appropriate quantities. The N doses (kg ha-1) were as follows: 1) absolute control without fertilization; 2) 0; 3) 161; 4) 321.8, and 5) 483. All treatments, except the absolute control, received the following fertilization (kg ha-1): 87.1 P2O5, 678.8 K2O; 50.5 CaO; 117.5 MgO; 64.2 S; 1.4 B; and 9.3 Zn. The sources of the mineral fertilizers were as follows: urea (46% of N), KMag (22% K2O, 18% MgO, and 22% S), fertiboro (10% B), solufos (30% P2O5, 36% Ca, 5% S, and 8% Si), ZnO (80% Zn), potassium sulfate (50% K2O and 18% S), and KCl (60% K2O).
Four replicates (blocks) were established per treatment and the treatments were randomized. Each of these replicates (blocks) was distributed according to the types of soil in the experiment. Each treatment corresponded to the area units, called "botalones". Each "botalon" had an area of 1,563 m2 and 250 banana plants, of which 15 plants were selected with a height between 1.0 m and 1.5 m. These plants formed an experimental unit and were evaluated according to the number of weeks and growth stages of development (Tab. 1).
TABLE 1 Sampling times of banana cv. Williams according to the number of weeks and stages of development.
| Phase of growth | Sampling time | Weeks of growth from sucker emergence |
|---|---|---|
| Productive | Bunch filling | 43-44 |
| Productive | Harvest | 50-51 |
The agronomic management in the area was similar to that of the commercial banana plantations in the Uraba region, except for the doses of fertilizers. Fertilizer doses were divided within each production cycle for a total of 17 fertilizer applications per year, with approximately 3 weeks between applications. The sampling time was selected considering the phase and the development time of the plant, with at least two weeks after the application of the respective fertilizer dose.
Production variables
The following production variables were measured in the bunch in the last two selected stages of development.
Banana bunch dry mass (BDM): the whole bunch was weighed fresh, taking the rachis on top of the first hand until the last scar, packing 300 g in a paper bag. The total dry weight was obtained using a rule of three, relating the total fresh weight to the fresh and dry weight of the sample.
The number of hands (NHPB) and total number of fingers per bunch (TNFB) were counted before separating the rachis from the fruits.
The average number of fingers per bunch (ANFB) was determined by averaging the TNFB of each of the treated samples.
For the fruit sample, the two central fingers of hands 1, 3, and 5 were selected since they are the ones used to measure the commercial quality of bananas in the study area, separating the peel from the pulp from the six fingers, weighing them separately, and packing them in paper bags.
Subsequently, we sent pulp and peel separately to the Soil and Water Laboratory of the Faculty of Agricultural Sciences of the Universidad Nacional de Colombia, Bogota campus, to determine their mineral nutrient content. We determined the total N, P, Ca, K, Mg, Cu, Fe, Mn, Zn and B concentrations in pulp and peel using the methodology of IGAC (2006). For S concentration, we used the method described by Tabatabai and Bremner (1970).
Finally, we added the concentrations of the elements in pulp and peel to obtain the total concentration of the fruit that was the one used in this study.
Statistical analysis
We performed statistical analyses using both descriptive and inferential procedures. Regarding the descriptive methods, the averages of the variables obtained were used to generate tables and combined line and bar diagrams for the variables derived from the different procedures performed. As for the inferential method, we used a principal component analysis (PCA) to decrease the dimensionality of each of the nutrients associated with the bunch, regardless of the experimental design used. This relates variables that obtained a similar trend across the components and/ or a high degree of significance in any of the components shown in the rotated component matrix using the Varimax method with Kaiser normalization (Kaiser, 1958; Aldás & Uriel, 2017).
We obtained possible relationships between bunch nutrients considering what models were generated based on linear regressions by corroborating their relationship (synergistic or antagonistic). After this, we sought to associate the available production variables with the nutrient relationships found, following the same procedure mentioned above. The relationship between the different responses and the different levels of the factors was modeled using a linear model. Such a model was associated with the design of repeated measures with a factor between subjects (N dose), depending on the effect of the blocks (fixed factor) and an intra-factor-subject (production cycle). The data were processed by the SPSS 23 program (IBM Corp., Armonk, NY, USA), the free software Rstudio, and the MS Excel 2017 program (Microsoft Office Inc., Seattle, WA, USA).
Results and discussion
Statistical analysis of nutrient relationships
We analyzed the results obtained in the rotated component matrix from the PCA (Tab. 2), decreasing the dimensionality of the data.
TABLE 2 Principal component matrix rotated for the nutrient contents in banana bunches.
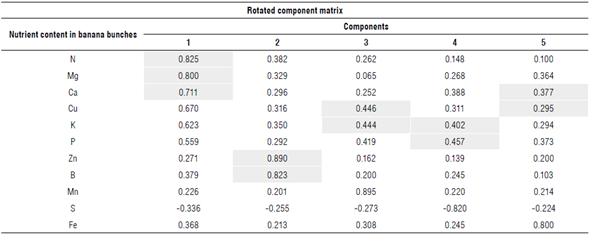
Highlighted values have a component greater than 0.7 and/or a similar trend.
Data were chosen so that any of the components was greater than 0.7 and/or had a similar trend. Although the analysis indicates that only one of the components should be used since it is the one that explains most of the variability of the data (75.395%), five components were considered to facilitate the analysis.
We found significance in the first component of N (0.825), Ca (0.800) and Mg (0.711), in the second component of Zn (0.890) and B (0.823), and trends of similar and near increase through the components of K and Cu, K and P, Ca, and Cu.
Linear regression models of each of the interactions mentioned above were proposed and, from them, we determined whether the relationship was antagonistic or synergistic. Since there were two independent variables, in the case of Mg, Ca, and N, the model with the lowest variance inflation factor (VIF) was used to avoid collinearity of the data. Also, linear equations were generated to give a glimpse of the relationship obtained.
Mg:Ca+N ratio in the fruits
As for the Mg:Ca+Mg ratio, the model with Ca and N as predictors had an adjusted R squared of 0.859, which indicated a high positive correlation (synergy) between Ca and N (independent), and Mg (dependent), as Equation 1 shows:
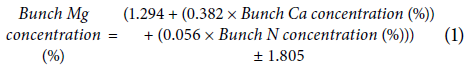
Calcium has structural characteristics in plant cells because it is a fundamental part of cell walls and membranes; therefore, it is essential for plant growth and fruit development (Díaz et al., 2007). The allocation of Ca occurs unevenly within the reproductive organs due to the rate of expansion of the fruit and the distribution of the vascular bundles. In bananas, the allocation of Ca occurs in the central area of the convex part of the fruit, where the nutrient deficiencies of Ca manifest themselves. Magnesium is essential for plant nutrition since it participates in various metabolic functions. Its deficiency accelerates premature ripening and, in certain cases, causes the abortion of fruits before reaching their physiological maturity (Marschner, 2012). Nitrogen has a great influence on the flowering and fruiting processes and is directly related to crop yield. Its deficiencies are associated with decreased BDM (Sun et al., 2020).
The ratio between Ca and Mg has been widely documented since they are cationic bases. If they are balanced in the soil, no imbalance will occur that negatively affects the intake of the other elements (White & Brown, 2010). Due to the low mobility of Ca in the phloem, it is not well redistributed from the leaves to the bunches. There is a very important relationship of Ca with mobile elements due to its structural functions that guarantee the post-harvest quality of the fruit. On the other hand, N and Mg have greater phloem mobility in the plant than Ca that favors their accumulation in the bunches due to the filling process and their role in the functioning of the enzymes necessary for fruit formation.
Zn:B ratio in the fruits
The regression model used for the Zn:B ratio had an adjusted squared R of 0.747, indicating a high positive correlation between Zn and B (synergy), given by the following equation:

In bananas, B is essential for the functioning of the plasma membrane since this nutrient is involved in the activity of the enzyme ATPase, while Zn plays an important role in redox reactions as part of the superoxide dismutase, promoting the protection of the membranes, interfering in the oxidation of NADPH and radical removal. Boron deficiency in some plant tissues promotes a decrease in ATPase activity and its ion absorption rate, while high amounts of this element are toxic to bananas. Zinc plays a fundamental role in decreasing the accumulation of B, reducing its negative effects (Kirkby & Romheld, 2008a; 2008b; Sánchez Torres & Mira Castillo, 2013). Plants fertilized with the supplement of Zn and B obtained 400 commercial boxes of fruits (41 lb) ha-1 per year (IPNI, 2015b). This value is far higher than that obtained from plants under basic recommended fertilizer management.
K:Cu ratio in the fruits
The regression model used for the K:Cu ratio had an adjusted R squared of 0.848, with variables positively correlated with each other indicating their synergy (Eq. 3).

Potassium plays a fundamental role in various metabolic processes, including photosynthesis and respiration. The accumulation of K in banana fruits varies between 21% and 24% at the stage of harvest in the bunch for the Prata variety, because of the source-sink relationship (Deus et al., 2020). Copper in banana plants is part of the enzymatic processes involved in respiration and photosynthesis. Also, Cu-related proteins participate in lignification, anaerobic metabolism, cellular defense, and hormonal metabolism (Espinosa & Mite, 2002).
Jivan and Sala (2014) found a high correlation (R2 = 0.702) between the contents of K and Cu in apple trees as observed in this study. However, there is no explanation for the ratio. On an equivalent chemical basis, plants tend to maintain constant amounts of total cations, a fact that leads to very complex nutrient relationships that are not characterized (Ranade-Malvi, 2011). Still, the K:Cu ratio is associated with the plant's defense system.
K:P ratio in the fruits
The K:P ratio has an adjusted R squared of 0.904 and the variables are positively correlated with each other, indicating that there is synergy between them (Eq. 4).

K is very important for the growth and development of bananas due to its multiple functions, but P is relevant at the morphological and root levels. Likewise, P is a component of ATP, necessary in various reactions at the molecular level, such as photosynthesis, respiration, and carbohydrate metabolism (Leonel et al., 2020). It is also related to the flowering and fruit formation (Marschner, 2012).
Both K and P tend to accumulate (24% and 35%, respectively) in the bunch at the harvest stage, showing a strong correlation in their accumulation (Deus et al., 2020). In oil palms, K and P tend to accumulate up to 45% in bunches, showing a synergistic relationship like in this study (Herrera Peña, 2015). We can infer that the ratio of these two nutrients affects the formation and filling of the bunch, due to their metabolic role.
Ca:Cu ratio in the fruits
The regression model used for the Ca:Cu ratio has an adjusted R squared of 0.788, explaining that the variables are positively correlated (synergy) (Eq. 5).

In oil palms, Cu shows the highest accumulation in the bunch among all micronutrients; approximately 46% of the total Cu absorbed is concentrated in this organ (Owen, 1992). This behavior is similar to that shown by Ca whose accumulation amounts to 25%, demonstrating that both nutrients tend to accumulate in the bunch efficiently and synergistically, perhaps associated with structural and defense functions.
Influence of N doses on nutrient relationships in the fruits
For the filling stage, the multivariate analysis showed differences between cycles (P<1.407e-09), treatments (P<0.01220) and in the cycle*treatment interaction (P<0.01674). In contrast, in the univariate analysis the only ratio that generated differences for the factor treatment was the Mg:Ca+N ratio (P<0.0811). Therefore, multiple comparison tests were carried out, demonstrating a significantly greater effect in the dose with 0 kg N ha-1 than in the treatment with 483 kg N ha-1, while in the other treatments there were no significant differences.
During the harvest stage, the multivariate analysis showed differences between cycles (P<0.002867), treatments (P<0.001595) and the cycle*treatment interaction (P<0.006214). Regarding the univariate analysis, differences were observed for the Mg:Ca+N (P<0.0005091) and K:P (P<0.01723) ratios. Therefore, multiple comparison tests were performed finding that for Mg:Ca+N a significant difference was observed between the treatment with 0 kg N ha-1 and the other treatments (absolute control without fertilization and the doses with 161, 321.8, 483 kg N ha-1).
While the K:P ratio was influenced by the N content, showing differences between the treatments of 0 and 483 kg N ha-1, there were no differences between the other treatments.
The trends found in the Mg:Ca+N ratio in both stages are due to the fact that the accumulation of N shows an increase according to the dose used. This agrees with data by Keshava and Iyengar (2000), who find high levels of N accumulation in the Robusta banana when a higher dose of N was used.
The K:P ratio was explained by the increasing N fertilization levels and, as a result, the absorption of all nutrients together was expected to be more efficient and balanced. This agrees with a report by Sun et al. (2020), who state that the higher the amounts of metabolized nitrate, the higher the concentration of nutrients such as N, P, and K.
The other nutrient relationships were not negatively or positively affected by N doses in the two phenological stages studied.
Statistical analysis of the interaction between the nutrient relationships and production variables
From the PCA, the results obtained in the rotated component matrix (Tab. 3) were processed, reducing the dimensionality of the data. Any of the components considered was greater than 0.7.
TABLE 3 Rotated principal component matrix of the proposed nutrient relationships and production variables of banana bunches.

NHPB - Number of hands per bunch; TNFB-Total number of fingers per bunch; ANFB - Average number of fingers per bunch; BDM - Bunch dry mass. Highlighted values have a component greater than 0.7.
As the analysis indicated, three components were used since these explained most of the variability of the data (71.994%).
Significance was found in the first component of the K:Cu (0.942) and K:P (0.818) ratios and of the production variable BDM (0.855). There were no significant variables in the second component, while in the third there was significance for the variables TNFB (0.845) and ANFB (0.820). Despite this, these variables were not considered to continue the analysis because they were not associated with a ratio.
As shown in Figure 1, the comparison between CP1 and CP2 and CP3 showed there was a relationship between the variables K:P, K:Cu and BDM. Regarding the comparison between CP2 and CP3, although K:P and BDM are in the same quadrant, K:Cu is a little further apart despite having the same trend. This is explained because CP1 explains most of the variability of the data.
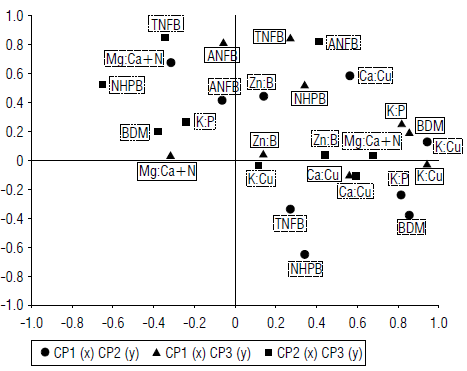
FIGURE 1 Comparison between the three components that explained most of the data variability of the proposed nutrient relationships and production variables of banana bunches.
Therefore, the comparison between CP2 and CP3 does not reflect a spatial distribution as marked as the comparison between CP1 and CP2 and CP3.
A linear regression model was performed between the significant variables of the first component (BDM, K:Cu, K:P) to observe their relationship. A model was obtained with a variance inflation value (VIF) of <10, showing low data collinearity.
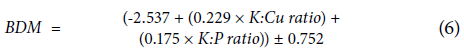
Interaction between BDM and K:Cu and K:P ratios
The association of the K:Cu and K:P ratios with the BDM production has an adjusted R squared of 0.713 showing a direct correlation between the variables (Eq. 6).
For the filling period, the multivariate analysis showed differences between cycles (P<9,128e-05), treatments (P<0.0002102) and the cycle*treatment interaction (P<0.0020895). Regarding the univariate analysis of the K:Cu+K:P regression model, no significant differences were obtained, but for the BDM they were found between treatments (P<1.69e-05).
The greatest accumulation of BDM was obtained in the 321.8 and 483 kg N ha4 N treatments for the bunch filling stage (Fig. 2A). At the harvest stage, there was an increasing trend despite not showing significant differences between treatments (Fig. 2B).

FIGURE 2 Influence of different nitrogen doses on the bunch dry mass (BDM) and the K:Cu+K:P model at the phenologlcal stages of A) bunch filling and B) harvest.
At both stages, a similar behavior of the K:Cu+K:P model and the BDM was observed, with a tendency of the two variables to be greater according to the increase in the N dose. This was because N is involved in plant growth, development, and dry mass production (Yang et al., 2013). Greater amounts of metabolized nitrate increase the concentration of other nutrients that, in the case of K, Cu and P, are involved in different metabolic processes that promote the formation of fruits and their subsequent filling (Espinosa & Mite, 2002; Sun et al, 2020).
Proposed ranges for the K:Cu+K:P model, relative to the BDM
The general behavior of K implies a considerable translocation towards the bunch after the flowering stage because of fruit filling (Torres Bazurto et al., 2017). Banana plants do not require a large dose of P compared to the other primary macronutrients. However, continuous extraction of P after flowering is required, intervening in fruit formation (Leonel et al., 2020).
Regarding Cu, the content of this element in the soils was sufficient for the development of the crop, which influenced the effect of the K:Cu ratio with an increase in BDM. This is because Cu plays a fundamental role as a co factor of various enzymes and is part of the metabolism of carbohydrates in the plant (Espinosa & Mite, 2002).
Higher accumulations of K together with P and Cu resulted in a greater amount of BDM, both for the filling and harvest stages (Tab. 4).

Conclusions
A significant and synergistic relationship was found between mineral nutrients, with the main ones being Mg:Ca+N; Zn:B; K:Cu; K:P, and Ca:Cu. However, the Mg:Ca+N; Zn:B and Ca:Cu ratios in the fruits showed no effect on production variables of Williams bananas.
The high doses of N showed that the nutrient relationships in the fruits that influenced the production were those of K:P and K:Cu.
The proposed ranges of the interaction K:Cu+K:P can be used to make comparisons with data obtained from nutrient analyses of banana cv. Williams bunches to determine their nutrient status in relation to their dry matter content, finding possible problems in the accumulation of K, P or Cu. This becomes a useful tool for planning and decision making in mother plants or their suckers.

