


 English (pdf)
 Article in xml format
 Article references
 Send this article by e-mail
 Cited by SciELO
  Cited by Google
  Similars in
SciELO
Similars in
SciELO  Similars in Google
 Permalink
Introduction
The cowpea [Vigna unguiculata (L.) Walp.] represents one of the most relevant and strategic food sources for the tropical and subtropical regions of the planet. In Brazil, the cultivation of cowpea has traditionally been concentrated in the Northern and Northeastern regions. However, it has been expanding to other regions, mainly to the Midwest, due to its wide adaptability to tropical conditions, low production costs, and intense breeding approaches applied to the cultivation (Freire Filho et al., 2011).
The cowpea breeding programs are usually based on the selection of parents followed by hybridization to form a base population and an advanced generation. This occurs with simultaneous selection of more than one characteristic, such as productivity, size, resistance to pests and diseases, and grain quality (Bertini et al., 2009). Therefore, the previous characterization of the available germplasm becomes indispensable since it allows the breeder to explore the existing genetic diversity and evaluate its potential for use in the breeding program (Oliveira et al., 2017).
Studies on genetic divergence are relevant because they provide estimates for the correct choice of parents that, when crossed, result in a high heterotic effect on the progenies, maximizing the chances of obtaining superior genotypes for the characters of interest (Rotili et al., 2012). In this sense, several multivariate techniques can be applied in the study of genetic divergence. Among them, the most used are those involving canonical variables and main components, in addition to the grouping methods, whose application depends on the calculation of the previously estimated dissimilarity measures (Cruz et al., 2014).
In recent years, several authors have evaluated genetic divergence in cowpea (Santos et al., 2014; Sousa et al., 2017; Santana et al., 2019). For example, Santana et al. (2019) evaluated the genetic divergence between cowpea genotypes by morpho-agronomic traits in the state of Pernambuco, and they found that the combinations Pitiúba x Cabeçudo and Pitiúba x Manteiga could result in hybrids with greater heterotic effect. Santos et al. (2014) evaluated the agronomic performance and genetic divergence between cowpea genotypes grown in the Cerrado/Pantanal ecotone region. They found that the crossings of MNC03 737F 5 4 with MNC03 725F 3 and MNC03737F 5 11 obtained promising populations in terms of grain productivity.
Hence, this research aimed to evaluate and quantify the genetic divergence between 76 cowpea accessions to identify the characters that most contribute to an efficient selection of superior parents.
Materials and methods
Plant material and experiment site
Seventy-six cowpea accessions from the Germplasm Active Bank of the Federal University of Ceará (BAG/UFC) were evaluated (Tab. 1). The group of genotypes used in this study was chosen due to the great genetic variability and potential for use in breeding programs, observed during activities routinely developed at the BAG related to cowpea, such as seed multiplication and regeneration. The test was carried out in an experimental field belonging to the BAG/ UFC, located in Fortaleza-CE (03°44' S, 38°34' W, and altitude of12 m a.s.l.). According to the Köppen and Geiger methodology, the region's climate is of the tropical Aw type, with an average annual temperature and precipitation of 26.3 ± 1.7°C and 1,448 mm, respectively.
TABLE 1 Genotypes of cowpea from the Active Germplasm Bank of the Federal University of Ceará.
| N° | Register | Accession name | N° | Register | Accession name | N° | Register | Accession name |
|---|---|---|---|---|---|---|---|---|
| 1 | CE-07 | Das Almas | 27 | CE-117 | Iron K-892-C15-63 | 53 | CE-229 | Chiapas-277 |
| 2 | CE-14 | Potomac | 28 | CE-119 | Selected from CE-31 | 54 | CE-230 | Progresso-66 (grená) |
| 3 | CE-27 | Quem-Quem | 29 | CE-124 | Selected from CE-92 | 55 | CE-243 | Malhado Preto |
| 4 | CE-28 | Cacheado | 30 | CE-131 | TVu 106 | 56 | CE-252 | TVu 179-P1 |
| 5 | CE-30 | Galanjão | 31 | CE-133 | TVu 756 | 57 | CE-262 | TVu 381 |
| 6 | CE-32 | Pitombeira | 32 | CE-135 | TVu 793 | 58 | CE-465 | TVu 2934 |
| 7 | CE-33 | José do Santo | 33 | CE-136 | TVu 1015 | 59 | CE-578 | CE-578 |
| 8 | CE-44 | Novato | 34 | CE-137 | TVu 1204 | 60 | CE-599 | Selected from CE-394 |
| 9 | CE-46 | Milagroso | 35 | CE-139 | TVu 1233 | 61 | CE-646 | BR3-Tracateua |
| 10 | CE-48 | Selected from CE-42 | 36 | CE-140 | TVu 1240 | 62 | CE-656 | CNCx 188-13-1E/P |
| 11 | CE-51 | Selected from CE-13 | 37 | CE-141 | Selected from CE-134 | 63 | CE-726 | CNCx 658-26E |
| 12 | CE-52 | CE-52 | 38 | CE-143 | Selected from CE-48 | 64 | CE-895 | CNCx 333-33E |
| 13 | CE-53 | Selected from CE-13 | 39 | CE-148 | TVu 1248 | 65 | CE-899 | CNCx 333-38 E |
| 14 | CE-54 | Selected from CE-13 | 40 | CE-156 | TVu 1593 | 66 | CE-924 | Epace 11-Jaguaribe |
| 15 | CE-58 | IR-58.71 | 41 | CE-160 | TVu 1976 | 67 | CE-931 | Selected from CE-10 |
| 16 | CE-62 | Selected from CE-1 | 42 | CE-161 | TVu 1977 | 68 | CE-935 | BRS Gurgueia |
| 17 | CE-69 | Selected from CE-1 | 43 | CE-162 | TVu 1981 | 69 | CE-936 | Canapuzinho |
| 18 | CE-74 | Praiano | 44 | CE-171 | TVu 4279 | 70 | CE-938 | BRS Paraguaçu |
| 19 | CE-83 | Azulão-2 | 45 | CE-175 | TVu 4369 | 71 | CE-959 | BRS Potiguar |
| 20 | CE-90 | Ferrugem | 46 | CE-181 | Caupi Branco | 72 | CE-960 | TVu 379 |
| 21 | CE-91 | TVu 966 | 47 | CE-190 | Costa Rica V-11 | 73 | CE-962 | - |
| 22 | CE-101 | Hagreen-66 | 48 | CE-191 | Costa Rica V-12 | 74 | CE-967 | TVu 382 |
| 23 | CE-102 | 7907-Purple Hull | 49 | CE-192 | Costa Rica V-15 | 75 | CE-970 | - |
| 24 | CE-105 | Clay-23 | 50 | CE-194 | Costa Rica V-39 | 76 | CE-971 | - |
| 25 | CE-106 | Australia-67 | 51 | CE-196 | Costa Rica V-43 | |||
| 26 | CE-108 | Mississipi Silver-24 | 52 | CE-226 | Guerrero-109 |
Experiment conditions
Each genotype was distributed in a 5.0 m long row, with 0.5 m spacing between plants. Sowing was carried out using three seeds per hole. Fifteen days after planting, thinning was performed, leaving the most vigorous plant in each hole, with 10 plants per genotype. To avoid possible crossings between the different accessions, the spacing adopted between rows was 2.0 m. At the time of sowing, fertilization was carried out with the commercial fertilizer NPK (0414-08), following the recommendations for the crop. The fertilizer was applied in furrows located next to the planting pits. The control of weeds, pests, and diseases was carried out according to the needs observed in the field.
Variables analyzed
The qualitative descriptors evaluated throughout the crop cycle were seedling pigmentation, flower color, inflorescence type, growth habit, central leaflet shape, plant size, pod position, pod color, pod shape, grain color, grain shape, seed brightness, seed texture, and resistance to diseases caused by viruses. For this last descriptor, a visual analysis of the plants was performed to detect the characteristic symptoms of Cowpea severe mosaic virus (CPSMV), the main pathogen of the crop (Lima et al., 2012). All plants were classified for possible resistance/susceptibility based on a scale ranging from 0 to 4, where a score of 0 was assigned for absence of symptoms and scores of 1, 2, 3 and 4 for 25, 50, 75 and 100% of plants with typical symptoms of these viruses, respectively.
The following quantitative characters were evaluated: initial flowering (IF), pod length (PL), number of grains per pod (NGP), the mass of 100 grains (M100G), and cycle. The statistical analysis was carried out with all the characters (14 qualitative and 5 quantitative), which were converted into multi-categorical variables.
The following variables were also collected: average number of days from emergence to full flowering (NDEFF), average number of days from emergence to pod formation (NDEPF), average number of days from emergence to physiological maturation (NDEPM), average number of days from emergence to harvest point (NDEHP), number of pods per plant (NPP), and production per plant (P/Pl).
Statistical analysis
Based on the frequency distribution of the genotypes in the different phenotypic classes of each descriptor, the genetic diversity was estimated using the Shannon-Weaver index (Shannon & Weaver, 1964), according to the following equation:
where H' is the Shannon-Weaver index; ni is the number of individuals sampled from the i-th species; N is the total number ofindividuals sampled; S is the total number of species sampled, and ln is the Neperian-based logarithm.
The Shannon-Weaver index (H') measures the degree of uncertainty in predicting to which species or group an individual chosen randomly, from a sample with S species and N individuals, will belong. Thus, the lower the value of H', the lower the degree of uncertainty, and, therefore, the lower the diversity of the sample (Shannon & Weaver, 1964). This index can also be used to quantify the level of entropy of the characters. The entropy of a given descriptor will be greater based on the number of phenotypic classes and the balanced frequency distribution of the accessions in the different phenotypic classes (Oliveira et al., 2017).
To establish a single pattern of analysis for the different variables (qualitative and quantitative), these were converted into multi-categorical variables (Cruz et al., 2011; Silva et al., 2013; Paiva et al., 2014) and later standardized according to the following equation:
where Z is the standardized value, with zero average and variance within the range from -1 to +1; Xj is the actual observation value within each class; x̄̄j is the average of the class observations; S is the variance of observations within each class; i is the number of observations, and j is the class of each observation.
After standardization of all multi-categorical variables, the genetic distances between the 76 cowpea accessions were estimated based on the square of the Euclidean distance, with the grouping of the genotypes carried out using Ward's hierarchical method.
Two dendrograms were generated to graphically represent the genetic diversity between accessions. The first included all 19 characters evaluated, and the second was constructed only with the characters that exhibited frequency above 50% in a certain class and an entropy value greater than 75% (H'>0.75), aiming to reduce expenses with labor and time dedicated to data collection.
The data obtained from the phenological and production characters were analyzed using descriptive statistics and subjected to Pearson's correlation test, with all statistical analyses performed using the Minitab® software version 18.1.
Results and discussion
Table 2 shows the multi-categorical descriptors, the number of phenotypic classes, and the Shannon-Weaver index. The highest entropy values were observed for the characters flower color (0.97), pod color (0.93), and seed brightness (0.92). High values for entropy are normally associated with a greater amount of the phenotypic category for the applied descriptor and also with a greater balance in the proportion between the frequency of genotypes in the different phenotypic categories (Vieira et al., 2008). Thus, this result demonstrates the existence of variability between the referred characters, making them relevant in the differentiation between genotypes.
TABLE 2 Number of phenotypic classes (NPC) and entropy levels (H') for the multi-categorical descriptors applied to the 76 accessions of cowpea.
| Descriptors | NPC | H' |
|---|---|---|
| Seedling pigmentation | 2 | 0.18 |
| Flower color | 3 | 0.97 |
| Inflorescence type | 2 | 0 10 |
| Growth habit | 2 | 0.36 |
| Central leaflet shape | 5 | 0.76 |
| Plant size | 4 | 0 73 |
| Pod position | 3 | 0.81 |
| Pod color | 4 | 0.93 |
| Pod shape | 4 | 0.60 |
| Grain color | 15 | 0.78 |
| Grain shape | 4 | 0.63 |
| Seed brightness | 3 | 0.92 |
| Seed texture | 2 | 0.74 |
| Initial flowering | 5 | 0.29 |
| Pod length | 5 | 0.70 |
| Number of grains per pod | 3 | 0.72 |
| Mass of 100 grains | 5 | 0.83 |
| Cycle | 5 | 0.57 |
| Resistance to diseases caused by viruses | 5 | 0.90 |
Low entropy values (H'<0.75) associated with a frequency above 50% were found for eleven descriptors, namely inflorescence type, seedling pigmentation, initial flowering, growth habit, cycle, pod shape, grain shape, pod length, number of grains per pod, plant size and seed texture. Therefore, these descriptors were suggested for disposal (Tab. 2). Although the descriptors pod length and number of grains per pod were provided for discard, they are relevant for cowpea breeding programs as they directly influence grain yield. Therefore, only the other nine descriptors were eliminated.
The disposal of nine of the 19 characters evaluated (Tab. 2) reduced by 47.4% the number of descriptors. A result superior to this was found by Silva et al. (2019) in a study to select morpho-agronomic characters in Physalis angulata L. germplasm using univariate and multivariate techniques that recorded disposal of 55.9% of the total number of the descriptors evaluated, without a significant loss of information.
Among all the characters evaluated in the present study, those with the lowest entropy coefficients were inflorescence type and seedling pigmentation, with H' values of 0.10 and 0.18, respectively. This result implies a low variability of these characters, which can be considered as those that least influenced the divergence between the cowpea accessions.
Ward's hierarchical method, based on the dissimilarity matrix estimated using the quadratic Euclidean distance, made it possible to group the 76 genotypes into five distinct groups from a cut at approximately 60% of the maximum distance (Fig. 1).
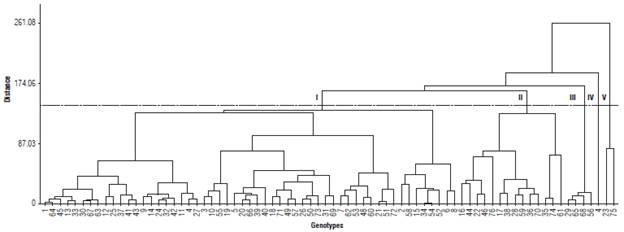
FIGURE 1 Dendrogram generated from the genetic dissimilarity matrix between 76 accessions of cowpea.
Group I had the highest concentration of genotypes, consisting of 55 of the 76 accessions evaluated, which expressed the most frequent characters. Group II was composed of 14 accessions (16, 17, 22, 28, 35, 36, 38, 44, 46, 59, 61, 70, 74, and 76). The genotypes belonging to this group have a small/medium pod length, mass of 100 grains that classifies them as small and medium, and a cycle ranging from early to medium. Group III consisted of 5.3% of the tested genotypes (29, 56, 65, and 68), which showed a determinate growth habit and erect plant size, important characters for breeding programs that aim to obtain cultivars adapted to mechanization.
Group IV was composed only of accession number 4 (Cacheado), which differs from the others since it is the only one that showed a type of compound inflorescence.
According to Barros et al. (2011), compound inflorescence has a direct influence on production by morphologically altering the reproductive part of the plant, which causes bifurcations at a certain height of the peduncle and new segments that will produce flowers and fruits. Group V consisted of two components (23 and 75), the only ones that had anthocyanin pigmentation in the seedling phase.
The most divergent combination, with a distance of261.08, was established between genotypes 1 (Das Almas) and 75 (CE-970), showing greater genetic divergence between these accessions, which is desirable in breeding programs aiming to produce superior hybrids. On the other hand, the most similar combination was obtained between accessions 34 (TVu 1204) and 54 (Progresso-66), with a distance of 1.47, which should be avoided in order to explore heterosis in the progeny.
The first dendrogram was created considering all the descriptors evaluated (Fig. 1). For the construction of the second dendrogram, nine characters were discarded. The elimination of these characters resulted in a new distribution of accessions, represented graphically in Figure 2.
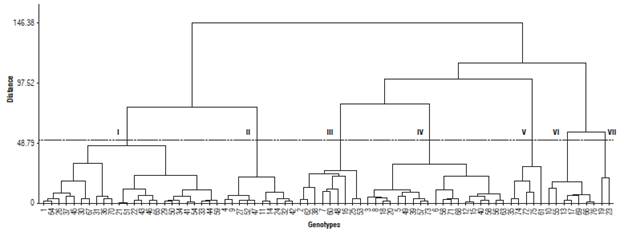
FIGURE 2 Dendrogram generated from the characters that showed higher levels of entropy (h">0.75) associated with a frequency below 50% in a given class.
In this new dendrogram, seven groups were generated. Group I consisted of 24 accessions (1, 21, 22, 26, 29, 30, 31, 33, 34, 36, 37, 41, 43, 44, 45, 46, 50, 51, 54, 59, 64, 65, 67, and 70). These genotypes have white-colored seeds ranging from white with brown halo, white with mottled halo, and white-brown. Also, they showed mass of 100 grains that characterize them as extra small, small, and medium. In group II, ten accessions (13.2%) were grouped, which showed pods distributed above the foliage level, with a matte or intermediate opaque seed shine and with extra small to small size based on the seed weight. Group III was constituted by nine genotypes (2, 7, 16, 25, 38, 48, 53, 60, and 62), whose plants showed brilliant seeds of cream color, white-purple, and black-white.
The genotypes that formed group IV produced pods positioned above the foliage, shiny seeds, and weight of 100 seeds that classify them as medium to large. Group V consisted of accessions 35, 61, 72, 74, and 75. These accessions have violet flowers and produce seeds of great or extra-large weight. In group VI, there were seven genotypes that exhibited greater pod length and less frequent seed color (purple mottled, brown-white, brown mottled white, cream, and black). The two accessions that were part of group VII (19 and 23) have an oval central leaflet shape and produce large pods with black colored or vinegar seeds.
Table 3 shows the descriptive statistics of the phenological and production variables used in the characterization of the 76 cowpea genotypes. The amplitude of the coefficient of variation (CV) varied from 9.19 to 59.44% for NDEHP and P/Pl, respectively. Santana et al. (2019), in a study of genetic divergence between cowpea accessions, found a smaller amplitude for CV values, which varied from 4.39 to 23.65% for the characters grain index and grain yield, respectively. In studies with cowpea, it is common to find high CV values for grain production (Bertini et al., 2009; Públio Júnior et al., 2017; Camara et al., 2018; Souza et al., 2019).
TABLE 3 Descriptive statistics of the quantitative characters of the 76 accessions of cowpea.
| Characters | Minimum | Maximum | Average | Standard deviation | Variance | CV (%) |
|---|---|---|---|---|---|---|
| NDEFF | 33.00 | 58.00 | 44.83 | 4.68 | 21.95 | 10.45 |
| NDEPF | 35.00 | 70.00 | 47.96 | 5.81 | 33.77 | 12.12 |
| NDEPM | 40.00 | 76.00 | 55.68 | 6.64 | 44.19 | 11.94 |
| NDEHP | 51.00 | 82.00 | 61.91 | 5.69 | 32.37 | 9.19 |
| NPP | 2.57 | 53.13 | 22.90 | 11.97 | 143.27 | 52.27 |
| P/Pl(g) | 5.50 | 139.38 | 54.52 | 32.41 | 1050.29 | 59.44 |
NDEFF - average number of days from emergence to full flowering; NDEPF - average number of days from emergence to pod formation; NDEPM - average number of days from emergence to physiological maturation; NDEHP - average number of days from emergence to harvest point; NPP - number of pods per plant; P/Pl - production per plant; CV - coefficient of variation.
The evaluated genotypes showed high variability regarding the cycle. Regarding the character NDEFF, some accessions started flowering at 33 d after emergence, and others only at 58 d. The general average for this descriptor was 45 d. The character NDEPF ranged from 35 to 70 d, with an average of 48 d. When considering NDEPM, there was a variation from 40 to 76 d, with a general average of 56 d. The accessions also expressed great variation concerning NDEHP, with the earliest reaching the harvest point at 51 d and the latest at 82 d. On average, the harvest point was reached at 62 d.
According to Freire Filho et al. (2005), precocity is a relevant character as it represents the possibility of up to three crops per year, including rainfed and irrigated crops. As a result, it should be possible to increase and/or stabilize cowpea production in regions with long periods of drought. Thus, the mentioned descriptors were relevant and should be considered when selecting parents since they are directly related to the cultivation cycle.
Approximately 53% of accessions started to flower fully between 42 and 48 d after emergence, classified as of early and medium cycle, respectively (Fig. 3A). The majority of accessions began to form pods between 40 and 50 d (Fig. 3B). Approximately 91% of accessions started the maturation process between 48 and 64 d (Fig. 3C), and 67% reached the harvest point between 58 to 64 d after emergence (Fig. 3D). Accession 23 (7907-Purple Hull) was the only one considered extra early, starting its flowering and harvest at 33 and 51 d, respectively. On the other hand, accessions 2 (Potomac), 4 (Cacheado), and 8 (Novato) only started flowering between 54 and 58 d and harvest from 74 to 82 d.
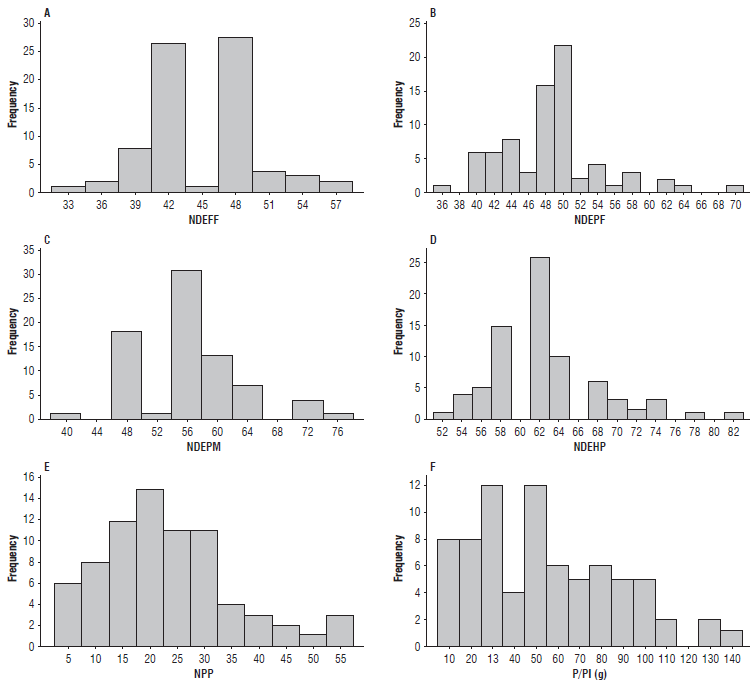
FIGURE 3 Frequency distribution of the 76 cowpea genotypes evaluated for six characters. A) NDEFF - average number of days from emergence to full flowering; B) NDEPF - number of days from emergence to pod formation; C) NDEPM - number of days from emergence to physiological maturation; D) NDEHP - number of days from emergence to harvest point; E) NPP - number of pods per plant, and F) P/Pl - production per plant.
Regarding the descriptor NPP, there was considerable variation between genotypes, with most of them producing 15 to 30 pods (Fig. 3E). Accessions 1 (Das Almas), 5 (Galanjão), and 9 (Milagroso) are noteworthy for having shown an NPP greater than 50. This character is essential for breeding programs aimed at the identification of parents since the selection for increasing the number of pods per plant results, indirectly, in increased grain yield (Santos et al., 2012).
A more uniform distribution was observed for P/Pl, with about 93% of accessions producing less than 100 g and only five accessions with higher production, with emphasis on genotypes 1 (Das Almas) and 5 (Galanjão), which produced more than 130 g/plant (Fig. 3F). The low production values recorded for most genotypes are due to the low weight of 100 grains and the low number of grains per pod.
Regarding virus attack, the accessions were classified as resistant/susceptible according to a grade scale. Among the evaluated genotypes, 29 showed no symptoms (1, 2, 3, 5, 8, 10, 13, 17, 19, 21, 28, 29, 31, 35, 36, 40, 51, 55, 62, 66, 67, 68, 69, 70, 71, 72, 73, 75 and 76). The other accessions showed symptoms ranging from mild to severe. Since only visual analysis of symptoms was performed, further studies will be needed to confirm the resistance of the genotypes to the CPSMV.
Regarding the estimated linear correlation between quantitative characters, an amplitude from -0.016 to 0.933 was found (Tab. 4). Pearson's correlation coefficient (r) measures the strength of the relationship between the characters studied, assuming values between -1 and 1, which are interpreted as perfect negative and positive correlations, respectively. According to the values shown in Table 4, the variables NPP and P/Pl were highly correlated (r = 0.886; P = 0.000). These results corroborate the findings of Santos et al. (2012) and show that the accessions that expressed the highest number of pods also showed higher production.
TABLE 4 Pearson's correlation coefficients and their respective probabilities obtained for the six quantitative characters evaluated in 76 cowpea genotypes.
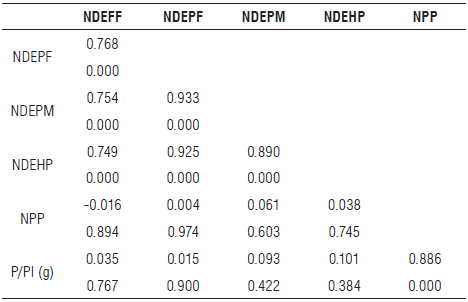
NDEFF - average number of days from emergence to full flowering; NDEPF - average number of days from emergence to pod formation; NDEPM - average number of days from emergence to physiological maturation; NDEHP - average number of days from emergence to harvest point; NPP - number of pods per plant; P/Pl - production per plant; upper cells show the correlation coefficient and lower cells show the P-value.
The phenological variables NDEPF, NDEPM, and NDEHP showed a high correlation with each other (Tab. 4 ). This result was expected since these characters are closely related to the crop cycle. Therefore, the accessions that started the formation of pods earlier showed the same behavior for physiological maturation and harvest point.
Of the 76 accessions evaluated in this study, five deserve to be mentioned and should be incorporated into cowpea breeding programs. They are: 1 (Das Almas), 5 (Galanjão), 13 (Selected from CE-13), 23 (7907-Purple Hull), and 46 (Caupi Branco). Accession 23 was considered the most precocious of all. However, it showed a low NPP and, therefore, low grain production. The other five genotypes combined medium cycle, NVP above average, and production above 100 g per plant.
Regarding the dendrogram shown in Figure 2, among the five genotypes mentioned, 1 (Das Almas) and 46 (Caupi Branco) belong to group I, while 5 (Galanjão) belongs to group IV. The genotypes 13 (Selected from CE-13) and 23 (7907-Purple Hull) belong to group VI and VII, respectively. Based on the assumption that classified accessions are homogeneous within the group but heterogeneous between groups, crossings should be performed between accessions belonging to different groups and with desirable agronomic characters. Following these criteria, crosses involving genotype 23 (7907-Purple Hull), which showed an extra early cycle, with 1 (Das Almas) or 5 (Galanjão), which expressed the highest NPP and P/Pl, are promising.
Conclusions
The descriptors flower color, pod color, and seed brightness showed greater genetic variability. Among the genotypes evaluated, Das Almas, Galanjão, selected from CE-13, 7907-Purple Hull, and Caupi Branco can be incorporated as parents into cowpea breeding programs.
Crossings between the genotype 7907-Purple Hull and Das Almas or Galanjão are indicated for use in breeding programs to obtain superior genotypes in precocity and grain yield.

