


 English (pdf)
 Article in xml format
 Article references
 Send this article by e-mail
 Cited by SciELO
  Cited by Google
  Similars in
SciELO
Similars in
SciELO  Similars in Google
 Permalink
Introduction
When performing agricultural experiments in the field, many variables are usually measured. To estimate the sustainability generated by the treatments evaluated in such experiments, it is necessary to choose which of these variables are indicators and, therefore, be part of the minimum set of sustainability analyses indicators.
Although there is consensus on the use of indicators to assess the sustainability of agricultural production systems, there is still no agreement on how to select these indicators with a wide diversity of approaches (Parris & Kates, 2003; Bell & Morse, 2008; Bockstaller et al., 2009; de Olde, Moller et al., 2016; Alaoui et al., 2022). This implies the possibility that the indicators evaluated may not be focused on the objective of the study, increasing measurement costs and raising concerns about the validity of the approach and the usefulness and reliability of the evaluation (Bockstaller et al., 2009; Schader et al., 2014; de Olde, Moller et al., 2016). In response, many authors have highlighted the importance of establishing indicator selection procedures with transparent and well-defined criteria that lead to relevant, reliable, comprehensive, meaningful assessments that comprehensively represent the agricultural production system under study (Hunnemeyer et al., 1997; Binder et al., 2010; Lebacq et al., 2013; Marchand et al., 2014).
The criteria for selecting the most relevant indicators have been as follow: the indicator must be measurable (Dantsis et al., 2010; Gómez-Limón & Sánchez-Fernández, 2010; Roy & Chan, 2012), sensitive to variations (Bélanger et al., 2012), relevant to the case study (Dantsis et al., 2010; Bélanger et al., 2012), and directly related to the topic of study (van Asselt et al., 2014). The selection and prioritization of the criteria used to define the indicators differ widely among the sustainability assessment tools (Reed et al., 2006; Bell & Morse, 2008; de Olde, Oudshoorn, et al., 2016; Pereira et al., 2022).
Agricultural sustainability assessments can be conducted at different scales. Depending on the geographic projection to which these assessment results are to be scaled, opinions may be generated that reflect differences in worldviews, e.g., reductionist versus more holistic perspectives to understanding a multivariate activity such as agriculture (de Olde, Oudshoorn, et al., 2016). When agricultural sustainability assessments are made to compare different treatments in scientific experimentation, i.e., when the assessment scope is at the plot or experimental unit scale, indicators should reflect changes in production systems in response to the treatments being assessed.
Based on the above, this study aims to propose a selection framework for the minimum set of indicators, adapted to the plot or experimental unit scale that combines qualitative and quantitative criteria.
Materials and methods
Indicator hierarchical order
The variables considered indicators are assigned according to their hierarchy in raw, base, or central indicators.
Raw indicators: These are all the variables measured and estimated in the experiment in question from which significant differences are expected due to the application of the treatments evaluated and, in some way, their relation to the sustainability of the agricultural production system.
Baseline indicators: These are those raw indicators that have met the mandatory selection criteria outlined below. In this group, all the indicators obtained a score higher than zero after running the mandatory criteria checklist.
Core indicators: Those baseline indicators that scored the most after running the entire selection criteria checklist are discussed below.
Minimum Indicator Set (MIS): The MIS is composed of the core indicators that obtained the highest score. The indicators that make up the MIS are used for sustainability analysis.
Selection criteria
The list of indicator selection criteria, synthesized by de Olde, Oudshoorn, et al. (2016), was used as a reference point.
A scoring system was established based on the total or partial fulfillment of the different selection criteria to quantitatively select indicators. A checklist type "Not meets = 0 or Yes meets = 1" and rating (from 0 to 3) was established according to the rules corresponding to the selection criterion that gives the indicator a score according to the partial or total compliance with the criterion.
The selection criteria were grouped into direct mandatory criteria, main non-mandatory criteria, alternate non-mandatory criteria, and correlation criteria. The evaluation of each criterion for each indicator is done sequentially, obeying the following order:
Mandatory criteria: These are strict compliance criteria, i.e., if the indicator does not meet any of the criteria in this group, it will obtain a total score of zero, will be discarded, and will not continue with the agricultural sustainability assessment. They are the first criteria to be considered. All raw indicators must meet these criteria to move to the next step, becoming baseline indicators. The mandatory selection criteria are the following:
a) Related to the agricultural sustainability objective. The indicator has a highly significant (2), significant (1), or non-significant (0) relationship to the agricultural sustain-ability objective. Note that the sustainability objective may be different from the study objective. For example, the effect of treatments on soil carbon stock is related to both the study objective and the agricultural sustainability objectives. The concentration of nutrients in plant tissues would not directly correlate with the sustainability objectives;
b) Quantifiable. Counts and continuous variables are more exact than ranges (ordinal scales) or 'yes/no' scores (binary); any form of quantification is more recommended than entirely qualitative assessment (de Olde, Oudshoorn, et al., 2016). It is quantifiable (1), not quantifiable (0);
c) Specifically interpretable. The change in the indicator can be interpreted by modifying the system in applying the treatments. It is specifically interpretable (1), not specifically interpretable (0);
d) Transparent and standardized. The indicator is based on clearly defined, verifiable, and scientifically acceptable data, collected through standardized and affordable methods to be reliably replicated and contrasted with each other. It is transparent and standardized (1), not transparent and standardized (0);
e) Not redundant. The indicator is not obtained from another variable that is part of the analysis or is not a variable within an aggregation function (FAg). A FAg is an indicator that aggregates two or more variables within itself and, through an equation, obtains the interaction of the variables that make up the function. If the first case is presented, priority is given to the independent variable. In the second case, the FAg is chosen because it generates a more significant amount of information. It is redundant (0), not redundant (1), a FAg (1), or is a variable within a FAg included in the study (0);
f) Significantly different. The indicator is sensitive, changes substantially, and it is within the assessment threshold with the treatments applied. Statistically, the indicator presents significant differences between the treatments evaluated. An analysis of variance (ANAVA) and a comparison test is performed. If at least 20% of the treatments have significant differences (P<0.05), a score of one (1) is assigned; between 20-40%, two (2); 40-60%, three (3); 60-80%, four (4); and 80-100%, five (5). If it turns out that they are not significant, a score of zero (0) is assigned and the indicator does not continue in the process.
Main non-mandatory criteria. These are criteria whose compliance is highly recommended, as they provide greater validity, transparency, and confidence in the analysis but are not strictly mandatory. The main non-mandatory selection criteria are as follow:
a) Affordable measurement. Direct measurement (field or laboratory) or estimation of the indicator through functions or models is easy and cheap (3), easy but expensive (2), cheap but complicated (1), or complicated and expensive (0) for most stakeholders. Affordable assessment increases participation and constancy of monitoring (de Olde, Oud-shoorn, et al., 2016);
b) Parameterized. The indicator has pre-set ranges or thresholds (3). It is highly recommended that indicators be parameterized rather than comparing treatments; thresholds clearly define whether the application of the treatment results in an increase or decrease in the system's sustainability;
c) Measured or estimated. The indicator is measured directly in the field or estimated from variables measured directly in the field (2), is measured in the laboratory or estimated from variables measured in the laboratory (1), or is estimated through functions (e.g., pedo-transfer) or modeling (0). Actual (observed) values are generally preferable to estimates;
d) Related to the objective of the study. The indicator has a highly significant (2), significant (1), or non-significant (0) relationship with the objective of the study. It should be noted that the objective of the study may be different from the objective of the sustainability analysis;
e) Variable between repetitions. The indicator shows differences between repetitions of the same treatment (1). Some indicators obtained using estimates generate exactly the same value for all the repetitions of the treatment; this could detract from the validity of the statistical analysis.
Alternative non-mandatory criteria. These are criteria whose fulfillment is recommended, but they are used more as a means of tiebreaking if two or more indicators that meet the other criteria obtain the same score. The alternative non-mandatory selection criteria are as follow:
a) Acceptance. The indicator is either accepted (1), widely accepted (2), or not accepted (0) by the main stakeholders or decision-makers (e.g., producers, government officials, scientists, etc.);
b) Participatory development. The indicator was chosen in a participatory way (1) or not (0). It is more probable that indicators and tools will be relevant, reliable, practical, heard, and used when stakeholders chose them (de Olde, Oudshoorn, et al., 2016);
c) Present and future balance. The indicator can be used to assess current and future sustainability. Some of the indicators should monitor potential new menaces and opportunities in the future (de Olde, Oudshoorn, et al., 2016).
d) Aggregate. The indicator is a FAg representing a set of variables (1) or not (0). This type of indicator is preferable since a single value explains the behavior of two or more variables or components of the production system;
Correlation criterion. This criterion allows us to choose between indicators that present a significant correlation. The following algorithm must be followed to assign the score:
1. A correlation matrix is made between the indicators to be compared;
2. The selection factor one (FS1) is estimated for each indicator, applying Equation 1:

Where x̅= Average, Ck1-n = correlation coefficient value, in absolute values (0 to 1), between the evaluated indicator and the other indicators in the correlation matrix. FS1 determines the degreeof global correlation of the indicator, i.e., its degree of correlation with the other indicators within the correlation matrix. The higher the FS1, the lower the overall correlation of the indicator;
3. Theselection factor two (FS2) is estimated for each indicator, based on Equation 2:
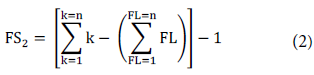
Where k = indicator, FL = logic function, ranging from 1 to n, according to the followiFS expression:
FL = If FS1 > 0.7, then 0, otherwise 1
FS2 relates the magnitude of the correlation coefficient to the significance of each indicator. In this way, highly correlated indicators are eliminated that are assigned a value of zero;
4. The selection factor three (FS3) is estimated for each indicator, based on the following logical functions:
If Maximum -value [(FS2(k1) ... FS2 (kn)] > 0, then FS3 = FS2. If Maximum value [(FS2(k1) ... FS2 (kn)] = 0, then {If FS1 < Maximum value [(FS1(k1) ... FS1 (kn)], then FS3 = 0, otherwise, FS3 = FS1]}.
FS3 allows choosing an indicator when all the matrix indicators are correlated in a highly; significant way;
5. FS3 is normalized using Equation 3:
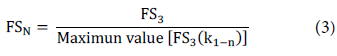
Where FSN = Normalized value of FS3, FS3(k1-n) = Maximum value of FS3 from indicator one ton.
If FSN = 0, then the indicator is removed;
6. Two indicators may correlate significantly with the other indicators in the correlation matrix and that, in turn, have a highly significant correlation with each other. In this case, one of the indicators must be eliminated. To define which indicator is eliminated, the correlated indicators must first be identified using the following logical function:
If [FS1(k1) = FS1(k2), and FS1(k1) = FS1(k3), and ... FS1(k1) = FS1(kn)], then the correlated indicators (k) are identified with this symbol "ϯ ". This comparison must be made with all the indicators [FS1(k1) to FS1(kn)];
7. For each indicator that has been assigned an FSN value, the sum of the scores obtained in the other selection criteria is made, namely: ΣCS = ObDr + NbPr + NbAt. If two correlated indicators were identified in step six with this symbol (ϯ), the one that has obtained the highest ZCS is chosen;
8. CrLc is calculated for each selected indicator by multiplying ZCS * WCS, where ΣCS is the weighting value assigned for the selection criteria.
At the end of the process, a sum of the scores obtained in each category is calculated (ObGt + NbPr + NbAt + CrLc). The indicators that obtain a score higher than zero will be part of the MIS.
Case study
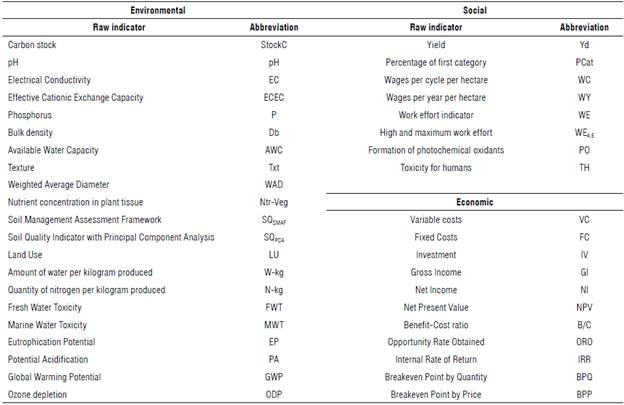
This methodology was used with the data of an experiment that evaluated the effect of different mixtures of organic fertilizers and chemical synthesis in the pre-plant application on a greenhouse tomato crop. The research was carried out in the Bio-Systems Center of the Jorge Tadeo Lozano University of Bogotá, located in the municipality of Chia (Colombia) (4°53'3.62" N, 74°00'50" W) at an altitude of 2650 m a.s.l. Tomato (Solanum lycopersicum L) cv. Sheila was used. Five treatments were evaluated: 1) Chemical control (ChC) (100% chemical pre-planting fertilization formula); 2) organic control (OrC) (100% organic pre-planting fertilization formula; 3) mixture 1, Mx1): 25% organic - 75% chemical pre-planting fertilization formula; 4) mixture 2 (Mx2) (50% organic - 50% chemical pre-planting fertilization formula); 5) mixture 3 (Mx3); 75% organic - 25% chemical pre-planting fertilization formula. A randomized complete block design was established with five treatments and 15 experimental units (EU) (three replicates per treatment). Each EU had an area of 12.3 m2 for a total of 185 m2. Table 1 shows the variables evaluated in the experiment.
Statistical analysis
The statistical analyses were performed with the R software version 3.6.2 (R Core Team, 2020). For all the variables studied, a descriptive analysis was performed, detecting extreme values using boxplot graphs, using the mvoutlier library (Filzmoser & Gschwandtner, 2017), and performing normality tests (Shapiro test) and variance homogeneity tests (Bartlett test) from the normtest library (Gavrilov & Pusev, 2014). In the cases where mismatches were detected, to find the appropriate transformation of the data, the boxcox tool from the MASS library was used (Ripley et al., 2017). Pearson's correlation analysis was performed with R's source aids. Anava and the Tukey's multiple comparison test (HSD) were performed with the Agricolae library (Mendiburu, 2017) to determine the differences between treatments.
Results
After running the mandatory criteria list for each raw indicator (Tab. 1), SQPCA, LU, W-kg, N-kg, FWT, MWT, EP, AP, GWP, and ODP were defined as the baseline indicators of the environmental dimension (Tab. 2). The raw indicators StockC, pH, EC, ECEC, P, Db, AWC, and Txt are aggregated in the soil quality functions SQSMAF and SQPCA. For this reason, they were assigned a score of zero for the redundancy criterion (NoRd). Ntr-Veg has no significant direct relationship to the sustainability objective (ObSt) and was assigned a zero score for that criterion (Tab. 2). The SQSMAF indicator did not show significant differences.
TABLE 2 Score obtained by the raw indicators for the mandatory selection criteria (MnTr).
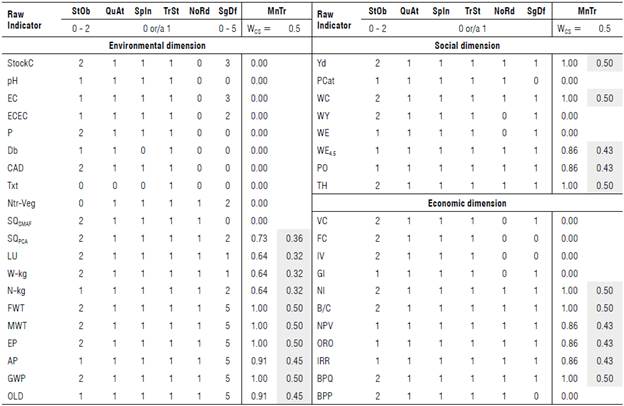
StOb: related to the agricultural sustainability objective; QuAt: quantifiable; SpIn: specifically interpretable; TrSt: transparent and standardized; NoRd: not redundant; SgDf: significantly different; and WCS: weighting value assigned for the selection criteria. The conventions of the variables can be seen in Table 1.
As for the social dimension, the raw indicators WY and WE scored zero for being redundant with WC and WE4.5. Similarly, PCat did not present significant differences and was also eliminated (Tab. 2). In this dimension, Yd, WC, WE4.5, PO, and TH continued as baseline indicators. In the economic dimension, the raw indicators VC, FC, IV, and GI are aggregated in the functions of the profitability indicators B/C, NPV, ORO, and IRR, while BPP did not show significant differences, so they obtained a score of zero. In this dimension, the following continued as baseline indicators: NI, B/C, NPV, ORO, IRR, and BPQ (Tab. 2).
Once the base indicators for each dimension were defined, the next step was to select the core indicators. To do this, first, the checklist of non-mandatory criteria was run on all the core indicators. Finding that the measurement of these indicators was affordable, although none were parameterized, all indicators were assigned a zero score for this criterion.
In the environmental dimension, only LU and W-kg indicators were directly measured in the field, while N-kg was measured in the laboratory. The other baseline indicators of this dimension were estimated by functions or modeling. In the social dimension, it was necessary to make measurements directly in the field to calculate Yd and WC, while WE4.5, PO, and TH were estimated through functions or modeling. All the baseline indicators were obtained from field measurements.
Within the environmental dimension, the baseline indicators FWT, MWT, AP, GWP, and ODP did not have a significant relationship with the study's objective. The same happened for WC, WE4.5, PO, and TH in the social dimension. The only raw indicator that was not variable between repetitions was WC since all the experimental units within the same treatment obtained the same value for this indicator.
The only indicator that is considered not yet accepted is WE4.5, since it has not been used in other studies. At the same time, the only indicator chosen in a participatory way is Yd. Within the base indicators, it was considered that SQPCA, LU, W-kg, N-kg, Yd, WC, and all the economic indicators could be useful for estimates of future sustainability. SQ PCA of the environmental dimension and all economic dimension indicators, except NI, were aggregation functions (Tab. 3).
TABLE 3 Score obtained by the baseline indicators for the main (NmMn) and alternate (NmAt) non-mandatory selection criteria.
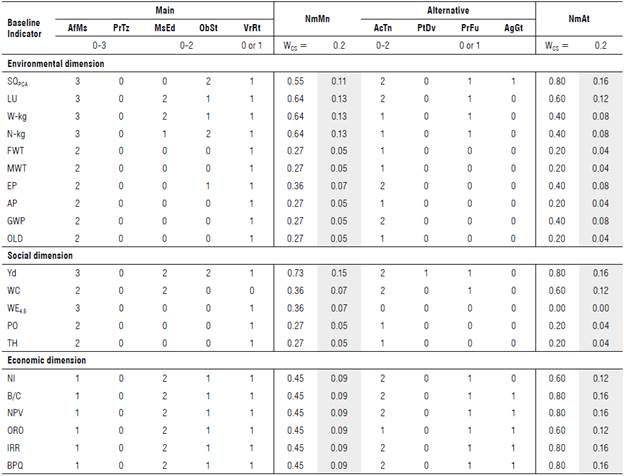
AfMs- affordable measurement; PrTz- parameterized; MsEd- measured or estimated; ObSt- related to the study objective; VrRt- variable between repetitions; AcTn- acceptance; PtDv- participatory development; PrFu- present and future balance; AgGt- aggregate; and WCS- weighting value assigned for the selection criteria. The conventions of the variables can be seen in Table 1.
After constructing the correlation matrix, it was evident that there were significant and highly significant correlations between many base indicators in each dimension.
According to the results shown in Table 4, the environmental indicators N-kg, FWT, MWT, EP, AP, GWP, and ODP were significantly and highly correlated with each other and with the other indicators of the environmental dimension. These indicators were eliminated from the process, leaving N-kg as the highest FS1.
TABLE 4 Score obtained by the base indicators for the correlation criterion (CrLc).
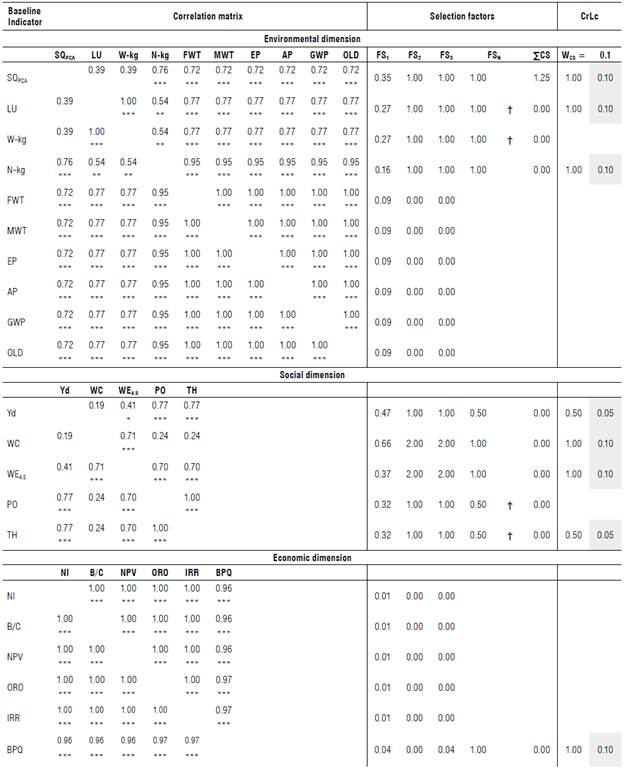
FS- selection factor; FSN- normalized value; ΣCS- sum of the scores obtained in the other selection criteria; WCS- weighting value assigned for the selection criteria; ** and high and very highly significant correlation, ϯ: Correlated indicators (k). The conventions of the variables can be seen in Table 1.
The LU and W-kg indicators also showed a highly significant correlation, besides being correlated equivalently with the other environmental dimension indicators. In this sense, according to the score obtained with the other selection criteria (ECS), LU continued in the process. From the environmental dimension's baseline indicators, they became central indicators SQPCA, LU, and N-kg (Tab. 4).
In the social dimension, the PO and TH indicators presented the same correlation among themselves and their dimension indicators. This last one reached a higher score for ZCS. The following were selected as central indicators of the social dimension: Yd, WC, WE4.5, and TH (Tab. 4).
In the economic dimension, all the baseline indicators showed highly significant correlations among them. The BPQ indicator obtained the highest FS3, so it was chosen as the central indicator representing all the economic dimensions (Tab. 4).
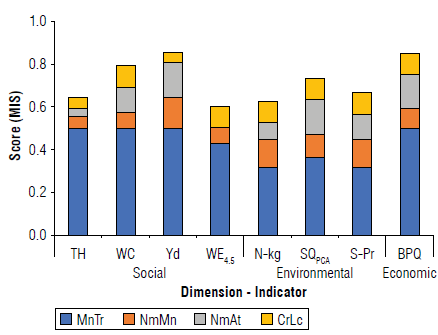
Based on the results shown in Table 4, the minimum indicator set (MIS) was made up, at the environmental dimension, of the central indicators SQPCA, LU, and N-kg. In the social dimension, the central indicators were Yd, WC, WE4.5, and TH, and in the economic dimension the indicator was BPQ. The SQpCA, Yd, LU, and BPQ indicators obtained the highest score (0.87,0.86,0.85, and 0.85, respectively), while WE4.5 reached the lowest score (0.6) (Fig. 1). From 21 raw indicators (10 environmental, 5 social, and 6 economic), were chosen 8 core indicators (3 environmental, 4 social, and 1 economic).
Discussion
Taking as a reference what Smith and Dumanski (1994) have said, an indicator is a characteristic that measures or reflects the state or condition of a system's change. Likewise, an agricultural sustainability indicator is a variable or a function of aggregation of a set of variables associated with the environmental, social, or economic dimensions of an agricultural production system, established as a reference for reporting on the functioning of that system (Gerdessen & Pascucci, 2013; de Olde, Oudshoorn, et al, 2016). An indicator shows sustainability as a measure of distance to the target; i.e., it measures the distance between the actual or predicted values of the variable and the reference value (representing the value with which sustainability is achieved).
The selection of indicators is a process that involves both qualitative and quantitative analysis. However, although indicators can be quantitative (numbers) or qualitative (e.g., graphics, colors, symbols), they need to be transformed into numerical values and have a unit of measurement (Waas et al, 2014). With the procedure described in this paper, the aim was to reduce as much as possible the level of subjectivity generally associated with the selection of qualitative indicators. However, it is not easy to eliminate subjectivity from selecting agricultural sustainability indicators since decisions must be made closely related to the researcher experience. The first subjective choice made is the weighting assigned to each group of selection criteria. In this work, mandatory criteria are considered to have the highest weight, so they were assigned a WCS of 0.5 (scale 0 to 1) (Tab. 2), while the main and alternate non-mandatory criteria were assigned a WCS of 0.2 each, and the correlation criterion a WCS of 0.1. There could be a consensus that the mandatory criteria are more important than the non-mandatory ones; the question is which WCS value should be assigned to each selection criterion? Similarly, the mandatory criteria are more important because if anyone of them is not met, the indicator is immediately removed from the process, and, therefore, they should be reviewed in more detail.
The second subjective choice is the score assigned to some selection criteria. For example, defining whether an indicator has a significant or highly significant relationship to sustainability's objective could have several points of view. Determining that an indicator has no relationship to the sustainability objective can generate a great deal of discussion. In this regard, there is a lack of consensus on which indicators to include in sustainability analyses, with a wide diversity of approaches (Parris & Kates, 2003; Bell & Morse, 2008; Bockstaller et al, 2009). However, the simple fact of considering these selection criteria increases the study's reliability, despite not reaching an absolute agreement.
This indicator selection methodology is designed to dilute the subjective selection process as one moves from raw indicators to base and core indicators. The degree of subjectivity is diminished by including statistical analysis and absolute (yes/no) selection criteria.
As shown in this paper, many indicators are usually measured, but many are redundant and correlated. The choice of indicators through a matrix and a correlation algorithm allows selecting the indicators with the most significant statistical weight, avoiding redundancy in the analysis. Likewise, the selection procedure gives higher importance to those indicators that are aggregation functions since a single indicator explains the behavior of all variables that make up the function.
From a technical perspective, an indicator is "a variable or an aggregation function of several variables related to a reference value that gives meaning to the values taken by the variables" (Pintér et al., 2012; Singh et al., 2012). In that sense, an indicator is related to a reference value since the term comes from the Latin indicare that means to point to something (Waas et al., 2014). None of the base indicators were parameterized. Therefore, the definition of sustainable must be made in terms of the comparison between the treatments evaluated, assuming that more or less is better for the indicator in question.
Choosing only the indicators that show significant differences between the treatments evaluated eliminates noise in the analysis. Working with indicators that have the same importance for all the systems under evaluation only increases the work but does not inform about the differences to be identified between the treatments under evaluation. This is more evident at small scales such as plot or experimental units. At these scales, indicators associated with government or macroeconomic policies, for example, would not have a differential effect among the treatments under evaluation, and therefore should not be considered.
Although the methodology proposed in this study promotes less subjectivity for the indicator selection process, it must still be recognized that definitions of sustain-ability and indicator selection vary with the researcher approaches, contexts, and expectations (Bell & Morse, 2008; Gasparatos, 2010). Nevertheless, this methodology allows the indicators that are part of the minimum set of indicators to show the effect of the treatments evaluated on the production system's sustainability. By applying this methodology, it can be ensured, to a large extent, that all environmental, social, and economic variables measured in the experiment are represented in the minimum set of indicators. This, despite the fact that in some cases, as in the environmental dimension, it began with a significant number of indicators (22) and was reduced to three. This drastic reduction was associated with a high correlation and/or redundancy between the environmental indicators evaluated.
Generally, the criteria for selecting indicators for agricultural sustainability assessments are associated with post-field study evaluations. However, it is highly recommended that the selection criteria proposed in this study (except, of course, those related to statistical analyses) be considered when evaluations are being planned. This would decrease the investment of resources.
Conclusions
The indicator selection process began with the evaluation of 40 raw indicators: 21 environmental, 8 social, and 11 economic. At the end of the process, they were reduced to 8 core indicators: 3 environmental (N-kg, SQPCA, S-Pr), 4 social (TH, WC, Yd, and WE45), and 1 economic (BPQ). This indicator selection methodology uses a rigorous process, with 22 selection criteria distributed in four hierarchical groups while promoting less subjectivity by including statistical analysis, algorithms, and mathematical processes. Using this methodology, the probability that all environmental, social, and economic variables measured in the experiment are represented in the minimum set of indicators is increased. Also, it increases the possibility that the selected core indicators will more reliably assess the production system's sustainability. We suggested replicating this work under different environments, species, and treatments.

