


 English (pdf)
 Article in xml format
 Article references
 Send this article by e-mail
 Cited by SciELO
  Cited by Google
  Similars in
SciELO
Similars in
SciELO  Similars in Google
 Permalink
Introduction
A mixed alcoholic drink or cocktail is obtained by mixing one or more alcoholic liquids or food-grade ethyl alcohol, either with an agricultural origin of simple alcoholic distillates or with other beverages, such as fruit juice, macerated fruits, syrups, milk, eggs, or other animal or plant-based substances. The alcohol level in these drinks can range between 0.4 and 40 alcoholic degrees (Wardencki, 2019). In general, skills, supplies, and knowledge of food technology and other disciplines are needed to prepare these drinks and achieve a suitable mixture with pleasant sensory properties. Alternatively, an alcoholic drink could be mixed in a bottle dispenser, possibly with two different alcoholic beverages designed for subsequent mixing. In this study, the first drink was made with asaí, a neotropical palm fruit of Amazon origin with grape-shaped berries and a dry and oleaginous pulp that has a high content of antioxidants, such as anthocyanins, and a low amount of carbohydrates (Castillo et al., 2012). This means that alcoholic fermentation cannot be carried out without adding sugars; therefore, this fruit was used to make an infused liquor. On the other hand, copoazú, a fruit from the Theobroma genus, like cacao and also of Amazon origin, has a higher content of carbohydrates in its pulp than fruits in the same class, which allows alcoholic fermentation (Duarte et al., 2010). Its profile of acids and sugar contents allows for mixing milk with the resulting liquor according to the bromatological composition (Tab. 1). The asaí and copoazú liquor extracts can be mixed in a cocktail.
TABLE 1 Nutritional content of asaí and copoazú [modified from Cuellar Álvarez et al. (2017), Carrillo Bautista et al. (2016); Carrillo Bautista et al. (2017), Castillo et al. (2012) and Castillo Quiroga et al. (2017)).
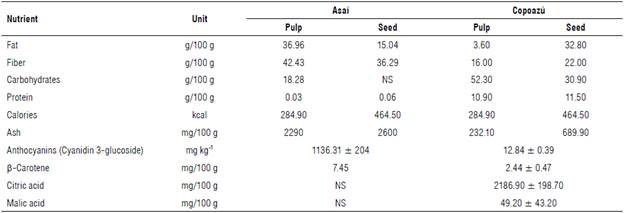
NS - Not specified.
This study aimed to identify the kinetics of alcoholic fruit beverages made from copoazú and asaí pulp, i.e., the fermentation kinetics in the case of copoazú drinks and the diffusion kinetics in the case of asaí drinks. Predicting the behavior of these drinks during preparation would facilitate correct decision-making for production conditions and provide the best quality product for subsequent cocktail preparation, thus avoiding an excessive number of trials and wasting raw materials (Wardencki, 2019).
A fermentation kinetic model was developed from the Monod model for copoazú alcoholic beverages because of its ability to represent microbial behavior, providing modifications for particular processing conditions (Gao et al., 2018; Miller & Block, 2020). On the other hand, a diffusive process was used for the asaí alcoholic beverages, which is the most appropriate for modeling with Fick's law, using the continuity equation and considering degradation factors, interactions, and diffusion of the main component as a follow-up to the variable anthocyanin content (Chung et al, 2016; 2017; Miller & Block, 2020).
Materials and methods
Fruits
Asaí and copoazú fruits were purchased from local producers in the Department of Amazonas. Ripe, washed, packed whole, or pulped fruits were selected at the agroindustry pilot plant of the SINCHI Institute in the city of Leticia, and sent to Bogotá properly refrigerated to perform the experiments.
Copoazú must preparation
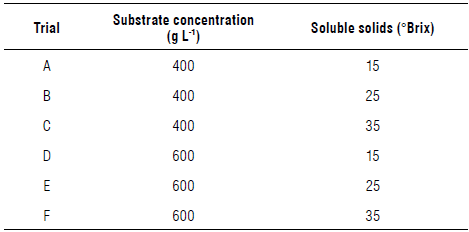
Copoazú fruit pulp was diluted with water at varying concentrations between 400 and 600 g L-1 and adjusted with a sucrose solution to 15, 25, or 35°Brix (Duarte et al, 2010; Dias et al., 2017; Wardencki, 2019) as shown in Table 2. These tests were performed in triplicate.
Fermentation trials
Each must was fermented in 3 L batches for 5 d using 15% Prestige Turbo Yeast, Saccharomyces cerevisiae, controlling the temperature at 22°C. The pH was adjusted to 4.5 by adding calcium carbonate, and potassium metabisulfite to inhibit bacterial growth at a concentration of 100 g L-1 of free sulfur dioxide (SO2) (Duarte et al., 2010; Dias et al., 2017). The fermented must was then matured for 25 d and the slurry was removed every 5 d, adding fresh water to replace the retired volume, and keeping the batch always at 3 L volume.
Infusion trials
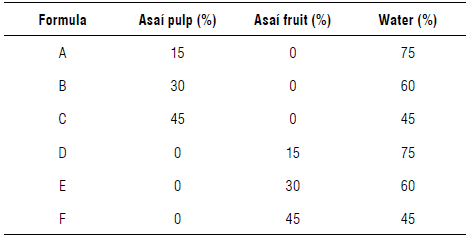
Asaí fruit or pulp was mixed with extra neutral alcohol at a concentration of 15% (w/v), varying the concentration: 15, 30, or 45% (w/v) for the diffusion process as seen in Table 3. The infusion was kept in a maturation process for 90 d, and samples were collected on days 1, 2, 4, 8, 15, 30, 60, and 90 since the phenomenon of diffusion lessens over time, meaning that more time is needed between measurements to observe changes in the concentration of the analytes of interest in the beverage.
Analytical methods
Fermentation kinetics
The Monod model was used to model the behavior of the sugar contents, biomass, and ethanol concentration, with some variations to inhibit microorganisms with ethanol and glycerol. The following differential equations were used to observe variations in the three factors in fermentation and an equation for inhibition of the specific growth rate (Kumar et al., 2013; Comelli etal., 2016; Miranda Castilleja et al, 2017):
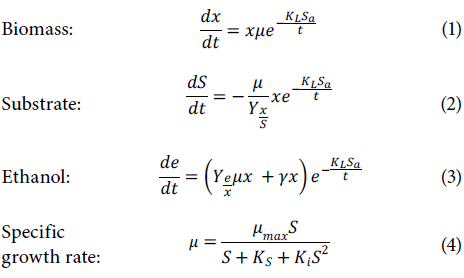
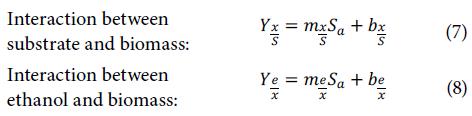
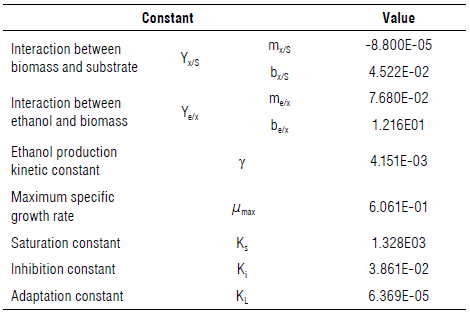
Where K1 is the inhibition constant expressed in L g-1, Ks is the saturation constant exp ressed in g L-1, KL is the lag constant expressed in L hg-1, µ is the specific growth rate expressed in h-1, µmax is the maximum specific growth rate expressed in h-1, Yx/S is t he interaction between the biomass and substrate (adimensional), Ye/x is the interaction between the ethanol and sub strate (adimensional), S is the substrate co ntent ex pressed in g L-1, x is the biomass content expressed in g L-1, is the ethanol content expressed in g L-1, γ is the ethanol production kinetic constant expressed in h-1, Sa is the amount of sugar added expressed in g L-1, and t is the time expressed in h.
Regression was used on the experimental data, finding the inhibition constant, the saturation constant, the lag constant, and the maximum specific growth rate with an evolutionary model that minimized the differences between theoretical and experiment data (Kumar et al., 2013; Comelli et al., 2016; Miranda Castilleja et al., 2017). Subsequently, linear regressio n was used to calculate the interaction between the biomass and substrate and the interaction between the ethanol and substrate with the graphical representation xrx0 vs. Si-S0, where the slope of the line was Yx/S and graphing ei-e0 vs. x1-x0 showed Ye/x; these graphs resulted in several lines, each corresponding to a processing condition, which was proportional to the amount of added sugar (Comelli et al, 2016).
Total soluble solids and biomass content
The fermentation kinetics were observed by measuring the total soluble solids (°Brix) every 30 min with an Atago PAL-1 pocket refractometer (Atago, Japan). For the biomass, the optical density of the must was measured every 30 min by taking 1 ml of sample and placing it in a quartz cell, with the measurement taken at a wavelength of600 nm in a Thermo Scientific Evolution 60S UV-Visible spectrophotometer (Thermo Fisher Scientific, USA), following the adjusted methodologies of Bermejo et al. (2011).
Alcohol content
A sample of the liquid phase was taken from the fermenter and placed in a cylinder, covering the alcoholometer (ECO, Spain) but allowing the contents to move around freely. The alcoholometer was immersed, gently rotated, and left to stabilize. The corresponding reading was taken in the lower meniscus, according to Miller (2019), as adapted for fruit wines.
Anthocyanin content
The infusion kinetics were observed by measuring the anthocyanin content of the asaí infusion, following the methodology of Li et al. (2017), modified for the measurement of infusion liquors. One hundred mg of the sample was weighed in triplicate and 5 ml of analytic grade methanol, acidified with 5% formic acid, was added. Each mixture was vortexed for 10 min and centrifuged for 45 min at 15,000 rpm. Two hundre d µl of supernatant was taken and the pH was adjusted to 1.0 (0.025 M KCl buffer) and 4.5 (0.4 M Sodium acetate buffer), adding; 2 ml of the buffer in each case. T his measurement was obtained in triplicate using; a Thermo Scientific Evolution 60S UV-Visible spectrophotometer (Thermo Fisher Scientific, USA) at the wavelengths 520 nm and 700 nm. Finally, the anthocyanin content was calculated using the following equation:
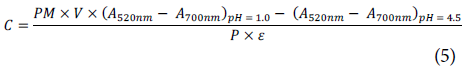
where PM is the molar weight of cyanidin-3-glucoside (449.2 g /mol), s is the molar extinction coefficient (25.964 /mol cm-1), P is the sample's fresh weight, V is the volume of added methanol, A is the ab sorbance at each pH and wavelength, and C is the anthocyanin content [mg of cyanidin-3-glucoside kg-1] (Salaha et al., 2008; Li et al., 2017; Li et al., 2018).
Oxidative rancidity (Fat acidity index)
The methodology described by the United States Pharma-copeial Convention (2013) was followed to determine this index, in which 2.5 g of the fresh sample was weighed in an Erlenmeyer flask, to which 50 ml of a mixture of alcohol and ether was added at a 1:1 w/w ratio (this mixture was neutralized with 0.1 N potassium hydroxide, observing the turning point with phenolphthalein). The homogeneous mixture was titrated with 0. ) N potassium hydroxide unt)l the solution was slightly pink for 30 sec. The acid number was the number of hydroxide ions necessary to neutralize 10 g of sample, calculated as follows:
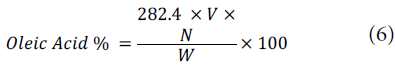
where 282.4 is the molecular weight of oleic acid, V is the volume in ml, N is the normality of the potassium hydroxide solution, and W is the fres( weight of the snmple (United States Pharmacopeial Convention, 2013).
Profile of sugar and organic acids
High-Performance Liquid Chromatography (HPLC) was used to measure the ormanic acids. First, 100 mg of sample was weighed and extracted with 3 m l of 5 mM sulfuric acid for 10 min in a Vortex. Then, the solution was centrifuged at 10,000 rpm for 45 min. Finally, the remaining liquid was removed, which was filtered with 0.45 µm PTFE membranes before injection in an Aligent 1200 Series HPLC (Aligent, USA). A 300 mm x 7.8 mm HPX-87H column was used, with a refractive index detector (RID) and diode array detector (DAD), 5 mM sulfuric acid as the mobile phase, and a flow of 0.5 ml/ min. The peaks were detectable at 243 nm (Topalovic & Mikulic-Petkovsek, 2010).
Statistical data analysis
For the analysis of variance, the data obtained in triplicate in each variable were processed in IBM SPSS Statistics 25 with an ANOVA test finding significant differences between the treatments with a probability of 95%. Matlab 2019b was used for the parameters of the kinetic equations, optimizing the parameters with an evolutionary algorithm an d the optimization toolbox sandbox, which progressively minimized the differences between the theoretical and experimental data.
The data were analyzed to determine the parameters of each kinetic, fermentation kinetics for the copoazú, and diffusion kinetics for the asaí. The kinetics were determined for the most appropriate process parameters in each case to subsequently mix both liquors.
Results and discussion
Fermentation kinetics
Sugar and organic acid profile
The liquors had a relatively high content of citric acid (Tab. 4), which was consistent with these fruits, while the content of other acids was due to the acid transformation in the reactions of the citric acid cycle activated in the reoxidation of NADH to NAD+. This is also because the glycolysis reactions were maintained since, under anaerobic conditions, NAD+ is regenerated through the conversion of pyruvate to lactate by lactate dehydrogenase. This conversion was probably the result of lactic acid bacteria present in most naturally. This production can significantly increase the acidity of a wine as well as result in soft aromas and a sweet flavor, improving the sensory profile for subsequent mixing with milk for cream liqueurs (Vasantha Rupasinghe et al., 2017). These components can affect the quality of the product, and volatile components can disturb the taste and smell of the final product, leading to possible applications of the final liquor in cocktails and general consumption (Pugliese et al., 2013; Reboredo-Rodríguez et al., 2015).
TABLE 4 Analysis of variance of the sugar and organic acids profile in the copoazú alcoholic beverages during the fermentation process.
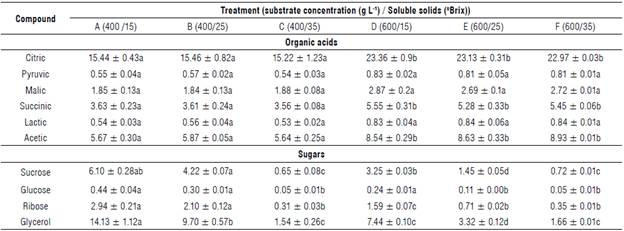
n = 3. Measurements with the same letter do not show significant differences according to the ANOVA (P<0.05). All results are expressed in g of the substance fresh weight L-1.
The amounts of citric acid, succinic acid, and acetic acid showed significant differences between the treatments with different concentrations of copoazú, while the concentrations of sugars glucose, ribose, and glycerol significantly differed between the treatments with different amounts of sugar. These results denote a stronger relationship between the amount of added sugar and complex sugars in copoazú and the amount of ethanol produced, including glycerol, as observed by other authors when fermenting fruit must (Vasantha Rupasinghe et al., 2017). The amount of sucrose could have been due to incomplete fermentation because of the inhibitory factors mentioned above. However, this value was lower than that of glucose possibly because of the affinity of the strain used by the glucose, resulting in accelerated fermentation in the treatments with more added sugar. Similar results were found by Vasantha Rupasinghe et al. (2017) in fruit wines when studying the inhibition of by-products.
The chromatogram (Fig. 1) shows that the retention time of 16.8 min had a peak that corresponded to glycerol, leading to the question of whether everything that was fermented became ethanol or if glycerol was favored at some point in the metabolic pathway.
In kinetics, this serves as an inhibitory factor to produce ethanol and biomass (Fig. 2) as well as for substrate consumption (Vasantha Rupasinghe et al., 2017), as reflected in the specific growth rate (Fig. 3).
Fermentation process
During the first stage of the fermentation process, the number of microorganisms and the amount of soluble solids remained stable. This phase is known as the adaptation phase of microorganisms, which is followed by a reduction in the number of soluble solids in the must (Fig. 2) and an increase in microorganisms. This is the exponential phase of the process, where both parameters stabilized in the final stage.
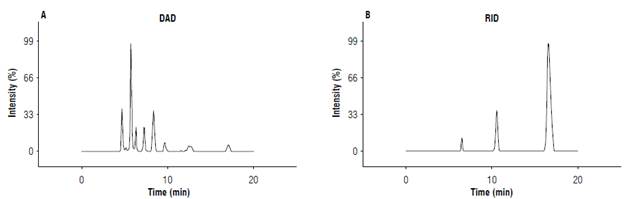
FIGURE 1 HPLC chromatogram for the profile of sugars and organic acids in the copoazú alcoholic beverages. A) DAD - Diode array detector; B) RID - refraction index detector.
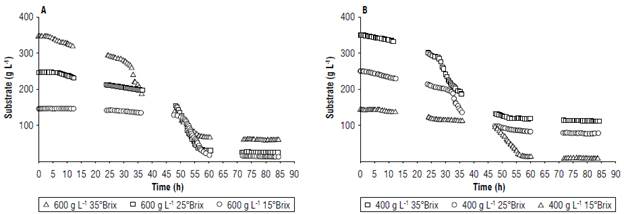
FIGURE 2 Comparison of fermentation performance with substrate variations at A) 600 g L-1 and B) 400 g L-1 of copoazú of different soluble solid content.
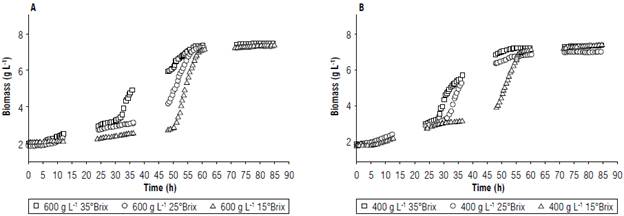
FIGURE 3 Comparison of fermentation performances for biomass variations at A) 600 g L-1 and B) 400 g L-1 of copoazú.
Figure 2 shows that the content of dissolved solids decreased considerably in the tests with less substrate because the microorganisms initially assimilated less complex sugars. Also, glucose is more easily assimilated by yeast than fructose, making it more effective at generating alcohols from these sugars and inhibiting the production of glycerol. Similar results were found by Gao et al. (2018) and Zinnai et al. (2013) when working with Saccharomyces cerevisiae strains to produce wines. These authors observed that glycerol is generated under alkaline conditions, where the metabolic pathway of glycerol-3-phosphatase is modified, causing phosphatase to react, forming glycerol. This means that the yeast needed a large amount of energy to convert glycerol into pyruvate and, in turn, pyruvate to ethanol (Arroyo-López, Querol, & Barrio, 2009; Vasantha Rupasinghe et al, 2017).
For biomass (Fig. 3), growth followed the phases of microbial growth; in the exponential phase, growth was relatively fast when compared to the same types of fermentation because the biomass production was approximately 1% of the amount of substrate consumed, with an average of 2.89 ± 0.81%. This was possible because of the higher energy consumption caused by the increase in the amount of glycerol during fermentation (Arroyo-López, Orlic, et al., 2009).
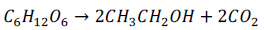
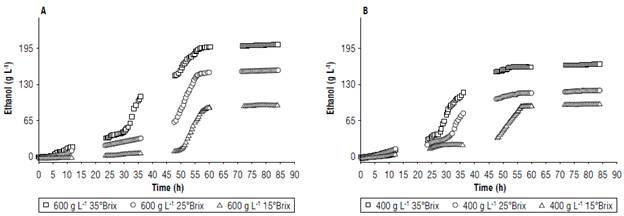
For the ethanol production (Fig. 4), the growth in relation to substrate consumption followed the following stoichiometry:
The ethanol yield, on average, varied between 47 and 65%, depending on the amount of substrate used. These results were relatively low because the yield of the conversion of sugars to ethanol was 95% on average (Zinnai et al, 2013; Vasantha Rupasinghe et al, 2017; Miller & Block, 2020), further indicating that glycerol maybe inhibiting the metabolic process of fermentation. Nevertheless, fermentation reached contents higher than 20% ethanol; this allows subsequent mixing with dairy ingredients because the mixture did not need to be "fortified" with extra neutral alcohol to maintain the final alcohol content (Wardencki, 2019).
Fermentation kinetics parameters
Figures 5 and 6 show that the slope changed depending on the amount of added sugar (Sa), demonstrating the interdependence between these two variables. Therefore, linear regressions with these slopes were proposed to consider the sugar content (Arroyo-López, Querol, & Barrio 2009; Miller & Block, 2020).
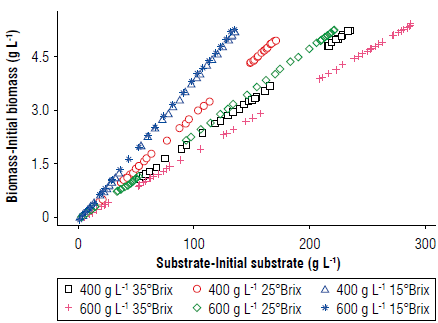
FIGURE 5 Evaluation of the experiment yields for the biomass/substrate interaction (Yx/s) with a diagram of biomass formation versus substrate consumption.
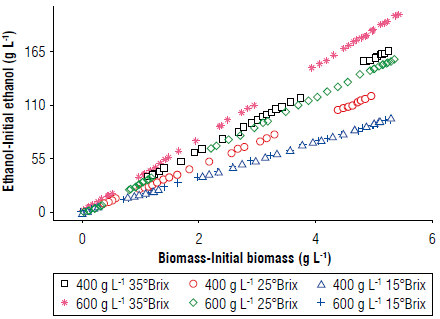
FIGURE 6 Evaluation of the experiment yields for the interaction of ethanol/biomass (Ye/X) with a diagram of the formation of ethanol versus biomass.
The data predicted the behavior of the biomass and substrate, calculating the missing factor, i.e., the kinetic constant of the ethanol production (y) through the reduction of least squares (Merger et al, 2016).
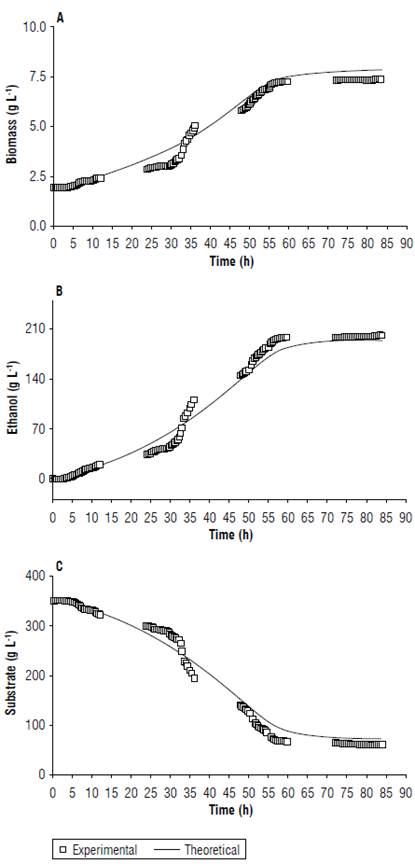
FIGURE 7 Evaluation of the variation between the kinetic model of fermentation and the experiment data for the contents of A) biomass, В) alcohol, and C) substrate in the fermentation of copoazú.
Fermentation kinetics parameters (Tab. 5) showed that the model adjusted favorably to the prediction of the experiment behavior of the substrate, biomass, and ethanol (Fig. 7). Additionally, the best yield was obtained with the treatment with 600 g L-1 of the substrate, adjusted with glucose at 35°Brix, and ending fermentation at approximately 60 h for subsequent maturation.
Diffusion kinetics
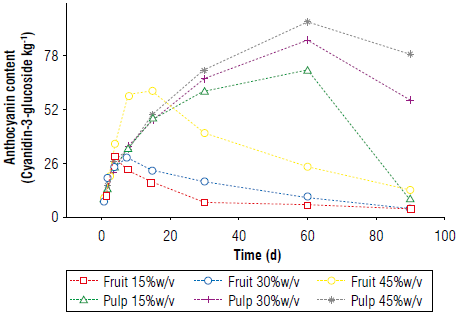
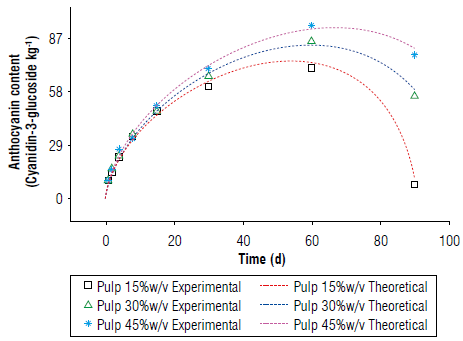
Anthocyanin content and peroxide value of the asaí liqueur The anthocyanin content initially increased and subsequently decreased (Fig. 8). For the asaí pulp, these readings resulted from the degradation of anthocyanins over time and the interaction processes with the pulp, reaching diffusive equilibrium. The lower anthocyanin content may have been due to the smaller transfer surface, although the drastic drop in a much shorter time compared to that of the pulp suggested that this behavior resulted from something in addition to the balance in the diffusion (Fig. 8) (Li et al, 2017; Li et al, 2018; Boeira et al, 2020).
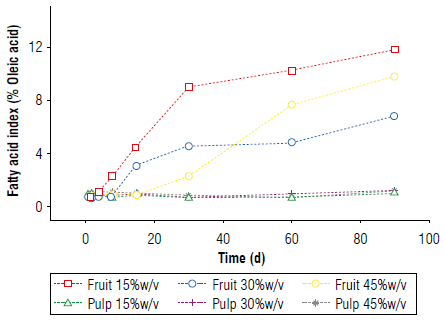
A lipid layer of fat was observed on the surface of the drinks because the fruits have a fat content of approximately 53% on a dry basis (Yuyama et al, 2011; Castillo et al., 2012). These lipids could contribute to oxidative rancidity, which was confirmed by measuring the acidity index of the fat in the beverages throughout the infusion, with changes in the index when the anthocyanin content decreased (Fig. 9). This demonstrated that the decrease in the antioxidant capacity and discoloration of the alcoholic beverages were strongly related to the rancidity of the fats in the liquor (Salaha et al., 2008; Andersen & Skibsted, 2010; Peixoto et al., 2016). This is why whole fruits were not utilized for the infusions and only the pulp was used, which had a lower percentage of fat that did not have a considerable negative effect on the drinks.
Diffusion kinetics parameters
It was not possible to adjust the anthocyanin content data during diffusion (Fig. 8) to Fick's law, which is the most common model for diffusive processes since it has variables that affect the content of this metabolite. Therefore, a mathematical model was proposed to understand diffusion kinetics that considers the saturation or interaction of anthocyanins in the system and the deterioration of anthocyanins, either by lipids or light, using the following equation:

where A refers to the diffusive process originating from the pulp; this phenomenon is inversely proportional to time and depends on the initial pulp quantity, which is inversely proportional to the anthocyanin concentration in the beverage and to time. В refers to the interaction of anthocyanins within the drink, which is inversely proportional to time; D is the degradation of these anthocyanins over time, which is inverse to the concentration of anthocyanins in the drink, and E is the transfer constant of this process (Shafirstein et al, 2004; Chung et al, 2016; 2017; Miller & Block, 2020). Each of these terms is expressed mathematically as follows, where С is the concentration expressed in mg of cyanidin-3-glucoside kg-1, t is time in days, and dC/ it is the variation of the concentration over time.
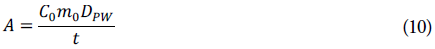
where C0 is the initial concentration of anthocyanins in the pulp, m0 is the initial fresh mass of the pulp in kg, and D PW is the diffusion constant.
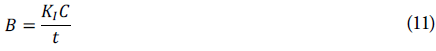
where К 1 is the interaction or saturation constant.
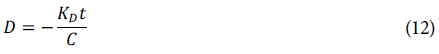
where K D is the decay constant.

where K t is the transfer constant.
Replacing these terms in the equation provides:
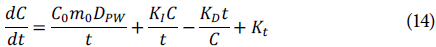
An evolutionary model was used to find the constants, which minimized the differences between the theoretical and experimental data. The initial values used for the estimation were obtained from the mean values of the segmented slopes of the experiment data, using the interaction constant for the diffusion constant from d 1 to 4, the transfer constant from d 4 to 15, the interaction constant from d 15 to 60, and the decay constant from d 60 to 90, obtaining the values in Table 6.
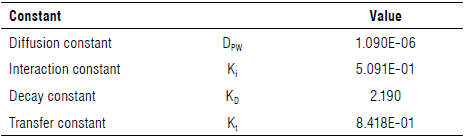
These parameters, when applied and compared to the experiment data, showed no significant difference (Fig. 10).
Conclusions
This study developed kinetic models for copoazú fermentation and asaí diffusion process, to obtain optimum liquor in each case.
In the copoazú liquor, ethanol production was favored by more complex sugars since they delay the inhibition process, either with ethanol or glycerol. The dependence of both products was evidenced in the values of the inhibition and saturation constants that defined the specific growth rate that, in turn, considerably affected the rate of change for the biomass, substrate, and alcohol. The best yield was observed with 600 g L-1 of copoazú pulp and glucose at 35 °Brix, achieving yields of up to 20% w/v in the alcohol content.
In the asaí liquor, when the fruit was used instead of the pulp, the fruit lipids caused unfavorable reactions that deteriorated the organoleptic and sensory properties of the liquor. This is an important factor in the relationship between the interaction constant and the decay constant since they define the turning point in the predictive behavior of the anthocyanin content, with the maximum near d 60. The best behavior was seen with the pulp at 45% (w/v) since the greater surface facilitated the exchange and transfer of mass. Additionally, a lower fat content was recorded, thus avoiding rancidity that deteriorates organoleptic characteristics. Anthocyanin content proves to be a good marker of beverage properties deterioration.

