


 English (pdf)
 Article in xml format
 Article references
 Send this article by e-mail
 Cited by SciELO
  Cited by Google
  Similars in
SciELO
Similars in
SciELO  Similars in Google
 Permalink
Introduction
The Orinoco basin is shared by Colombia and Venezuela and has an area of 981,446 km2. Thirty-five percent of this vast region is located in the equatorial zone of Colombia between 2°N and 10°N and 60°W and 75°W (Vásquez Cerón et al., 2019). In the savannah complex of the Orinoco basin, the Colombian Altillanura includes 2.8 million ha that, according to the CONPES document No. 3797 (DNP, 2014), has high agricultural potential with typical oxidic soils, where soybean is projected to have comparative and competitive advantages as a first-class raw material as balanced feed, especially for poultry, pigs, and the production of vegetable oil.
In the Altillanura only 39,793 ha are planted per year, including two sowing cycles, with a limited varietal offering and a production of close to 119,412 t of grain (FENALCE, 2021). This supply, representing less than 7% of the national demand, has motivated agribusinesses to approach national soybean production as an inclusive, economically viable, and ecologically sustainable regional agricultural development. Currently, the Corporación Colombiana de Investigación Agropecuaria - Agrosavia is carrying out a soybean breeding program for Oxisols from the Orinoquía region. This development aims to generate varieties adapted to the low tropics with high yield potential, vegetative cycles compatible to integrated crop rotation systems, tolerant to adverse biotic and abiotic factors. The importance of expanding the existing varietal genetic base for this vast region and the need to close the grain yield gap with varieties that exceed 3,400 kg ha-1 is highlighted.
The process of genetic breeding is arduous and complex. Its initial phase implies the introduction, characterization, and evaluation of diverse germplasm, a crossing plan in search of the best genetic combinations, and later a selection of superior individuals that will become advanced lines or potential varieties. These lines, their components, and sanitary behavior are evaluated in a first cycle through preliminary yield trial (PYT). Then, the best lines are subjected to multi-environment trials (MET) to determine their level of phenotypic stability. The most outstanding ones are subjected to regional (RT) or agronomic evaluation trials (AET), regulated by the Colombian Agricultural Institute (ICA, 2020), where the superior line or lines with identity attributes, homogeneity, and stability are registered as new cultivars.
Grain yield and other agronomic traits in genetic breeding programs have traditionally been valued using the classical generalized linear model (GLM). However, these models do not satisfy the statistical assumptions, particularly with unbalanced databases (Resende, 2007) nor through the predominant application of fixed factors usually analyzed through mean comparison tests such as DHS Tukey, Scheffé, and LSD, etc. There are statistical procedures, such as restricted maximum likelihood/best linear unbiased prediction (REML/BLUP), generically called a mixed model methodology (Sturion & Resende, 2010; Bandera-Fernández & Pérez-Pelea, 2018) that improves the estimation and prediction of genetic parameters and the effectiveness of selection to reduce these biases. Mixed models have provided valuable information for selecting lines by genetic merit. According to Piepho et al. (2008), BLUP is better in genetic breeding and variety evaluation precision than the best linear unbiased estimator (BLUE). The BLUP predictor has advantages over BLUE by reducing the response due to environmental effects and efficiently discriminating genotypes with high varietal potential (Pacheco et al., 2020). The mean associated with fixed-effects in BLUE is an average performed over all the effect levels in the population, while BLUP is a regression towards the general mean based on the variance and covariance components associated with the random-effects model (Casanoves & Balzarini, 2002). BLUP has a shrinkage property, so the prediction values tend to be less separated from the mean than the original values, increasing the precision of the analysis (Baselga & Blasco, 2008). In this sense, BLUP is a standard method for random effects and requires the estimation of the genetic variance (σ2g) and residual (σ2) components, preferably through REML (Mora & Arnhold, 2006). The latter compensates for the loss of degrees of freedom that results from the estimation of the fixed effects and produces less biased estimates (Patterson & Thompson, 1971). Overall, for authors such as Searle et al. (1992), Robinson (1991), Piepho and Mohring (2006), Resende (2016), and Volpato et al. (2019), REML/BLUP has become an effective procedure for estimating parameters and predicting genetic values to optimize selection.
Resende and Duarte (2007) suggest subjecting experiments with more than 10 cultivars or genotypes to a BLUP analysis as a random source of the mixed model. The genotype ranking could be similar for phenotypic selection and the one performed by BLUP when data are balanced. Although it is essential to link pedigree information in the genetic merit analysis, for Piepho et al. (2008), it is easy to exploit the information via BLUP through a simple mixed model without explicit reference to the pedigree. BLUP maximizes the correlation between the real and predicted genotypic values, i.e., the main objective of the breeder. In this regard, Panter and Allen (1995), evaluating highly related individuals, found that the kinship matrix link in the BLUP analysis is not justified. However, if the data of the historical parents are available in crosses that are not closely related, pedigree data should be included because it can improve the prediction accuracy of progeny performance.
Accordingly, the current research was carried out to select advanced soybean lines or potential varieties with high genetic merit and grain yield >3,500 kg ha-1 in a preliminary yield trial for Oxisols of the Colombian Orinoquean region, using the REML/BLUP methodology and its standardized BLUPe value.
Materials and methods
Study area
A preliminary yield trial (PYT) of 60 advanced soybean lines of the Agrosavia genetic breeding program and four commercial varieties (C. Superior 6, C. Achagua 8, C. Primavera 11, and Soyica P-34) was carried out during the second period of 2020 at the research center La Libertad, Villavicencio, Meta (Colombia). The study site is located at 4°22' N and 72°13' W, in Oxisols with a pH of 4.9, 5.9 mg L-1 of phosphorus, 2.4% of organic matter, and a base saturation of 57.3%.
Plant material, trials, and variables
The soybean lines and varieties were planted in plots with four rows of 5 m long, 0.45 m apart, with a distance between plants of 0.07 m. Mineral and biological fertilization with Bradyrhizobium japonicum was uniform according to soil analysis and crop requirements. The experimental units were distributed in an alpha lattice design proposed by Patterson and Williams (1976) of 8x8 with two replicates. Grain yield was evaluated as the response variable of interest for the BLUP analysis, and the following phenotypic variables that characterize the genotypes under study were registered.
Grain yield (GY) included grain weight in kg ha-1 per experimental unit and grain moisture contents of 14%; days to flowering (DF) was the number of days between emergence and flowering in the upper nodes of the plant; days to physiological maturity (DM) was the number of days from emergence to reaching 95% of mature pods in each plot, at which point the average height (H) and the number of nodes (NN) per plant were also recorded.
Additionally, the qualitative description of the lines was made using flower color (FC), growth habit (GH), and pubescence color (PC).
To determine water excess and deficits during the crop cycle, the hydric balance model (Allen et al., 2006) and the database of the meteorological station La Libertad ascribed to IDEAM were used. Real evapotranspiration was obtained using the tank coefficient (Kp) (Cruz Valderrama, 2015) and the FAO cultivation coefficients (Kc) (FAO, 2000).
Statistical analysis
In the analysis of variance, the statistical model described by Singh and Bhatia (2017) for incomplete blocks was applied (Equation 1):
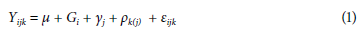
Where Y ijk is the phenotype of ith genotype in jth replication and k block; Gi is the genotype effect i=1,2........k; yj, is the replicate effect j= 1,2,......r; p k(j) is the block within replicate effect k= 1,2….S; εijk is the random error. For the statistical analysis, the matrix structure of the mixed linear model (Piepho et al., 2008) was applied using the SAS 9.4 software (SAS Institute, 2014). The variance components were estimated with the PROC MIXED/REML procedure of the SAS System (Bueno Filho & Vencovsky, 2000). This analysis considers lines and the block effects within the repetition as random effects. The comparison of means was carried out using the BLUP predictors (best linear unbiased prediction) that represent the predicted value for each genotype with respect to the general mean (Biasutti, 2012). The comparison of the BLUPs between lines/varieties was performed with the t statistic (Yan & Rajcan, 2002). This statistical comparator called BLUPe (standardized BLUP) was obtained from the relationship between the predicted empirical BLUP value and the associated prediction error. The BLUPe (standardized BLUP) was obtained from the BLUP predictor or predicted value for each genotype concerning the general mean (Yan & Rajcan, 2002). For the comparison analysis of the standardized predicted values, the genotypes are considered different if the BLUPe values met the following condition, with a t-test significance of 5%: (t1-t2)≥1.67 (V2) (Yan et al., 2002). Additionally, the probabilistic values generated by SAS/Mixed for each BLUPe were used to determine the superiority (P<0.05) or inferiority (P>0.05) of the lines/varieties concerning the general mean (Casanoves & Balzarini, 2002). The BLUPe pair GY were ordered in descending order to identify the genotypes or superior lines. This methodology allowed comparing free genetic values of environmental effects and not the phenotypic means to improve genetic gain in the subsequent selection cycle.
The elevated kinship of the parents that gave rise to the group of lines makes using the coefficient of coancestry in the BLUP analysis unnecessary since it does not represent a change in the results. Furthermore, when the purpose is to estimate the total genotypic value, it is reasonable not to use the coefficient of coancestry (Piepho et al., 2008).
The level of experimental precision in selecting superior lines was measured based on the square root of broad-sense heritability, calculated on a mean plot basis using the following equation (Hacker & Cuany, 1997):
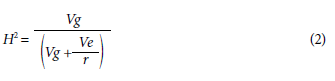
Where Vg represents genetic variance, Ve is the environmental variance, and r is the repetitions.
Results and discussion
The descriptive analysis of the variables DF, DM, H, NN, and GY (Tab. 1) allowed inferring a high variability as a genetic source for varietal improvement. The wide ranges of DF and DM (22 and 29 d, respectively) underlined the differential behavior of the genotypes in precociousness, together with the high variation of H, NN, and GY. In general, the lines and varieties with indeterminate GH showed higher H than those with semi-determined GH, and these, in turn, were higher than those with determined GH. Plants with indeterminate GH continue to grow for a long time after flowering, while those with determinate GH finish stem growth when or shortly after flowering begins, often resulting in fewer nodes than the indeterminate GH (Fehr & Caviness, 1977). These differences in H and GH do not necessarily represent lower yields in those with determined GH since agronomic-importance traits such as GY are quantitative (Volpato et al., 2019), where the environmental effect represents a large part of the variation. In the analysis of variance, highly significant differences (P<0.01) between lines and varieties were ratified for the case of GY by BLUPe predictor values ranging between 5.37 and -3.71. The GY range was between 1,117 and 4,431 kg ha-1. It is noteworthy that, in the edaphoclimatic conditions of the current study, there were no phytosanitary problems that affected the GY response variable.
A highly significant positive Pearson correlation (P<0.01) was found between GY and DM (r=0.32) that means that the higher the DM, the higher the GY under the agroclimatic conditions of the preliminary yield trial. In contrast, a shortening of the filling period is frequently associated with decreasing grain weight (Kantolic et al., 2004).
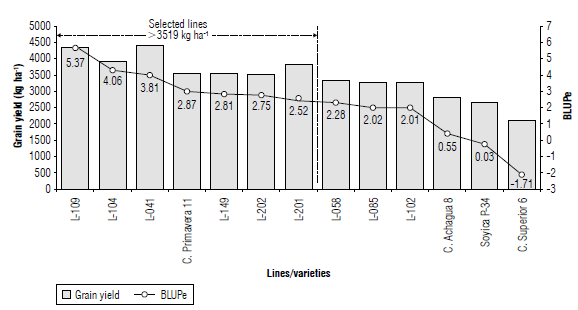
BLUPe vs. grain yield
The BLUP and BLUPe predictors and the significance of the random effects for GY are presented in Table 2. The BLUPe (t1-t2)≥1.67 (V2) comparator allowed an effective differentiation of the genotypes; by ordering them in descending order, a range with a maximum of 5.37 and a minimum of -3.71 for lines L-019 and L-078 was reached. Genotypes with positive BLUPe for GY were classified as higher, and those with a negative value were considered lower with respect to the general mean of 2,682 kg ha-1. The higher the BLUPe, the greater the probability of success in selecting superior lines. The standardized BLUP (BLUPe) is more discriminant than the empirical BLUP when selecting outstanding lines because the prediction error adjusts it (Casanoves & Balzarini, 2002). Therefore, a higher mean does not necessarily represent a higher BLUPe, as occurs between lines L-041 and L-104. The lines with GY>3,519 kg ha-1 showed statistical differences (P>| t |) concerning the general mean and positive BLUPe ≥ 2.52 (Fig. 1), and they constituted promising lines or potential varieties. In descending order, the GY (kg ha-1) were: L-041 (4,431), L-019 (4,326), L-104 (3,923), L-201 (3,832), L-149 (3,536), and L-202 (3,519), with higher GY for the Colombian Orinoco region.
TABLE 1 Descriptive analysis of agronomic and yield characteristics of lines evaluated.
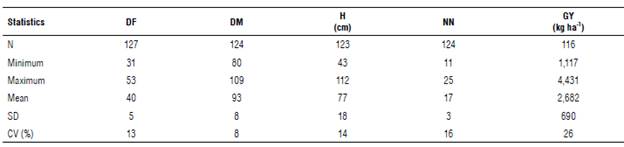
DF: days to flowering; DM: days to physiological maturity; H: average plant height at maturity; NN: average number of nodes; GY: grain yield; N: data number; SD: standard deviation; CV: coefficient of variation.
TABLE 2 Grain yield (GY kg ha-1), BLUP and BLUPe predictors, and significance level of soybean lines and varieties in the preliminary yield trial (PYT), Research Center La Libertad, Orinoquía, 2020.
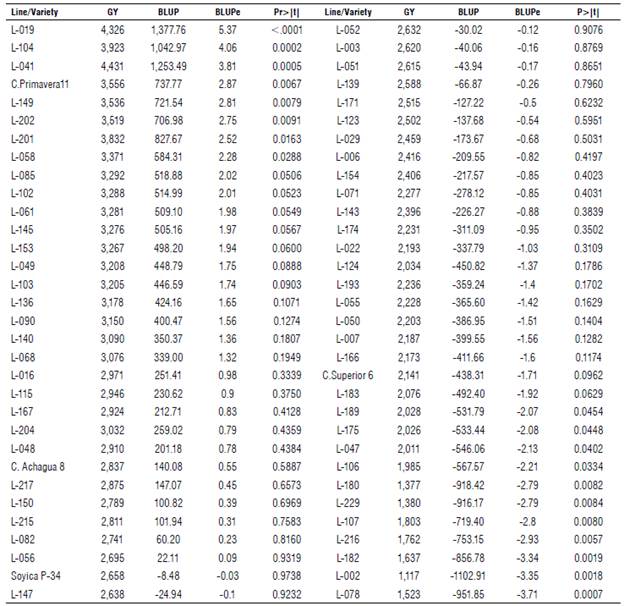
BLUP: best linear unbiased predictor; Standardized BLUP: BLUPe=BLUP/prediction error; P>| t |: t-value probability; GY: grain yield (kg ha-1).
The genetic base of these lines includes the varieties that were developed for the Colombian Orinoco, such as Orinoquia 3, C. Libertad 4, and C. Taluma 5, sources of adaptation to the low tropics, with prominent differences in precocity and high yield potential that were crossed with elite materials from the EMBRAPA variety bank (Brazil).
The only control variety that exceeded the general average was C. Primavera 11, although with a BLUPe significantly lower than L-019. The other controls did not differ statistically from the mean, where the C Achagua 8 variety had a positive BLUPe (0.55), while in the Soyica P-34 and C. Superior 6 varieties, the predictor was negative (-0.03 and -1.71). The upper lines, representing a selection pressure of 10% with an estimated genetic gain of 37.2% concerning the average, were subjected to multi-environment trials to assess their behavior in different agroclimatic conditions and establish their phenotypic stability.
The correlation between grain yield (GY) and BLUP predictors was 0.997, and the BLUPe value was 0.985, meaning that phenotypic selection and predicted values are equally effective for selection in the target population. However, there is no doubt that BLUPe is very useful when deciding about the upper lines, mainly when the data are unbalanced, while Tukey's (5%) mean comparison test did not allow the precise discrimination of the lines. Several researchers have shown significant and positive correlations between predicted genetic and observed yield values (Casanoves & Balzarini, 2002; Milla-Lewis & Isleib, 2005), a highly dependent situation on trait heritability.
Grain yield showed a genetic variance of 381,356 (P<0.01), an error variance of 137,426 (P<0.01), a heritability value of 84.7%, and 92% efficiency in selecting the best lines, consistent with Falconer (1981), where the selection of lines for their phenotypic values is effective when the heritability is high In this sense, Souza et al. (2000) finds that when heritability is low or very low, the correlation between genetic values predicted by BLUP and phenotypic values is also low. If heritability is moderate, the genetic values obtained by BLUP will allow a better classification of genotypes than the phenotypic values for a more efficient selection.
Generally, the genotypic variance in its optimal environment in soybean is higher than in stress environments. However, Ceccarelli (1989) states that even when the heritability of a specific trait in a stressful environment is always lower than in the optimal environment, this is not clear evidence that selection should be conducted only in optimal environments. Therefore, following the criteria stated by Allen et al. (1978) concerning heritability and how to conduct selection, promising lines should be subjected to multi-environment trials to identify the more stable and profitable ones for farmers in the Colombian Orinoco region.
Hydric balance vs. grain yield
During the experimental crop cycle, precipitation was variable in frequency and intensity, reaching a total volume of 618 mm from sowing to harvest, close to the water requirement of the crop in the Orinoco of 350 mm and 550 mm (Almansa, 2006). The hydric balance (Fig. 2) diagram elaborated for soybean in the study site showed a marked variability when excesses and deficits occurred. Although the excesses in the Colombian Orinoco are more noticeable in the first semester of the year and the deficits in the second semester, it is frequent to observe marked variations in the same semester. These variations in water resource availability affect plants according to the moment of occurrence of the stress and the genotype. In general, the lines similar to the early control C. Superior 6 with DM between 81 and 84 and with a determined or semi-determined GH were highly affected by a water deficit of 13.87 mm between September 15 and 21, and very marked on September 17 and 18 (3.9 and 4.7 mm, respectively), with temperatures above 31°C, coinciding with the reproductive phase of the beginning of pod formation (R3). Almansa (2006) determines that soybean cultivation consumes 4.5 mm of water per day, and an absence of rain for four days makes irrigation necessary. According to Giménez (2014), severe water deficiencies can produce very substantial yield losses (40% or more), mainly when they occur in the critical period of pod formation and filling (Fehr & Caviness, 1977; Sawchik et al., 2013). If the water deficit occurs between R3 -R5, it significantly affects the number of grains, and if it does so later, it affects the weight of the grains. Additionally, high temperatures with water deficit during flowering and grain filling cause physiological changes such as stomatal closure that in turn causes premature leaf and flower drop, embryonic abortions, pod drop, and reduced grain yield.
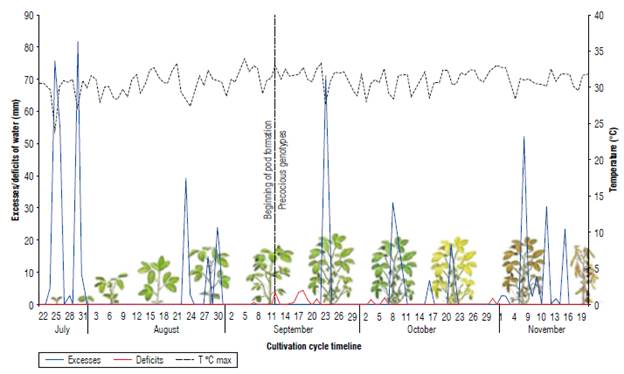
FIGURE 2 Water excesses and deficits, and average temperature during the soybean cultivation cycle. Research Center La Libertad, Orinoqufa, 2020.
Water excesses in the filling phase and physiological maturity were also decisive when selecting promising lines. In this sense, the control variety C Primavera 11 with a semi-determined GH and an intermediate cycle (102 DM), although it reached a GY of 3,556 kg ha-1, also showed high foliar retention and a non-uniform population that negatively affected harvest and grain quality. Carvajal et al. (2017) find that alternate periods of wetting and drying the grains inside the pods result in a marked grain or future seed deterioration. In contrast, the selected lines used in this research had uniform maturity and drying.
It is indisputable that the significant differences in GY between lines and varieties are due to the genetics and physiology of the plants in response to local environmental conditions, particularly associated with water and thermal availability. These occur during plant development and differentially influence cultivars according to their early, intermediate, or late cycle, also dependent on the moment of occurrence and intensity of the stress, the genotype, and its photoperiodic sensitivity (Sawchik et ah, 2013). Therefore, a timely sowing date, adequate plant population, and water and nutrient availability in the critical phases (R3-R6) will maximize grain production.
It is essential to highlight that in the edaphoclimatic conditions of Orinoquia the selection of very precocious genotypes can reduce plant growth and final grain yield. In contrast, in the very late genotypes, the maturity of the pods is ostensibly delayed, favoring the incidence of diseases, pests, weed competition, and poor seed quality due to the variable occurrence of rainfall after maturity. The selected lines have as a comparative advantage an intermediate ripening period (88-105 d after emergence), uniform drying, and good grain quality. Some morphoagronomic traits of the promising lines are presented in Table 3.
TABLE 3 Morphoagronomic traits of selected soybean lines from the Research Center La Libertad, Orinoquia, 2020.
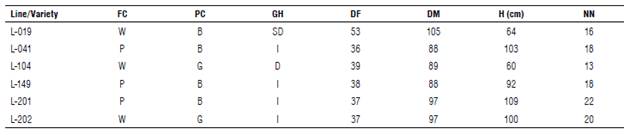
FC: flower color [(white (W) and purple (P)]; PC: pubescence color [(brown (B) and gray (G)]; GH: growth habit: [determinate (D), seml-determlnate (SD), and Indeterminate (I)]; DF: days to flowering; DM: days to physiological maturity; H: average plant height at maturity; NN: average number of nodes.
The subsequent evaluation of these lines in MET should guarantee the genotype-by-environment interaction (GxE) assessment to select the future phenotypically stable variety or varieties with a higher genetic potential to be cultivated in Oxisols of the Orinoquia region. However, although there was broad variability in the population of soybean lines/varieties under study, the genetic base of the genetic breeding program remains narrow. Access to foreign germ-plasm and the implementation of moderate genotyping and high-performance phenotyping tools are necessary to accelerate the genetic gain of future cultivars for current and potential areas of Colombia through genomic selection.
Conclusions
The application of mixed models using the REML/BLUP procedure allowed the generation of a standardized predictor (BLUPe) useful for the effective classification and selection of potential lines or varieties due to the high genetic merit obtained. With a heritability of 84.7% for GY and a selection pressure of 10%, six lines with positive BLUPe values ≥ 2.52 and grain yields higher than 3,519 kg ha-1 were identified: L-019, L-041, L-104, L-149, L-201, and L-202. These lines have an intermediate period to physiological maturation of 88-105 d after emergence, uniform drying, and good grain quality. These lines will be subjected to multi-environment yield trials to determine their phenotypic stability and select the line or lines with the highest genetic potential for ICA registration as a variety or varieties for the Colombian Orinoco.

