


 English (pdf)
 Article in xml format
 Article references
 Send this article by e-mail
 Cited by SciELO
  Cited by Google
  Similars in
SciELO
Similars in
SciELO  Similars in Google
 Permalink
Introduction
Because of its amount of protein and the possibility of derived products, wheat (Triticum aestivum L.) is an important part of the human diet. It is currently the main source of protein and carbohydrates for humans (Shewry et al., 2016). In this context, wheat corresponds to 30% of world grain production (United States Department of Agriculture - USDA, 2018). In Brazil, wheat production occurs mainly in the southern region that generated about 90% of the 6.2 million t produced in 2020 (Companhia Nacional de Abastecimento - CONAB, 2021). Even so, Brazil needs to import about 5.8 million t ofwheat (Conab, 2021). Pasinato et al. (2018) point out that despite the low participation in the total wheat production, the Cerrado region of Brazil is a potential for production of this crop, increasing national production. However, the expansion of agricultural frontiers depends on the generation of cultivars adapted to new locations, like the Brazilian Cerrado. National expansion is fostered especially by the participation of wheat in the country's food security, since it is an affordable source of nutrition for a large part of the population, especially those with low-middle income. In addition, wheat is essential in sustainable agricultural systems (Hickey et al., 2019).
The plant breeding pipeline depends on the formation of segregating populations with a potential for selection. To this end, it is necessary that parental lines concentrate favorable alleles for the traits of interest, allowing the production of superior individuals after hybridization (Fasahat et al, 2016). In breeding programs, several segregating populations are produced and evaluated. However, only a small portion of them has the potential to obtain superior genotypes. This slows the progress, because of unsatisfactory segregating populations requiring work and resources. Methodologies capable of making the process more efficient are used, such as genomic selection (Merrick et al., 2022) or diallel analysis. The latter is more suitable to the reality of Brazilian public research, since the implementation of genomic selection is the enormous cost of genotyping, as well as the need to develop infrastructure for genotyping thousands of progenies (Juliana et al, 2020).
Diallelic analysis allows studying and selecting the best combinations of parents through the evaluation of the generated progenies. This evaluation seeks to identify parents with a high allelic complementarity. In addition, it allows the determination of the predominant gene action in the expression of a trait (Cruz et al., 2014). Some previous studies describe diallel analysis on wheat (Pimentel et al., 2013; Pagliosa et al, 2017; Akel et al, 2018; Pelegrin et al, 2020).
The difficulty in obtaining a satisfactory number of seeds in the F1 generation limits the use of robust statistical designs or a greater number of repetitions. Thus, generations with a greater seed availability, such as F2, can be used efficiently in the diallel analysis of wheat, resulting in accurate predictions (Masood & Kronstad, 2000). There is also the mixed model methodology, where the use of the best linear unbiased predictor (BLUP) that considers components of variance estimated by restricted maximum likelihood (REML), allows breeders to select and predict genetic values efficiently and accurately (Resende, 2016).
It is common in wheat breeding programs to evaluate several genotypes and select promising ones according to the main traits of interest. When talking into account a large number of traits, truncated and indirect selection is limited, since it becomes efficient only for traits with high genetic association. With the use of selection indexes, we seek to obtain simultaneous gains for several traits, facilitating decision-making for the selection of populations (Céron-Rojas & Crossa, 2020). In addition, the gains are better distributed among the set of traits considered important for selection in the breeding program.
Studies on improvement of tropical wheat in Brazil are still scarce and contrast with the need to achieve self-sufficiency in wheat. According to Pereira et al. (2019), the great potential of wheat in tropical regions requires the development of genotypes that are adapted to local climatic conditions and show a desirable agronomic level. Thus, the objective of this work was to select promising tropical F2 populations of wheat based on estimations of combining ability of elite parent plants using REML/BLUP.
Materials and methods
Cultivar combinations
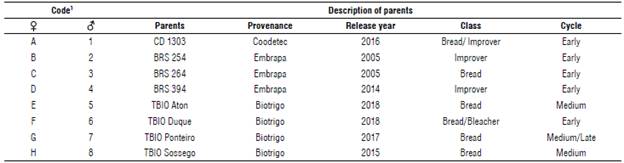
For crosses, eight wheat cultivars recommended for cultivation in the Brazilian tropical region (Registro Nacional de Cultivares - RNC, 2022) were selected based on agronomic parameters and technological quality of the flour (Tab. 1). The cultivars were combined in a complete diallel design, resulting in 56 hybrid combinations. The crosses were carried out between August and October 2019 in a greenhouse belonging to the Departamento de Agronomia da Universidade Federal de Vicosa, in the state of Minas Gerais, Brazil.
Generation advance
The seeds from crossings were harvested at physiological maturity, manually treshed, and stored in a cold chamber.
The F1 seeds of each combination were sown in February 2020 in a greenhouse to advance the generation and production of F2 seeds. Harvesting was carried out in mid-May 2020. The spikes were trailed and the F2 was sowed in a field at the beginning of June 2020.
F2 population evaluation
The field experiment was carried out during the 2020 winter at the Universidade Federal de Vicosa, Vicosa, MG, Brazil experimental area (20°45'14"S; 42°52'55"W; 648 m a.s.l.). The seeds harvested from F1 plants (56 F2 combinations) and the eight parents comprised the 64 treatments. These were sown in a simple lattice design (8x8), with 2 replicates. The experimental plots were composed of three 3 m long lines spaced 0.2 m apart, totaling plots of 0.6 m-2. The sowing density was ten seeds per linear meter, that is, with spaced plants and following the pedigree conduction method, as used by McVetty and Evans (1980).
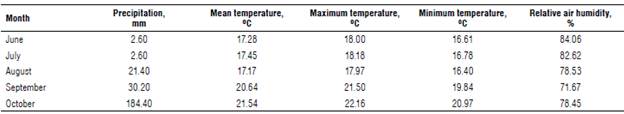
Fertilization consisted of 300 kg ha-1 of N-P-K (08-28-16) plus a cover fertilization of 90 kg ha-1 of N divided in two phenological stages, 50% at the beginning of tillering and 50% in the heading phases 21 and 45, according to the scale of Zadoks et al. (1974). The nitrogen source used urea (46% N), totaling 200 kg ha-1. Chemical weed control was performed using the active ingredient metsulfuron methyl at a dose of 5 g ha-1 of the commercial product approximately 20 d after plant emergence. For chemical control of aphids (Metopolophium dirhodum and Sitobion avenae), the active ingredient acetamiprid was used at a dose of 375 g ha-1 of commercial product at the post-anthesis phase. For diseases, chemical control was not performed in order to verify the natural reaction of the genotypes. The experiment was carried out with sprinkler irrigation according to the water needs of the genotypes. The climatic conditions of the field assessment cycle are displayed in the Table 2.
Evaluated traits
The following traits were evaluated: severity of tan spot (Pyrenophora tritici-repentis) following the scale proposed by Lamari and Bernier (1989) (1 = resistant, 5 = susceptible), wheat head blast (WHB) severity (Magnaporthe oryzae pathotype Triticum) following an adapted scale, initially proposed by Maciel et al. (2013) (1 = 0%, 12 = 100%). Days to heading were evaluated in days began from the phase 10 (first leaf appearance after the coleoptile) to the phase 54 (half of inflorescences emerging from the sheath of the flag leaf) following Zadoks et al. (1974). Spike height was measured by a ruler graduated in cm from the base of the plant to the spike insertion, and total weight of dry grains of the plot was measured in grams using a precision scale.
Statistical analysis
Data were evaluated according to the methodology of maximum restricted likelihood/best linear unbiased prediction (REML/BLUP). To estimate the variance components (REML), predict the genotypic values (BLUP), and estimate the values of general combining ability (GCA) and specific combining ability (SCA), the model 192 of the software Selegen-REML/BLUP was used (Resende, 2017). It simultaneously fits one model for crosses and another one for parents.
The following model was used to adjust intersections:
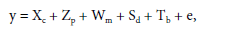
where y is the phenotypic vector, c is the fixed effect of the general mean of crosses, p is the vector of effects of the general combining ability of paternal (random) parents (p~N(0, σ2 p)), m is the vector of effects of general combining ability of maternal (random) parents (m~N(0, σ2 m)), d is the vector of effects of specific combining ability of (random) crosses (d~N(0, σ2 SCA)), b is the vector of (random) block effects (b~N(0, σ2 b)), and e is the vector of (random) error effects and (e ~N(0, σ2 e)). X, Z, W, S, and T are incidence matrices for their respective effects.
The adjustment of effects of parents was performed using the following model:
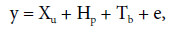
where y is the phenotypic vector, u is the fixed effect of the general mean of parents, p is the vector of additive genetic effects of parents (random) (p~N(0, σ2 b)), b is the vector of (random) block effects (b~N(0, σ2 g)), and e is the vector of (random) error effects (e~N(0, σ2 g)). X, H, and T are incidence matrices.
The additive genetic variance (
 ) was estimated as follows:
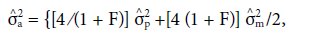
where
 is the genetic variance of paternal parents,
 is the genetic variance of maternal parents, and F is the inbreeding coefficient (F=1).
Variance due to dominance deviations (
 ) was estimated according to the formula:
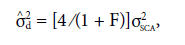
where σ2 SCA is the variance of specific combining ability.
Heritability in the narrow sense (
 ) and dominance (
 ) were estimated as follow:
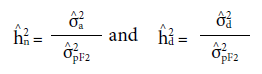
respectively, where aA 2pF2 is the phenotypic variance of the populations evaluated.
The genotypic values (GV) of the F2 populations were expressed as:
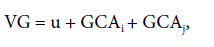
where u is the general mean of the trait, GCAi is the value of the general combining ability of parent i, GCAj is the value of the general combining ability of parent j.
Simultaneous selection on genotype values (GV) of all the evaluated traits was applied considering the selection of 20% of the superior populations. We calculated the multiplicative index (Subandi et al, 1973) according to the following expression:
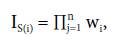
where IS(i) is the multiplicative index for the populations i; wi = xij - kj, where xij the observed population value for population i in trait j (VG), kj is the selection criterion for the trait j assuming wi = 0, if xi) - k > 0 for the traits tan spot, blast, heading and spike height and if xij - k, < 0 for the trait total weight. The kj is defined as the maximum or minimum value established for each trait. In this study, the criterion we adopted was the mean genotypic value of the trait ± genotypic standard deviation. For the traits that satisfy the condition (kj ), the value of the difference xij - kj is used in productive (n). Populations that do not meet the criteria receive a value of zero, making I S(i) null, so it cannot be selected. Statistical analyses were performed using the software Selegen REML/BLUP (Resende, 2016) and the graphs were plotted using the software R (R Development Core Team, 2020).
Results and discussion
Estimates of genetic parameters by REML
Table 3 shows a significance of 5% for the variance between maternal parents (
 ) or for the general combining ability for maternal parents for all analyzed traits. In turn, considering the paternal parents, the general ability to combine paternal parents (
 ), the traits of days to heading, and total grain weight were significant. The specific combining ability (
 ) only for the trait spike height was significant. In general, there is a greater participation of additive effects in relation to the effects of dominance. This is because most traits have a higher significance for the effects of GCA, either by the paternal or maternal parent, than for the effects of SCA.
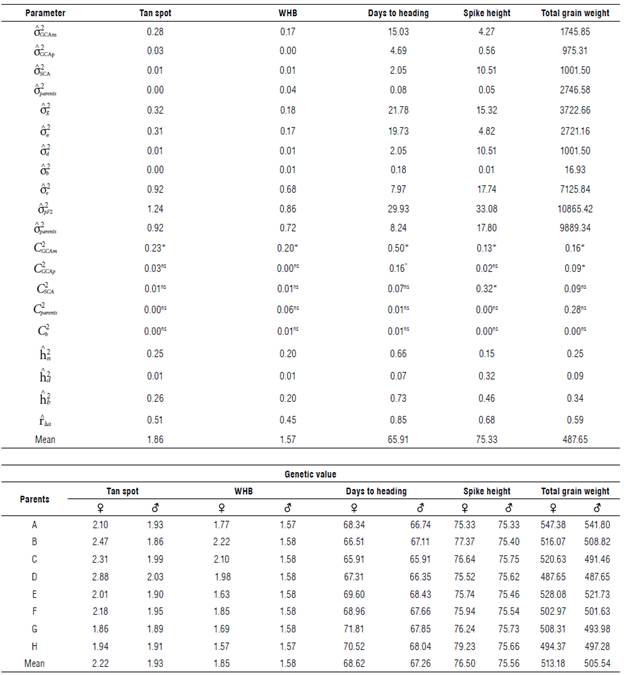
TABLE 3 Estimation of genetic parameters for the traits tan spot (scale), blast severity (scale), days to heading (d), spike height (cm), and total weight of dry grains (g) in 64 tropical wheat genotypes and average genotypic values of maternal parents (♀) and paternal parents (♂).
* significant and ns non-significant by the x
2 test at 5% probability;  = variance of the GCA of the maternal parents;
  = variance of the GCA of the paternal parents;
  = variance of the SCA of the F2 populations;
  = genotypic variance between parents;
  = genetic variance;
  = additive genetic variance;
  = dominance variance;
  = block variance;
  = error variance; = phenotypic variance between F2 populations; = phenotypic variance between parents; = coefficient for determining the GCA effects of paternal parents; = coefficient for determining the GCA effects maternal parents; = coefficient for determining the SCA effects; = coefficient for determining the parents effects; c2 = coefficient for determining the block effects; = narrow-sense heritability; = heritability of values due to deviations in dominance; = broad-sense heritability; = accuracy; A= CD 1303; B= BRS 254; C= BRS 264; D= BRS 394; E= TBIO Aton; F= TBIO Duque; G= TBIO Ponteiro; H= TBIO Sossego; WHB= wheat head blast.
Both heritability in the narrow sense (
 ) and in the broad sense (
 ) obtained the highest values for the trait days to heading. Such heritability, according to Resende (2002), is considered moderate (0.15 < h2 < 0.50) and high (h2 > 0.50). According to the classification proposed by Resende and Duarte (2007), the selective accuracy is classified as moderate (0.40 <
 < 0.65) for tan spot, blast, and total weight, and high (0.65 <
 <0.85) for days to heading and spike height.
The decomposition of the phenotypic variance component of the F2 populations (
 ) (Tab. 3) into genetic variance (σ2
g), additive genetic variance (σ2) and genetic variance due to dominance deviations (σ2
d) allows verification of a greater participation of additive effects in all traits with the exception of spike height, for which the variance of dominance effects had the highest proportion. Ljubicic et al. (2017) demonstrated predominant dominance effects when studying productive variables in diallel analysis. When identifying and selecting superior genotypes, σ2
a is a fundamental component to quantify the potential of populations (Cruz et al., 2014). Its greater participation in the composition of genetic variance allows using direct strategies to increase the frequency of favorable alleles to a given trait. This also happens with the presence of the significance of GCA effects in comparison with non-significant effects of SCA. In this sense, it is noteworthy that 98.1% of variation effects for the trait tan spot severity are due to GCA effects (
) (Tab. 3) into genetic variance (σ2
g), additive genetic variance (σ2) and genetic variance due to dominance deviations (σ2
d) allows verification of a greater participation of additive effects in all traits with the exception of spike height, for which the variance of dominance effects had the highest proportion. Ljubicic et al. (2017) demonstrated predominant dominance effects when studying productive variables in diallel analysis. When identifying and selecting superior genotypes, σ2
a is a fundamental component to quantify the potential of populations (Cruz et al., 2014). Its greater participation in the composition of genetic variance allows using direct strategies to increase the frequency of favorable alleles to a given trait. This also happens with the presence of the significance of GCA effects in comparison with non-significant effects of SCA. In this sense, it is noteworthy that 98.1% of variation effects for the trait tan spot severity are due to GCA effects (

 ), which is similar to blast severity (97.70%), as well as days to heading (90.40%), and total grain weight (73.10%). Spike height, in turn, differs from the others. There is a greater share of effects of specific combining ability σ 2
SCA in relation to GCA effects with σ2
SCA corresponding to 68.5% of the variation. There are similar results when analyzing wheat productivity (Pimentel et al., 2013; Pagliosa et al., 2017), plant height, and days to heading (Akel et al., 2018).
), which is similar to blast severity (97.70%), as well as days to heading (90.40%), and total grain weight (73.10%). Spike height, in turn, differs from the others. There is a greater share of effects of specific combining ability σ 2
SCA in relation to GCA effects with σ2
SCA corresponding to 68.5% of the variation. There are similar results when analyzing wheat productivity (Pimentel et al., 2013; Pagliosa et al., 2017), plant height, and days to heading (Akel et al., 2018).
Estimates of GCA and SCA
Figure 1 shows the estimates of the effects of general combining ability (GCA) of each parent for each trait, whereas Table 3 shows the means of each parent. Although with different magnitudes, there was agreement between the estimates of GCA effects for parents considering maternal and considering paternal parents.
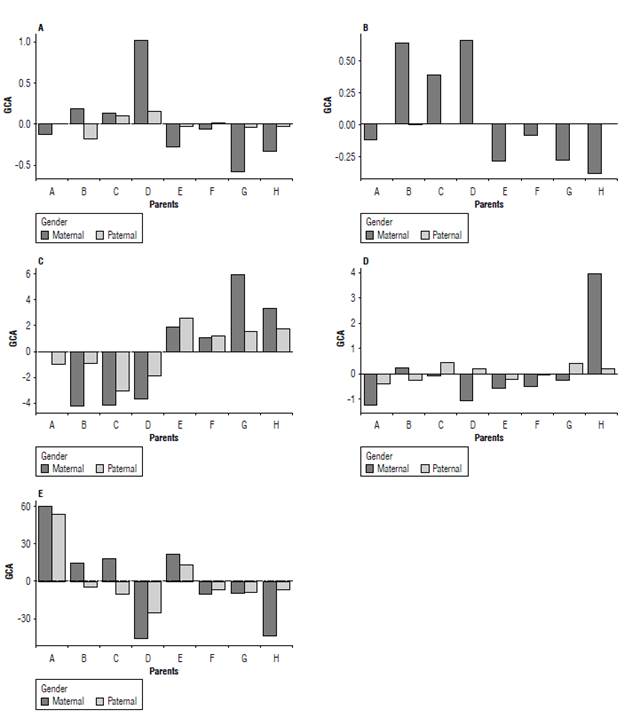
FIGURE 1 General combining ability (GCA) for tan spot severity (A), wheat head blast-WHB severity (B), days to heading (C), spike height (D), and total grain weight (E) of eight tropical wheat parents by diallel analysis via REML/BLUR
There were negative effects of GCA for the two disease severity traits, tan spot and blast, for the parents CD 1303 (A), TBIO Aton (E), TBIO Duque (F), TBIO Ponteiro (G), and TBIO Sossego (H). They ranged from -0.03 (TBIO Aton) to -0.58 (TBIO Ponteiro) (Fig. 1A) and from -0.09 (TBIO Duque) to -0.39 (TBIO Sossego) (Fig. 1B) for tan spot and blast. Still, among the traits in which negative GCA effects are desired days to heading (Fig. 1C) the group of parents belonging to the breeder company, Embrapa and Coodetec showed negative GCA effects. These effects ranged from -0.01 (CD 1303) to -4.23 (BRS 264). For spike height (Fig. 1D), only the parent TBIO Sossego had no negative GCA effect considering both paternal and maternal parents. The CD 1303, TBIO Aton, and TBIO Duque parents showed negative GCA effects simultaneously for both maternal and paternal parents.
In general, the effects of specific combining ability (SCA) were of low magnitude (from -0.01 to 0.01) for both tan spot severity (Fig. 2A) and WHB severity (Fig. 2B). Populations with negative SCA effects and the presence of at least one parent with a negative GCA for these traits stood out among ten F2 populations for severity of tan spot and five F2 populations for severity of WHB (B1, C1, C8, D5, and D7). For days to heading, 25 F2 populations showed a negative SCA effect (Fig. 2C) that varied from -0.03 (A3) to -1.72 (G3). The total variation of the negative SCA effects for spike height was -7.99 (G2) to 4.39 (B5) (Fig. 2D).
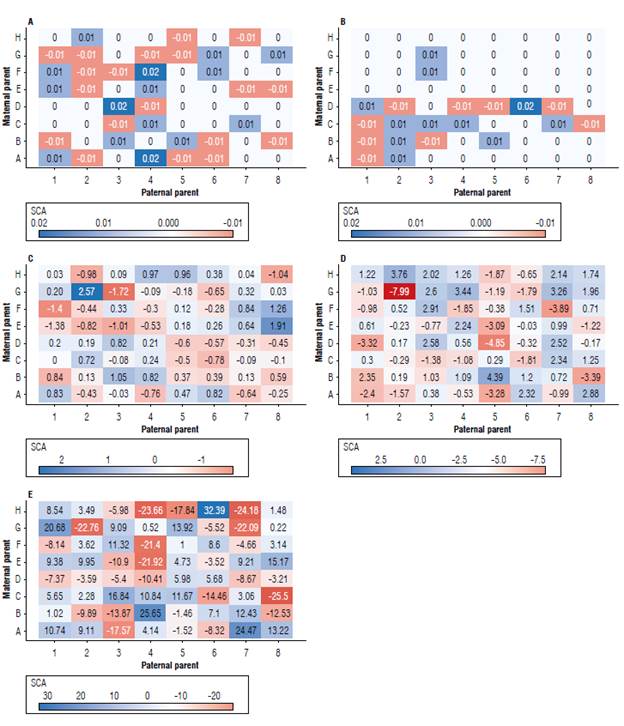
FIGURE 2 Specific combining ability (SCA) for tan spot severity (A), whea head blast-WHB severity (B), days to heading (C), spike height (D), and total grain weight (E) of eight tropical wheat parents by diallel analysis via REML/BLUR
However, when targeting populations with negative SCA effects and at least one parent with a negative GCA, 24 populations stood out. The trait total grain weight (Fig. 2E), combining positive SCA and GCA effects, comprises a group of 20 promising F2 populations with a SCA variation from 1.00 (F5) to 24.47 (A7).
The estimate of SCA of parents (A1, B2, C3, D4, E5, F6, G7, and H8) (Fig 2A-E) showed an alternation of signals: for tan spot and WHB, the SCA was zero. However, for days to heading, the parents A1, D4, E5, and G7 had a positive SCA, and the others had a negative SCA. For the trait spike height, the parents who had positive SCA were D4, F6, G7, and H8, while for total grain weight, the parents with positive SCA were A1, C3, E5, F6, and H8.
Considering paternal parents, the lack of significance of GCA effects for some traits (Tab. 3) showed that the mean number of favorable alleles is similar between genotypes. This may be because the parents used here were commercial cultivars with already desirable agronomic traits; therefore, they already shared a set of favorable alleles. The SCA was expressed as a function of deviations in dominance and genetic diversity between parents. Although there was diversity between parents, the non-significance of SCA effects for tan spot, WHB, days to heading, and total grain weight could have been the result of a small contribution of dominance effects on the expression of traits in the evaluated generation (F2) in which heterosis was reduced to half its initial value. Low contributions are stressed by the low values of
 by Pimentel et al. (2013), who also did not observe a heterotic effect for productivity, although other authors observe this in studies with durum wheat (Akel et al, 2018).
In the improvement of self-pollinated species such as wheat, the final selected progenie plants are homozygous lines, which suggest the additive effects explained by the value of heritability in the narrow sense
 . Non-additive effects, such as dominance deviation effects, make improvement more complicated since their expression occurs in heterozygous individuals. Along with the advance of generations, heterozygosity reduces by half. Thus, the effects of additive predominance reported in this work are satisfactory for obtaining superior lines, confirmed by observing the values of
. Elias et al. (1989) evaluate F4 and F5 populations of wheat and observe a
mean of 0.73 for tan spot, a value higher than that reported in the present study. However, the generations considered in that study have a higher degree of homozygosity, in which effects due to deviations in dominance become insignificant, remaining only additive effects. Juliana et al. (2020) find resistance to WHB in 1.11 accessions of wheat from the germplasm bank of the International Maize and Wheat Improvement Center (CIMMYT) in different environments, and they report a
ranging from 0.49 to 0.87. Previous research analyze the h2 days to heading and plant height. The latter is correlated to spike height in F2 populations of wheat (Afridi et al., 2017), observing values of
of 0.35 for days to heading and 0.45 for plant height. Pimentel et al. (2014), in turn, studying the
of grain productivity in F2 populations of tropical wheat report a
of 0.01, lower than that of the present study.
. Non-additive effects, such as dominance deviation effects, make improvement more complicated since their expression occurs in heterozygous individuals. Along with the advance of generations, heterozygosity reduces by half. Thus, the effects of additive predominance reported in this work are satisfactory for obtaining superior lines, confirmed by observing the values of
. Elias et al. (1989) evaluate F4 and F5 populations of wheat and observe a
mean of 0.73 for tan spot, a value higher than that reported in the present study. However, the generations considered in that study have a higher degree of homozygosity, in which effects due to deviations in dominance become insignificant, remaining only additive effects. Juliana et al. (2020) find resistance to WHB in 1.11 accessions of wheat from the germplasm bank of the International Maize and Wheat Improvement Center (CIMMYT) in different environments, and they report a
ranging from 0.49 to 0.87. Previous research analyze the h2 days to heading and plant height. The latter is correlated to spike height in F2 populations of wheat (Afridi et al., 2017), observing values of
of 0.35 for days to heading and 0.45 for plant height. Pimentel et al. (2014), in turn, studying the
of grain productivity in F2 populations of tropical wheat report a
of 0.01, lower than that of the present study.
Selection based on GCA and SCA
Considering that scales of tan spot and wheat head blast (WHB) scores used in the study considered resistant plants those with the lowest scores, we recommend the selection of parents with a negative GCA. Thus, the maternal parents TBIO Aton, TBIO Ponteiro, and TBIO Sossego (Fig. 1A-B) contributed more to reduce the mean of severity scores of tan spot and WHB. When those parents participated in crosses as pollen-donor parents, there was a greater probability to give rise to superior-health populations. In contrast, the genotypes from Embrapa (BRS 254, BRS 264, and BRS 394) showed GCA effects with greater negative magnitudes (Fig. 1C), for an earlier maturation cycle. Casagrande et al. (2020) report similar results when studying the genetic diversity of 32 tropical wheat genotypes. The cultivars from Embrapa show earlier maturation when comparing to cultivars from Biotrigo seed company, in contrast, those with a long cycle showed greater health.
With respect to spike height and total grain weight (Fig. 1D), only the parents CD 1303 and TBIO Aton had the effects of paternal GCA and maternal GCA. It was negative for spike height; however, a height reduction is desired for these parents in order to avoid lodging, especially in irrigated areas of the Brazilian Cerrado (Richards et al., 2019). The result was also a positive GCA for total grain weight (Fig. 1E). GCA refers to the mean performance of the parent present in hybrid combinations. Thus, it is associated with genes with additive effects; in turn, SCA designates cases in which hybrid combinations are superior or inferior than expected based on the mean parents performance and their gene complementarity, since SCA depends on genes with dominant effects and on their interactions (Fasahat et al., 2016).
The estimation of parent's SCA effects is relevant because it becomes an indicator of the existence or not of unidirectional dominance. SCA values are negative when dominance deviations are predominantly positive; otherwise, they are positive (Cruz et al., 2014). The discrepancy in the SCA values of parents observed in the present study for the traits days to heading, spike height, and total grain weight, (that is, positive and negative values of SCA) points to the absence of unidirectional dominance for these traits. Therefore, dominant and recessive genes determine the traits.
The aim of breeding programs is based not only on the improvement of one trait but also the selection of progenies that present the combination of desirable traits. However, depending on the number of genes that control a trait, it becomes difficult to find a homozygous genotype that includes all genes for all selected traits. Thus, it is necessary to select segregating populations that have such desirable traits, such as populations that have desirable SCA effects for each trait and that bring together at least one of the parents with desirable GCA effects (Chagas et al., 2019).
In this sense, three combining populations have desirable SCA effects (Fig. 2) for most selected traits, namely, B1 (BRS 254 x CD 1303), D5 (BRS 394 x TBIO Aton), and E2 (TBIO Aton x BRS 254). B1 and D5 combine the traits WHB lower severity, days to heading, spike height, and total weight, while the F2 E2 population differs in relation to the first trait: it is resistant to tan spot. Another six F2 populations stand out for combining SCA effects for three other traits, as follow: A2 (CD 1303 x BRS 254), A4 (CD 1303 x BRS 394), A7 (CD 1303 x TBIO Ponteiro), F2 (TBIO Duque x BRS 254), F3 (TBIO Duque x BRS 264), and G1 (TBIO Ponteiro x CD 1303). Different previous studies report efficiency in the use of diallel analysis to select promising wheat populations (Sharifi et al, 2019), so it is worth recommending these populations.
Simultaneous selection
As a second criterion for selecting the most promising populations, the genotypic value (GV) shown in Table 4 in which the simultaneous selection methodology used is based on the method of Subandi et al. (1973). Adopting a selection pressure of 20%, 13 best populations were selected, the gain with selection was suitable for all traits: 6.84% for tan spot severity, -5.98% for WHB severity, 0.00% for days to heading, -1.37% for spike height, and 6.28% for total grain weight with a total gain of 20.57%.
TABLE 4 Estimates of original average (X 0 ) and average of selected populations (XS), selection differential (SD), selection gain (SG), and selection gain in % (SG%) in the simultaneous selection for 10 superior tropical wheat populations F2 for the traits: tan spot severity (%), wheat head blast-WHB severity (%), days to heading (d), spike height (cm), and total grain weight (g).
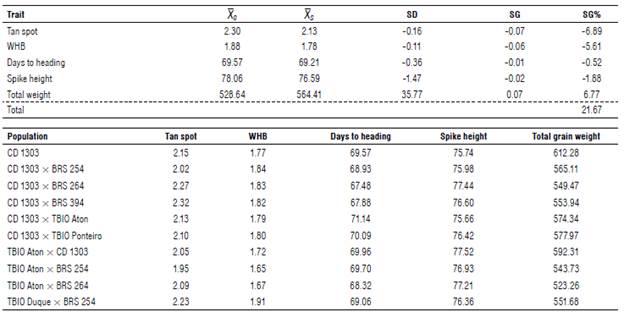
The average of the selected populations (XS) was 2.13 tan spot severity, 1.77 for blast severity, 76.988 cm for spike height, and 561.86 g for total weight. Considering the severity scales proposed by Lamari and Bernier (1989) (tan spot) and by Maciel et al. (2013) (WHB), these selected populations are considered resistant or moderately resistant. The average of the populations selected for heading, of69.573 d, is inferior to commercial cultivars CD 1303, BRS 254, BRS 264, BRS 394 and TBIO Duque that are considered early cycle (Tab. 1). The superior performance of these selected F2 populations, even in a state of segregation, demonstrates the potential for derivation of superior lines since there are of transgressive individuals.
When considering the simultaneous selection by Subandi et al. (1973) and the selection based on the values of GCA and SCA, the populations F2 A2 (CD 1303 x BRS 254), A4 (CD 1303 x BRS 394), A7 (CD 1303 x TBIO Ponteiro) and E2 (TBIO Aton x BRS 254) were selected on both ways.
These populations have desirable genetic values for all traits, i.e., values of tan spot and WHB severity, days to heading, and plant height below the general mean, and total grain weight above the mean of the populations. Therefore, the selection for the derivation of lines is promising.
Conclusions
The additive effect predominates in the genetic control of tan spot severity, blast severity, days to heading, and total grain weight. The effect resulting from dominance deviations predominates in the genetic control of the trait spike height. There are greater GCA effects for the set of maternal parents compared to GCA effects for the set of paternal parents. Populations derived from the parents TBIO Aton, TBIO Ponteiro and TBIO Sossego have a greater potential for obtaining superior lines with lower disease infection, while populations from the parents BRS 254, BRS 264, and BRS 394 have a greater potential for showing early maturation cycle lines. The most promising populations to derive lines for the set of traits evaluated are BRS 254 x CD 1303, BRS 394 x TBIO Aton, TBIO Aton x BRS 254, CD 1303 x BRS 254 and CD 1303 x BRS 264.

