


 Inglês (pdf)
 Artigo em XML
 Referências do artigo
 Enviar este artigo por email
 Citado por SciELO
  Citado por Google
  Similares em
SciELO
Similares em
SciELO  Similares em Google
 Permalink
Introduction
Coffee (Coffea arábica L.) is one of the most important tropical crops worldwide, with Colombia ranked third in production with 13,4 million bags of green beans (60 kg) and 884 thousand ha (Nab & Maslin, 2020; Ceballos-Sierra & Dall' Erba, 2021; FNC, 2021). The growth of coffee plants is a process regulated by interactions between genetics, physiological processes, and climatic conditions, with implications for agronomic management and crop success (Paine et al., 2012; Liu et al., 2018; Rakocevic & Matsunaga, 2018). Factors such as solar radiation, temperature, water availability in soil, and humidity in atmosphere are key climatic conditions that influence the growth and development of the plants (DaMatta, 2007; Bote & Vos, 2017; Jaramillo, 2018; León-Burgos et al., 2022). Growth patterns in each phenological stage could serve as an important tool for planning agronomic practices such as planting density, spatial arrangements, application of fertilizers and liming, controls of pests, diseases and weeds, and management of the crop pruning systems (Arcila, 2007; Rendón, 2020). This is necessary to ensure adequate growth and development of plants in the field and, thus, a high production potential.
Plants in the nursery constitute an early phase of growth in coffee crops that lasts from four to six months, with implications in the growth and development of plants in the field and production cycle (Arcila, 2007; Moraes et al., 2010, Castillo & Andrade, 2021). Shoot growth at this phase takes place in the meristematic zones located in the apical and lateral buds of the main stem (Arcila et al., 2002). The purpose of the coffee nursery stage is to select plants with appropriate growth characteristics, such as the number of leaves, height and leaf area, so that, when established in the field, they can adapt to the climate and soil conditions to avoid damages to their physiological performance that can cause plant death (Jaramillo, 2018; Castillo & Andrade, 2021). Furthermore, at the initial stages of projection in perennial crops life cycles, it is necessary to ensure good quality of the plant material from the point of view of crop health, so that, in the production cycle, it would express the highest production (Arcila, 2007; Gaitán et al., 2011). Therefore, the nursery stage of growth is a determining step for planning crop management and production projection in Colombian coffee cultivation (Rendón, 2020).
Growth curves are widely used in agriculture to simulate plant growth patterns as a function of time under particular climatic conditions (Poorter & Garnier, 1996; Paine et al., 2012; Liu et al., 2018; Bakhshandeh et al., 2020). Analyses have been developed with functions or mathematical models through linear or nonlinear regressions that are adjusted according to statistical criteria. These criteria define the degree of prediction of the changes and behavior in the magnitudes of growth, based on data measured in plants, called a functional approach (Kaufmann, 1981; Hunt et al., 2002; Liu et al., 2018). This technique is mainly used to evaluate the temporal variation of plant growth dynamics at phenological stages of interest, since only a few individuals are measured but with many replicates throughout the time, particularly during rapid changes in growth (Hunt, 1979; Paine et al., 2012). Therefore, these methods can be used to describe changes in the magnitude of growth and to define selection criteria that may ensure good quality and growth of the plants coming from nursery stage.
Currently the coffee variety "Cenicafé 1" makes up approximately 80% of the cultivable area for coffee in Colombia (FNC, 2021). There is little information on the growth patterns and selection criteria for classifying good growth performance of the plants during the nursery stage. In this research we considered the following objectives: i) evaluation of the fit of mathematical functions that could simulate the growth from a functional approach and ii) description of the growth patterns of coffee plants during the nursery stage under the climatic conditions of Chinchiná-Caldas, located in the central coffee zone of Colombia. Mathematical functions were studied to describe plant growth patterns as a function of time using five growth measures: total leaf area (cm2), number of leaves, stem height (cm), stem diameter (mm), and length of main root (cm). With the adjusted mathematical functions and growth patterns, it is possible to predict the growth magnitude and to define selection criteria for coffee plants under nursery conditions.
Materials and methods
Study area and growth conditions
The plant material was the coffee Cenicafé 1 variety, established on the Plan alto Farm of the National Coffee Research Center-Cenicafé (04°59'34.9'' N, 75°35'50.5'' W), located at km 4 of the old Manizales-Chinchiná road (Caldas, Colombia), at an altitude of 1,332 m a.s.l. This material is a variety made up by eight progenies, resistant to coffee rust (Hemileia vastatrix) and coffee berry disease (CBD) (Colletotrichum kahawae) (Maldonado & Ángel-Giraldo, 2020). During the study period between January and July, 2019, the nursery was established in the area with following average climatic conditions: temperature of 21.8°C (maximum: 28.5°C and minimum: 17.4°C), relative air humidity of 82%, with an accumulated rainfall of 1,419 mm and 782 h of sunlight (Meteorological Stations of the National Federation of Coffee Growers of Colombia, Agroclima, 2019).
The plants (chapolas, in Spanish) were transplanted from seed germinators 75 d after sowing the seeds; at the moment of transplant the plants were at the BBCH10 phenological stage, when the cotyledonary leaves were fully expanded. Subsequently, the plants were established in a nursery with a 50% shade net in 17 x 23 cm plastic bags (Arcila, 2007). The substrate consisted of a mixture of disinfected (solarized) soil with decomposed coffee pulp at a 3:1 ratio (v/v). For the fertilization of the plants, 2 g of diammonium phosphate (DAP, 18-46-0) were applied at two and four months after transplant according to the recommendations of Sadeghian (2014). Agronomic practices reported by Gaitán et al. (2011) as the regulation of excess shade, waterlogging avoidance, and applications of cyproconazole (0.7 cc L-1) were carried out to manage brown eye spot disease (Cercospora coffeicola Berkeley & Curtis); and destructive monthly samples were performed for the monitoring of the pest known as mealybug (Pseudococcidae).
Measurements and data collection
To evaluate the growth behavior of coffee plants during their nursery stage, 400 plants were established. At 30 d after transplanting (DAT), when the first pair of leaves was developed, 20 plants were randomly selected as a sampling unit. This selection was sampled every 15 d until 180 DAT. In each sampling, the following growth measurements were recorded: total leaf area (cm2), total number of leaves, stem height (cm), stem diameter (mm), and main root length (cm). The leaf area was determined by measuring the leaf blade length, and width on the central part of the leaf blade of each leaf using a ruler without including the petiole. The data were then incorporated into Equation 1, proposed by Unigarro-Muñoz et al. (2015):

where LAE is the estimate of the leaf area in cm2, L is leaf length in cm, and W is leaf width in cm.
The total number of leaves was determined with direct counts on the plants; height was measured from the base to the apex of the stem with a ruler; and the diameter was measured with a Vernier digital caliper (500-196-30B, Mitutoyo, Brazil) from the basal part of the stem. For the length of the main root, destructive sampling was done, measuring length from the base to the apex of this organ.
For each growth measurement, the absolute growth rate (
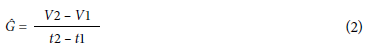
where
Data analysis
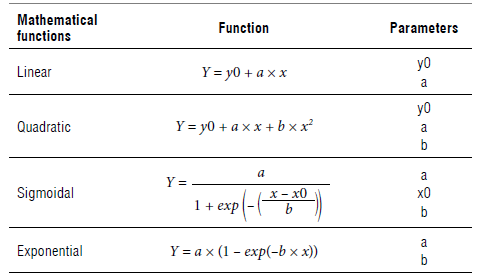
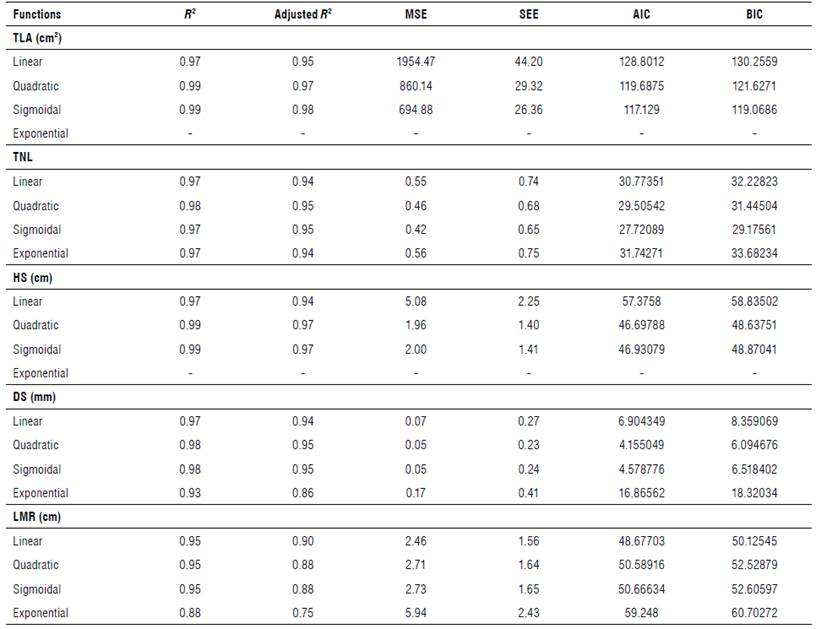
To describe the behavior of growth measurements over time, four mathematical functions, described in Table 1, were evaluated using linear and nonlinear regressions. For the adjustment and selection of each mathematical function, the following statistical criteria were used: coefficient of determination R2, widely used for the adjustment of models or functions; adjusted coefficient of determination - adj R 2 , a criterion with greater precision adjusted according to the degrees of freedom. The mean square error (MSE), a criterion that measures the degree of error that a model or function can simulate. The standard error of the estimates (SEE) that refers to the normal deviation of the residuals. Finally, the Akaike (AIC) and Bayesian-Schwarz (BIC) information criteria, measuring the accuracy and complexity of the model as well as the relationship between its bias and variance and the significance of the parameters of each equation according to the t-student test at 5% significance (Torres et al., 2012; Voorend et al.,2014; Liu et al., 2018). Subsequently, the relationship between the observed values for each growth measure and the estimated values for each adjusted and selected mathematical function was determined with a simple linear regression analysis to verify that the regression coefficient was statistically equal according to the 1% t-test.
All analyses were performed with the software R, version 3.6.0 with statistical package stats and nls2 (R Development Core Team, 2019; Grothendieck, 2022).
Results and discussion
Fitting of growth curves of coffee plants
In general, average values of 496.13 cm2 ± 3.64 (mean ± standard error (SE)) for total leaf area (TLA), 12.0 ± 0.40 for total number of leaves (TNL), 30.01 cm ± 1.30 for stem height (HS), 4.91 ± 0.26 mm for stem diameter (DS) and 29.09 ± 0.83 cm for length of the main root (LMR) were recorded in the coffee plants at 180 DAT, considered a suitable age for establishment in field conditions. The linear, quadratic, sigmoidal, and exponential functions used to simulate the growth patterns of the coffee plants during the nursery stage varied in the behavior of the growth measurements. The TLA, TNL and HS were fitted to a sigmoidal growth, and for the DS and LMR, a linear type was used (Fig. 1). Similar trends in the growth of coffee plants during this stage have been reported by Silveira et al. (2014) and Encalada et al. (2016). The opposite occurred in studies by Neiva et al. (2019) and Castillo and Andrade (2021) that describe quadratic behaviors in the growth of coffee plants during the nursery stage with contrasting results given the particular climatic conditions of the study areas.
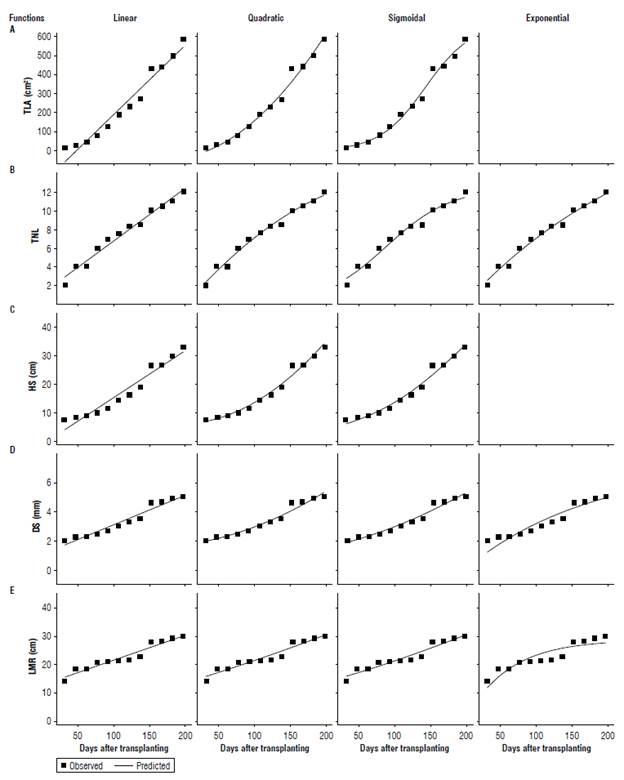
FIGURE 1 Growth curves of coffee seedlings at the nursery stage for each studied mathematical function. A) total leaf area (TLA), B) total number of leaves (TNL), C) height of the stem (HS), D) diameter of the stem (DS), E) length of the main root (LMR). Each point represents the mean (n=20).
Sigmoidal growth for the total leaf area, total leaf number and height described a growth pattern where the size of these variables increased along with the speed (Hunt, 1979; Kaufmann, 1981). However, the behavior of these growth variables was divided into two phases, a slow phase that started from 0 to 60 DAT, with average values between 19.91 to 49.13 cm2 for TLA, 3 to 4 leaves and 6.21 until 8.95 cm for HS, and an accelerated phase (75 to 180 DAT) with values of 75.61 to 520.00 cm2 for TLA, 6 until 12 leaves and between 10.68 to 30.16 cm for HS. DS and LMR increase lineal according to DAT. Average values of 3.23 mm for DS and 22.23 cm for LMR were reported throughout the study (Fig. 1).
Once the mathematical functions were defined for each growth variable evaluated in the coffee plants, the significance of each parameter estimated by the functions was compared. In general, all parameters of the functions for TLA (sigmoidal), TNL (sigmoidal), HS (sigmoidal), DS (linear), and LMR (linear) showed significant differences (P<0.05) from the other mathematical functions. Therefore, the selected functions were representative of each growth measurement evaluated in this study (Tab. 2).
The statistical criteria selected to evaluate the adjustment and selection of the mathematical functions have been used to simulate, adjust, and predict plant growth (Torres et al., 2012; Voorend et al., 2014; Liu et al., 2018). To interpret the selection of each function, the adjustment criteria (R2 and Readjusted) must be close to 1; and the selection criteria MSE, SEE, AIC and BIC must be the lowest values recorded by each function or model (Torres et al., 2012; Liu et al., 2018). The sigmoidal function of the TLA registered adjustment values with R2 0.99 and R2-adjusted 0.98, along with the selection criteria MSE (694.88), SEE (26.36), AIC (117.12), and BIC (119.06). These were lower than values recorded in the linear and quadratic function, except for the exponential one, where it was not possible to adjust the total leaf area data because of the non-convergence of the function (Tab. 3). Therefore, this adjustment can simulate the growth of TLA in coffee plants during the nursery stage, this same adjustment mathematical function with R2 values between 0.96 and 0.99 has been reported by Schmildt et al. (2014) and Unigarro-Muñoz et al. (2015).
The sigmoidal function of TNL and HS were selected and adjusted to represent the most appropriate values both fit (R2 = 0.97) and selection (MSE= 0.42, SEE= 0.65) to describe the behavior of these growth measurements according to DAT. This growth pattern both TNL and HS in coffee plants were reported by the Arcila and Chaves (1995) and Silveira et al. (2014). For the HS measurement, it is not possible to adjust the exponential function because of the non-convergence of this function with the data measured in the plants (Tab. 3). The opposite occurred for the DS (R2= 0.97, MSE= 0.07, and SEE= 0.27) and LMR (R2= 0.95, MSE= 2.46, and SEE= 1.56). The values of the statistical criteria evaluated were adjusted to the linear function. However, for the HS and DS, the values of both the adjustment and selection criteria were similar to the quadratic function (Tab. 3). However, the adjustment of the function was made based on the significance of the parameters of the functions (Tab. 2). The results of the growth behavior of the DS measurements were similar to those reported by Criollo et al. (2019) in coffee plants grown in the municipality of La Unión (Nariño, Colombia) as well as in the study by Souza et al. (2016). Similar descriptions were also recorded in the growth of LMR in coffee plants (Silveira et al., 2014).
TABLE 2 Estimates of parameters for the fitted mathematical functions of the coffee plant growth.
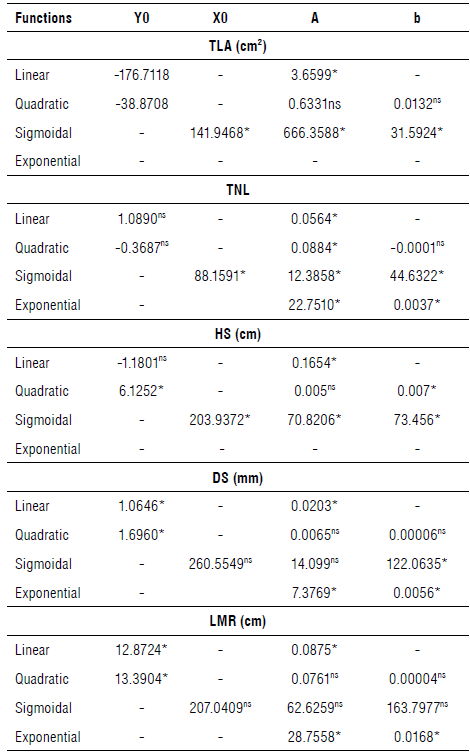
* Significance according to t-student test (P<0.05). ns No significance.
TLA: total leaf area; TNL: total number of leaves; HS: height of the stem; DS: diameter of the stem; LMR: Length of the main root.
The results of the fitted growth curves reported in this study may be used to hold the recommendations of the agronomic management of the coffee plants during the nursery stage of growth. These particularly include the fertilization, pest, disease, and weed controls focused during the 60 DAT to guarantee suitable conditions before the start of accelerated growth, where the growth of coffee plants are increased (Rendón, 2020; Sadeghian & Ospina-Penagos, 2021).
Description of the growth of coffee plants at nursery stage
The growth curves simulated with the adjusted mathematical functions correctly described the growth behavior of coffee plants under nursery conditions. In this way, a coffee plant at the 180 DAT, according to the adjusted functions, registered average values of 520 cm2 for TLA, 11.0 for TNL, 30.23 cm for HS, 4.87 mm for DS, and LMR of 28.80 cm. These results of growth variables as TLA (240 to 438 cm2), TNL (10 leaves) and HS (14 until 21 cm) have been reported for C. arabica cvs. Caturra and Castillo Tambo plants during the nursery stage that were established with 50% shading net under climate conditions from Cuba and Colombia (Encalada et al., 2016; Castillo and Andrade, 2021). In this way, the growth variables evaluated were confirmed as adequate criteria for the selection of plant material with good growth performance for establishment under field conditions. They were associated with physiological processes, such as water and nutrient uptake and carbon metabolism in the plants. However, the dry mass also was a measure that allows us to understand the growth of the plants under particular climate conditions (Tatagiba et al, 2010; Rodríguez-López et al, 2014; Maradiaga et al, 2017).
The regression coefficient was significantly different from zero, based on the 1% t-test, obtaining R 2 values between 0.91 to 0.98 (Fig. 2). These results showed that the functions do not overestimate or underestimate the estimated data for each growth measurement evaluated in this study (Unigarro-Muñoz et al, 2015). Therefore, the TLA, TNL, HS, DS, and LMR of coffee plants under the climatic conditions of this study can be simulated and predicted with these functions.
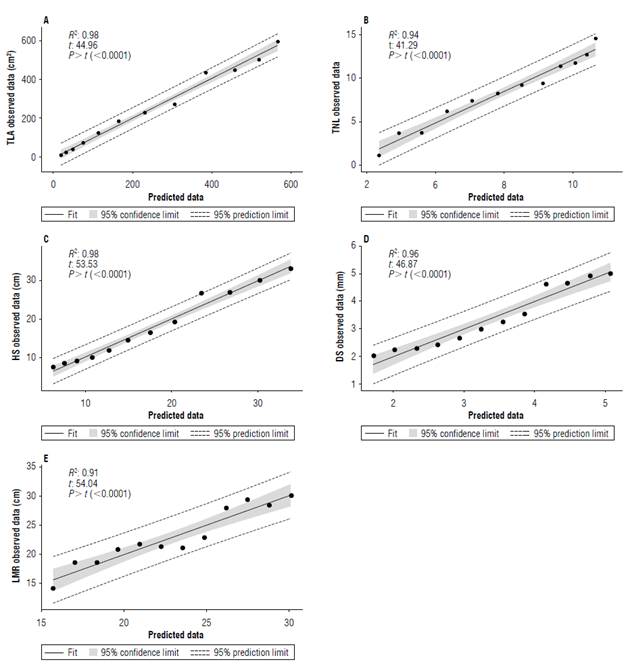
FIGURE 2 Relationships between data predicted by each fitted mathematical function and observed data for growth measurements of coffee plants. A) total leaf area (TLA), B) total number of leaves (TNL), C) height of the stem (HS), D) diameter of the stem (DS), and E) length of the main root (LMR).
The average absolute growth rate G, used to analyze the growth of coffee plants is shown in Figure 3 for each growth measurement evaluated in this study. The average absolute growth rate of total leaf area (
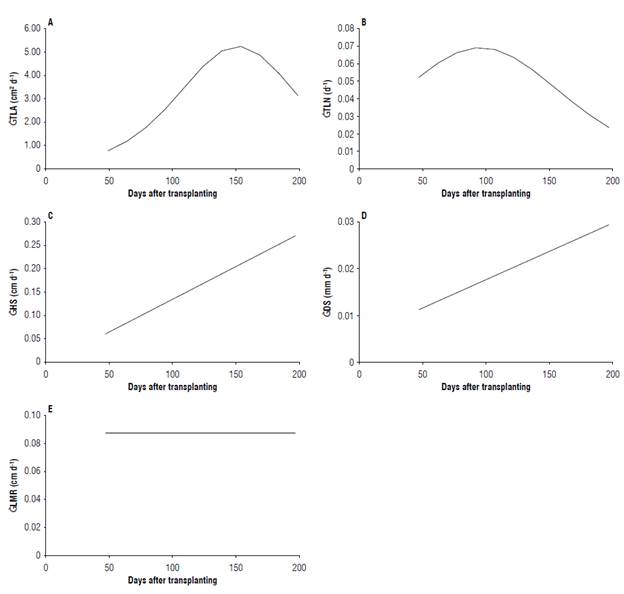
FIGURE 3 Mean absolute growth rate (
Conclusions
In general, the fitted sigmoidal growth curves for TLA, TNL and HS, and linear for the DS and LMR reported in this study, adequately describe the growth of coffee plants of the variety Cenicafé 1 in the nursery stage. The statistical criteria guaranteed a highest degree of fit and selection of each mathematical functions for simulating the growth measures evaluated in the coffee plants. Finally, the estimate of the growth parameters reported at 180 DAT with mathematical functions may be selection criteria to ensure adequate plant material for establishment under field conditions.

