


 Inglês (pdf)
 Artigo em XML
 Referências do artigo
 Enviar este artigo por email
 Citado por SciELO
  Citado por Google
  Similares em
SciELO
Similares em
SciELO  Similares em Google
 Permalink
Introduction
The banana crop is vulnerable to various factors that can affect plant development and therefore yield, so it is necessary to monitor the productive status of the plantation by monitoring its yield indicators (Turner et al., 2007). Parker (2020) asserts that the photosynthetic capacity of plants can be estimated from the potential of the canopy to intercept light and fix carbon which, in turn, is associated with the productivity of the crop, using as reference the number of photosynthetically active leaves that develop before the emergence of the inflorescence.
Plant allometry allows the generation of one-dimensional (height) or two-dimensional (cross-sectional area) measurements that can be used to estimate some yield attributes. In general, non-destructive methods have been devised that use indirect measurements generated from mathematical or statistical models whose predictions are used as productivity indicators (Karaca et al., 2020). In various allometric studies, models have been developed to estimate growth for blueberries (Vaccinium corymbo-sum), passion fruit (Passiflora edulis), pineapple (Ananas comosus), and papaya (Carica papaya) among other crops (Jorquera-Fontena et al., 2017; Souto et al., 2017; Santos et al., 2018; Oliveira et al., 2019).
In the Musaceae, based on growth indicators such as root characteristics, height of the mother plant or successional plant, pseudostem circumference, number of functional leaves (photosynthetically active leaves) and leaf area (LA), it is possible to estimate photosynthetic capacity, accumulation of biomass, efficiency in water use as well as variables associated with production and agronomic characteristics in germplasm selection programs (Nyombi et al., 2009; Martínez et al., 2015; Chang et al., 2018; Laskar et al., 2020; Stevens et al., 2020; Nowembabazi et al., 2021).
Dépigny et al. (2015) propose the OTO model for leaf area estimation in different varieties, including the number of functional leaves, length and width of the 1st, 3rd, and the last leaf to emerge. The model can be used on any accession of banana, regardless of its variety, stage of development, or growth conditions. Although the model is robust, it is limited to measurements of the leaves of the upper third of the plant, considering the characteristics of height and structure of the plant. But Martínez-Acosta et al. (2018) present a model to estimate the same previous variable from the measurement of the cross-sectional area of the pseudostem, avoiding in situ measurements of the leaves. Empirical models must be developed that facilitate the estimation of variables of a plant organ of interest, which can be obtained from easy measurements of another organ. Considering the above, this research proposes to build a model to estimate the leaf area from measurements of the pseudostem cross-sectional areas (PCSA) and calculation of the current LA, and, thus, identify the moment when meristematic differentiation occurs.
Materials and methods
The research was carried at the farm of the Banana Research Center-CENIBANANO in Carepa (7°46'22" N; 76°40'00" W, 40 m a.s.l.), Urabá (Colombia), where the annual averages of temperature, relative air humidity, rainfall, and sunshine are 28°C, 87.5%, 2650 mm, and 1700 h yr-1, respectively. Sampling and processing of the samples was carried out between the calendar weeks 25 to 45 of 2018, a period with sufficient water availability to plants. Thirty-four banana (Musa AAA subgroup Cavendish cv. Williams) plants were randomly selected between F10 and flowering in the phenological growth stages 4050 and 6000 according to the BBCH scale (Meier, 2001). The samples were selected of plot with 1800 plants ha-1; for each sampled plant, the number of leaves emitted was calculated, based on the remains of the leaf sheaths present in the pseudostem that were intrinsically associated with unequally spaced times (temporary event). Following the phyllotaxy of the plant, the total number of leaves present was counted, taking the 1st leaf as the youngest completely expanded leaf until the last functional leaf called the "oldest leaf". Finally, an empirical categorization of the phenological phase of the plant, vegetative or reproductive, was proposed based on the number of visible leaves and the morphological difference at the base of the leaf blade of the leaves present. This was used as the reference classification (Borja Agamez et al., 2018).
Leaf area estimation
All leaves present on each plant were cut off and numbered according to their position on the pseudostem. For each leaf, the length and width at the widest point of a leaf blade were determined. The total LA present was estimated with A) Belalcázar model (Belalcázar, 1991), B) Kumar model (Kumar et al., 2002) and C) calculation from the leaf dry mass LA(DM), where a 10 cm2 or 5 cm2 sample was taken from each leaf (depending on the size of the leaf blade), following the parameters described by Martín-Prevél (1974), the rest of the leaf was stored in paper bags. The sample and the rest of the leaf were dried in the CENIBANANO Laboratory at 65°C until reaching constant weight. Total leaf area was calculated using the ratio of mass to area in the leaf sample for the total number of leaves (assuming an even distribution of mass in the organ) (Equation 1).
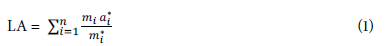
where LA = total leaf area, m1 = dry mass of the i-th complete leaf, m* i = dry mass of the sample from the i-th leaf, α* i = area of the sample from the i-th leaf, and n = number of leaves present.
Measurement of pseudostem cross-sectional area (PCSA)
For all plants, the circu mference o f the pseudo stem was measured every 10 cm from the base of thepseudostem as the initial point or relative zero to maximum height (MH), identified by the vertex formed by the last pair of functional leaves. Additionally, the circumference was measured from the base of the pseudostem at one-third (⅓) and one-half (½) of the MH. The height at which these last measurements were made was variable, considering that the plants were at different physiological ages, since the growth and elongation of the pseudostem is conditioned by the appearance of new leaves and the phenological stage.
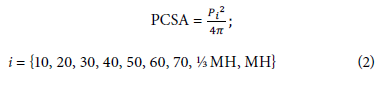
With these measurements, the PCSA was estimated at different heights (assuming a cylindrical shape with a circular base), between 10 and 70 cm, at ⅓ MH, at ½ MH, and MH (Equation 2), where P1 represents the i-th circumfe rence (cm) of the pse udostem corresponding to the i-th height. From the data collected, a data matrix of dimension 34x15 was built, Oor a total of 510 measurements.
Statistical analysis
Except for the initial categorization associated with the phenological phase, a standardized principal components analysis was applied to the matrix data from which a single component was extracted, since the explained variance of this component was a little over 96%. A variable associated with the PCSA and another with the LA(DM) leaf area estimation method were chosen, based n the generated biplot (and therefore the correlation betwe-en the first component and the original variables) (Gower & Hand, 1995).
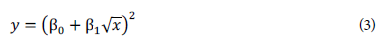
With this single pair of variables (PCSA at 50 cm height and LA (DM)), a seriesof linearandnonlinearmodels were explored, finding a nonlinear model estimated by nonlinear least squares as the best fit. Equation 3 shows the functional form, where y is the response variable associated with LA(DM), (β0 and β1 are the parameters of the model to be adjusted, and x is the cross-sectionalareaof the pseudostem.
With this model, leaf area predictions were generated which, compared only with the observed values, yielded a very good fit. The predictions were used as a response variable in the following analysis, in wh ich the nu mber of the emerged leaves (indirectly associated with a strictly continuous variable because it is the time of leaf emergence) was incorporated. At first, a scatter diagram wa s elaborated between the predictions and the number of visible leaves that predicted the possibility of applying a Fisher's linear discriminant analysis using the categorical variable associated with the initially proposed phenological phase as a classifier. This method was applied twice, first using the LA(DM) predictions and then the emitted leaves (which, as described above, is not a count, but an identifier of a temporal event). With these runs, the discriminant equations were generated to establish the cutoff point associated with the prediction of the LA(DM) and the new leaf by matching the respective discriminant equations, to find the useful common boundary as the cutoff point.
With the initial clas sificatio n o f the differentiation and with the generated partition as a cutoff point, the respective confounding matrices were obtained. However, an algorithm was built not only to have a measure of the correct classifications based on the partition up to leaf 11 at the time before differentiation and from lea f1 2at t he time after differentiation, but also to allow changing this partition at all possible values (from the second value taken from the emitted le af to the penulti mate) . The sequence of partitions was used as a classifier and each response separately as an explanatory variable. For the correct classifications, both independent models were proposed to classify the meristem differentiation as "pre" or "post" in each row of data. The algorithm mpximized the percentage of correct classifications, since the initial categorization of the phenological phase did not necessarily guarantee an optimum in the percentage of correct classifications . Finally, a diagram was developed for the optimization progress, which allowed the selection of the emitted leaf and the estimated LA that would guarantee the maximum discrimination of the phenological phase.
Results and discussion
The LA measurements between F10 and flowering were different with each method. While with the method of Kumar et al. (2002) LA varied from 0.07 m2 to 14.37 m2, with the Belalcazar method (Belalcazar, 1991) the values ranged between 0.17 m2 and 17.22 m2. The LA values calculated from LA(DM) were higher than the previous ones, varying between 0.21 m2 and 22.88 m2. Despite the differences in LA measurement with each method, the dynamics of development followed a similar pattern. A smaller leaf area was observed in the plants at F10 that could be associated with the juvenile development phase. Later a linear increase during the vegetative development phase that culminated with the floral differentiation of the apical meristem, followed by a more unstable increase in plants close to flowering, represented the dynamics of development described by Lassoudiere (2007), Martinez and Cayón (2012), and Dépigny et al. (2015).
An analysis of the standardized principal components between the measures of PCSA and LA estimated by the three methods yielded a single extracted component that explained more than 96% of the variability in the data, so their loads were extracted and correlated with the different measures of LA and the succession of PCSA. Based on the generated biplot and, therefore, on the correlation between the first component and the original variables, the highest coefficients associated with the PCSA and leaf area estimation method were selected. The LA(DM) method and the PCSA measurement at 50 cm (A50) were selected as the best predictor (Tab. 1).
TABLE 1 Estimated coefficients for the principal components.
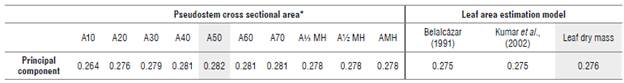
* Cross-sectional areas indicated in Equation 2.
With the selected variables, the dispersion diagram was constructed between the to the measurement of the PCSA at 50 cm (A50), and the LA(DM) values and a nonlinear model was fitted. The model's predictions, compared to other explored models, reached the best fit. For the selection of the best model, Akaike's information criterion, AIC=137.0691, was used.
The results of the nonlinear modeling process are presented in Figure 1, which shows that the pseudostem measurement is a convenient predictor of the LA(DM) as found by Stevens et al. (2020). Given that the calculation of the leaf area from the LA(DM) is a destructive methodology that demands time, effort, and resources, the indirect measurement of the LA is more convenient, because it approximates the originally estimated value without destroying the sample units as in Belalcázar (1991), Kumar et al. (2002) or even as in Dépigny et al. (2015). Although such methods adjust functional forms and result in a variable monitoring strategy, they can also show limitations due to data collection in the field, especially in plantations with tall plants, with the need to measure the 1st and the 3rd leaves. The use of PCSA can solve this difficulty in the field, in addition to being non-destructive.
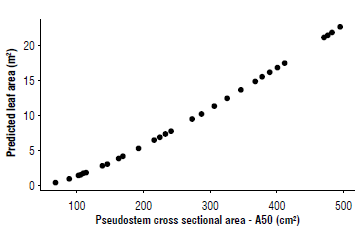
FIGURE 1 Non-linear modeling between the leaf area (LA) of banana plants cv. Williams and the pseudostem cross sectional area at 50 cm (A50).
Allometric relationships can potentially be affected by various abiotic and biotic factors, including genetics, ontogeny, size, age, organ structure, environment, soil moisture, andbiomass accumulation (Stevens et al., 2020). The results show a close statistical allometric relationship between PCSA and the LA, albeit these relationships are conditional and are restricted to the situation being experienced. Although mathematically or statistically the relationships seem sensational, they are not necessarily related to reality (Briggs, 2016). Chang et al. (2018) validate the results obtained in this research, since they also find that the measurement of the diameter of the pseudostem is an adequate predictor of other variables in the plant, especially the LA. Thus, the final expression of the nonlinear modeling process is presented in Equation 4:
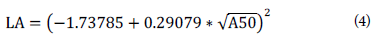
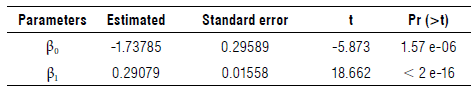
where LA corresponds to the measurement of the leaf area, allowing us to estimate the development of the plant based on the leaves that have emerged, and A50 to the measurement of the PCSA at 50 cm. Table 2 shows the estimation and testing of the parameters of the nonlinear model.
Further analysis of the data revealed the approximate identification of the moment when the apical meristem changes from vegetative to reproductive condition, which depends on leaf emergence and LA. Figure 2 shows the dispersion diagram of the LA(DM) estimated by means of the nonlinear model and the emitted leaf, marking the data with the initial classification given the differentiation of the apical meristem. The graph shows the possibility of separating the points using some method that discriminates the variables.
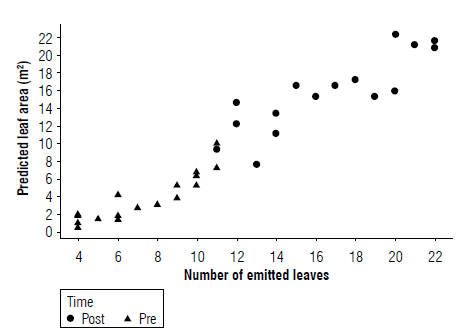
FIGURE 2 Fisher's discriminant analysis using the categorical variable associated with the phenological phase as a classifier. "Pre" corresponds before differentiation and "Post" after differentiation.
Since the number of lines that can make the separation is so large, Fisher's linear discriminant analysis was proposed to obtain the models that allow the separation and thus obtain an optimal cutoff point relative to the method used. Two discriminant functions were generated for each response (leaves emitted and estimated leaf area) and the cutoff point was estimated by these equations. The functions for LA and indirect time (t), seen from the number of leaves emitted (Equation 5), classify functions to match the first and second stage (variable = LA prediction and variable = time)
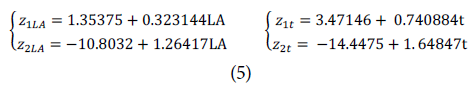
where z 1 and z 2 represent the ordinates of the functions for the label "1" before differentiation and "2" after differentiation for each input variable (LA and t). Equating z x with z 2 in each case, the cutoff point was obtained (placing a subscript c to associate it with the cutoff point in each input variable) (Tab. 3).
TABLE 3 Approximate parameters of the number of leaves emitted (fc) and leaf area developed [LA C ) in banana plants, at the time of differentiation of the apical meristem.
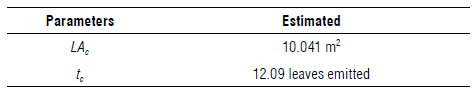
In this way, when the plant reaches an LA of 10.041 m2 and has emerged up to leaf 12 (by rounding), it can be said that this is when the apical meristem changes a vegetative stage to a reproductive stage. Therefore, when the LA is less than 10.041 m2, the plant is in the vegetative stage, which is indirectly identifiable before the appearance of leaf 12, corroborating what was proposed by Lassoudiere (2007) and Borja Agamez et al. (2018). In Figure 2, the coordinate, identified by the red dot, guarantees optimal discrimination by the method used.
The model with which the leaf area can be predicted from the PCSA and the cutoff point proposed constitute a valuable tool and information for technicians and researchers to monitor crop development of the and plan strategies that lead to improved productivity. However, as is often the case in many methods of classification and recognizing that the initial categorization was merely empirical, we proposed to fit an algorithm that would not use leaf 12 as the point of partition but would instead use different initial partition points. The comparison to obtain the percentage of correct classifications changes the initial partition, leaves the cutoff point obtained by linear discriminant, and calculates the percentage of correct classifications for all the initial or reference cut points.
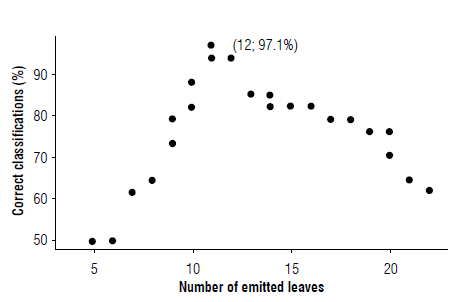
Figure 3 shows the progress of the algorithm illustrating leaf emission; in leaf 12, a percentage of correct classification of 97.1% is generated, an indicator of emitted leaf previously obtained by the discriminant analysis (Tab. 2). Thus, the period from the emission of leaf 12 onwards can be considered as the approximate time of inflorescence meristem differentiation. The recording of the chronological time of appearance of leaf 12 is a midpoint that can serve as a reference in different scenarios such as the implementation of differential nutrition strategies based on phenology, for example: the contribution of minor elements or hormones before or during the process of differentiation of the apical meristem. Also, in the selection of mother plants to be eliminated, hoping that the bunch to be harvested comes from the sucker, at a time or time of year with particular characteristics such as better market conditions, this practice is known as crop transfer.
Conclusions
The leaf area of the banana plants was successfully estimated based on measurements of the cross-sectional area of the pseudostem using an allometric approach. The availability of a tool to measure banana plant development, based on the estimation of leaf area prior to the inflorescence emission and during the crop cycle, constitutes a bioindicator that can be associated with production parameters and global yield estimation. It is also a practical input for researchers and technicians linked to the banana production sector to monitor plantations, facilitating the implementation of differential production approaches and support for decision making in agronomic management in the field.
Although the model proved to be reliable for estimating leaf area in banana cv. Williams, it should be validated for application to other Cavendish cultivars. Further studies should be carried out in Musaceae to establish allometric equations to relate other plant development traits with easily obtainable non-destructive measurements.

