


 Inglés (pdf)
 Articulo en XML
 Referencias del artículo
 Enviar articulo por email
 Citado por SciELO
  Citado por Google
  Similares en
SciELO
Similares en
SciELO  Similares en Google
 Permalink
Introduction
Plants are the main source of food for humans and animals worldwide (Ratnadass et al., 2012; Barbedo, 2013). However, during cultivation, they are affected by different types of diseases that reduce production and quality and, therefore, decrease their economic value (Dordas, 2008; Martinelli et al., 2015). Plant infections in the agricultural and food sectors have been reported to account for more than 30% of total production losses in most developing countries (Rizzo et al., 2021). Losses can be reduced or eradicated through early detection, monitoring and management of diseases (Zhang et al., 2019). To date, studies have reported that there are more than 50,000 plant diseases worldwide, parasitic and non-parasitic (Pimentel, 2011).
Plantains and bananas are fundamental in the diet of African and Latin American countries. In the world, only 15% of the total production is exported to non-producing regions and the remaining product is traded in national markets for local consumption (Varma & Bebber, 2019). For 2019, world banana exports, excluding cooking bananas, reached a maximum of 20.2 million t, with this product being fourth in consumption worldwide after wheat, rice, and corn (FAO, 2020).
The disease known as banana Fusarium wilt, or fusariosis, is a disease caused by Fusarium oxysporum f. sp. cubense race 1 (Foc R1), which has more recently been intensified by Foc tropical race 4 (Foc TR4) in Cavendish banana (Wang et al., 2020), recently classified as Fusarium odoratissimum by Maryani et al. (2018), who currently consider this the greatest threat to global production of Musaceae in general. It is a disease in which the pathogen invades, colonizes, and blocks the xylem vessels of the roots and interrupts the translocation of water and nutrients, causing severe wilting (Li et al., 2014). Its typical symptoms include yellowing and wilting of the leaves, vascular discoloration within the rhizome and pseudostem, and death of the infected plant (Ploetz, 2006). There is no known effective chemical control to treat this fungus, and, since it is a vascular pathogen, its detection and diagnosis are complex.
In recent decades, the development and application of various non-invasive techniques for plant disease detection that is sensitive, consistent, fast, and cost-effective have increased (Zhang et al., 2019). The most popular are: fluorescence spectroscopy, visible/near-infrared spectros-copy (VIS/NIR), fluorescence imaging, and hyperspectral imaging (Sankaran et al., 2010). Several studies have already been carried out regarding spectroscopy, especially with the use of VIS radiation in the detection of diseases in symptomatic plants (Mahlein et al., 2013, Abu-Khalaf & Salman, 2014; Szuvandzsiev et al., 2014, Thomas et al., 2018). Some of this research has focused on early detection of plant diseases (Marín et al., 2018) and detection of diseases that can "mask" symptoms (Abdulridha et al., 2019).
Knowing the location, extent, and severity of the appearance of diseases and pests is essential to guide phytosani-tary procedures. Conventional monitoring and diagnosis of diseases and pests in the field are laborious, subjective, and generally inefficient, while remote sensing techniquescan monitor plant diseases and pests on a large scale and early (Mahlein, 2016).
Vascular-type diseases, such as Fusarium wilt, are difficult to detect early. Other types of diseases, such as localized or superficial ones, can be detected with the observation of symptoms; however, for vascular-type diseases, visible symptoms indicate that the fungus or pathogenic organism has already invaded the vascular tissue (García-Bastidas et al., 2020). By observing interactions between the pathogen and hosts, a variety of symptoms and damage to plants can be identified, providing a basis for monitoring with remote sensing (Zhang et al., 2019). However, early detection requires the ability to identify those characteristics that make each infection unique, even in the absence of external symptoms. The behavior of healthy plants must be compared with that of diseased plants for successful diagnoses (Zhang et al., 2012).
An early detection system based on spectroscopy techniques can reduce losses in crops with more speed, sensitivity, and selectivity by avoiding propagation of diseases, avoiding the sowing of plants carrying the pathogen, and avoiding the need to destroy samples for analysis (Chaerle & Van der Straeten, 2000). The main objective of this research was to characterize the spectral response of healthy plants and plants infected with Foc R1 from two banana groups (one susceptible and one resistant) using reflectance spectroscopy during the incubation period of the infection.
Materials and methods
Plant material and location
Gros Michel (GM) and Williams (W) banana plants of in vitro origin were purchased from a commercial nursery. The study was carried out at the Universidad Nacional de Colombia, Medellin campus. Twenty ml of a general hydroponic solution formula were used every 8 d, containing (milli-equivalents): NO3 - (12.0), PO4 3- (1.0), K (1.7), Mg (1.5), Ca (2.8) and SO4 2- (0.5), and micro-equivalents of Fe (70.0), Mn (18.0), Zn (7.7), Cu (1.5), B (27.5), and Mo (0.5). The plants were planted in 2 kg nursery bags, with a 1:1 mixture (v/v) of peat (Mikskaar MKS1) and coconut fiber (commercial products) as substrate. The internal environmental conditions in the greenhouse during the experiment were: average temperature of 32°C and 80% relative air humidity.
Microorganisms
The Varonesa strain of Foc R1 was used, provided by the Centro de Investigaciones del Banano (CENIBANANO) and isolated from symptomatic pseudostems of Manzano banana (AAB) plants collected from the "Varonesa" commercial farm (7°63'23'' N, 76°36'20'' W) in Urabá, Colombia.
Plant inoculation
The Foc R1 Varonesa strain was multiplied in a Potato Dextrose Agar (PDA) culture medium. After 7 d of growth, its surface was washed with sterile, distilled water to obtain a suspension with a concentration of 1x10⁶ conidia/ml. For the infection, the methodology proposed by Jie et al. (2009) was used: when the plants reached the 1030 development stage according to the BBCH scale, a scalpel was used to make a cut at the base of the root of each plant, which was immediately inoculated with 15 ml of the conidia suspension.
Spectroscopy
Reflectance spectra were obtained with a USB2000+ portable spectroscope (Ocean Optics, Largo, FL) with an HL-2000-HP tungsten halogen light source (wavelength range 360-2400 nm), a model WS-1 diffuse reflectance standard (reflectivity > 98% in the 250-1,500 nm range), and a QR600-7-VID-125F 600 premium grade reflectance probe (Ocean Optics, Largo, FL, USA). The measurements were taken in a closed environment when the plants had five functional leaves with the optical fiber on the adaxial surface of the leaf, obtaining three spectra for each leaf. The integration time was 6 s, with an average of 5 readings per measurement and an "interval time" of 2000 µs.
The time range of the measurements corresponded to the incubation period of the disease, defined as that from inoculation to the development of the first symptoms.
Statistical analysis
A completely randomized design was used to compare two treatments: susceptible (GM) and resistant (W) plants, both inoculated with Foc R1 and uninoculated.
Reflectance measurements were taken every 2 d after infection. Four data sets with 140 spectra each (28 leaves per treatment) were collected for each sampling day (560 spectra/sampling day).
Spectra with noise, distortion or reading errors were eliminated. The selection for removal was confirmed with an analysis of outliers identified in a principal component analysis (PCA) without data pretreatment. The variant normal standard transformation (SNV) provided good grouping of the plants in the treatments according to the results of the tests.
After pretreatment, the data were analyzed with the RELIEF-type classification algorithm and with the wavelengths that had the greatest weight. A linear discriminant analysis (LDA) was performed for the classifications. All analyses were performed with the Software R-project® version 4.1.2 (De Mendiburu, 2022).
Results
Difference in the spectral response of healthy Williams and Gros Michel banana plants
The general behavior of the reflectance of both cultivars was similar in the Vis spectrum; however, the W had a lower reflectance in the NIR range. A detailed analysis showed that the spectral response of the leaves varied according to the stage of development. The first leaf, with an expanding leaf lamina (according to the BBCH 1000 scale), had a higher reflectance, around 25% in the Vis for both, with respect to the rest of the leaves. However, in the NIR, the values increased by 87% for W and 75% for GM. As the stage of the leaf development advanced to other positions (2nd, 3rd, and 4th leaves), the reflectance decreased throughout the entire spectral range, to values close to 12.5% in leaf 4 in both clones (Fig. 1A-B).
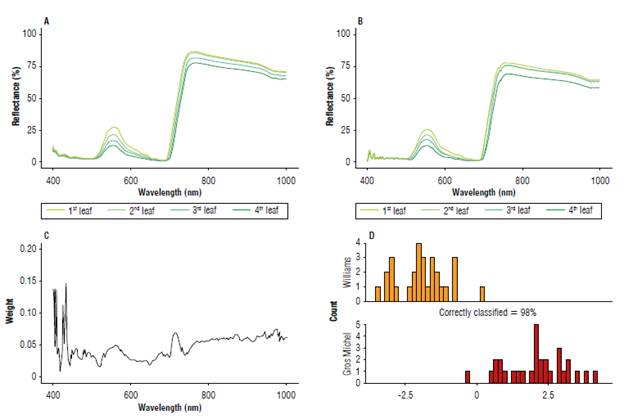
FIGURE 1 Spectral response with healthy Williams and Gros Michel banana plant leaves at 8 weeks of age. A) Reflectance spectra of the first four leaves measured in the Williams; B) Reflectance spectra of the first four leaves measured in the Gros Michel; C) Weights defined by the RELIEF type algorithm for all wavelengths in the measured range (400-1000 nm); D) Linear Discriminant Analysis using the evaluated plant as discrimination classes.
The RELIEF type classification algorithm defined a greater weight (0.10) for four reflectance regions. This algorithm "assumes" that these variables are strongly relevant if they easily distinguish between two observations of different classes, that is, between GM and W in this specific case (Fig. 1C). The wavelengths selected from the RELIEF-type algorithm in the discriminant analysis correctly classified 98% of the plants in the early plant development stages (Fig. 1D).
Spectral response of healthy plants and plants infected with Foc R1
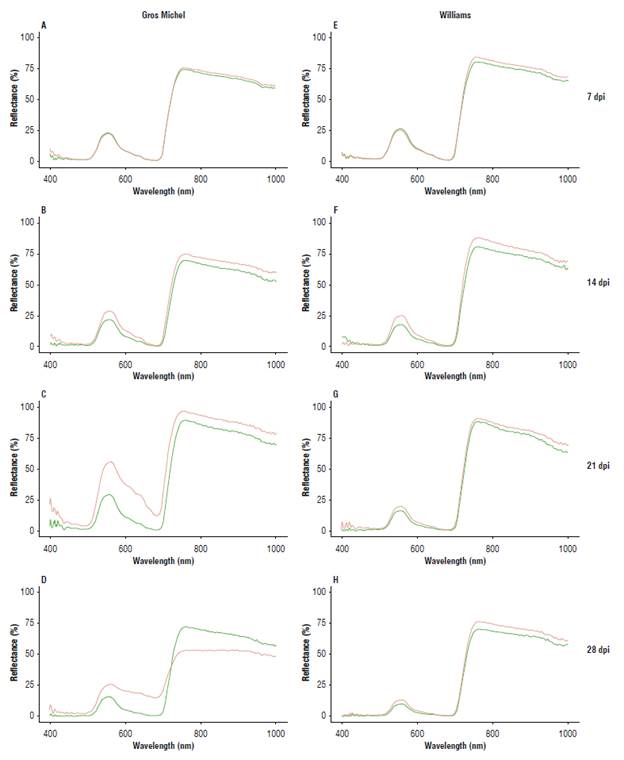
Figure 2 shows the spectral response of leaves from healthy banana plants and plants inoculated with Foc R1 from 7 d post-inoculation (dpi). No change was observed in the average reflectance spectra during the first week. In the GM (susceptible) plants inoculated with Foc R1, reflectance increased during the incubation period of the disease (Fig. 2A-C) in the entire range of the measured spectrum, exceeding 50% in the Vis range and 96% in the NIR range, as compared to the uninoculated plants. Once the symptoms of the disease became visible, i.e., after the incubation period was over, the reflectance rapidly decreased throughout the entire spectral range (Fig. 2D). For W (resistant), the spectral response of the leaves of healthy plants inoculated with Foc R1 did not show significant variation during the first 21 dpi (Fig. 2E-G); however, reflectance decreased throughout the range starting at the fourth week (Fig. 2).
Relationship between the spectral response and the intensity of vascular wilt symptoms in Gros Michel plants susceptible to Foc R1
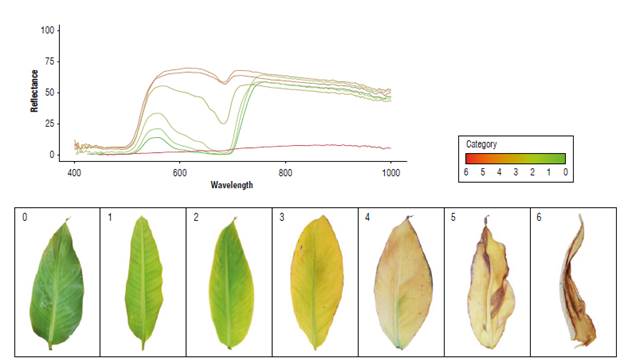
Table 1 shows the spectral response to Foc Rl of a group of leaves and its evolution in symptoms in GM banana plants. From the spectral point of view, three states were denoted in the Vis: a first, basal state (category 0), a second state of reflectance elevation resulting from the loss of photosynthetic pigments (categories 1, 2, 3 and 4), and a third state for a drop in reflectance to minimum values throughout the measured range (categories 5 and 6) (Fig. 3). Category 0 had a reflectance of 13% in the Vis, a basis for comparison of the evolution of subsequent responses, which corresponds to an uninoculated plant. After 10 dpi and until day 27, categories 1, 2 and 3 had a spectral response in the Vis that increased up to 70%. The leaves remained active but reflected most of the incident energy, which was observed until category 4. Once category 5 was reached, the reflectance had a value of 63% in the Vis, which rapidly decreased over 48 h, reaching 3% (category 6), indicating that the organ was not functional.
TABLE 1 Symptoms and spectral response of the Gros Michel plants susceptible to Foc R1 Infection.
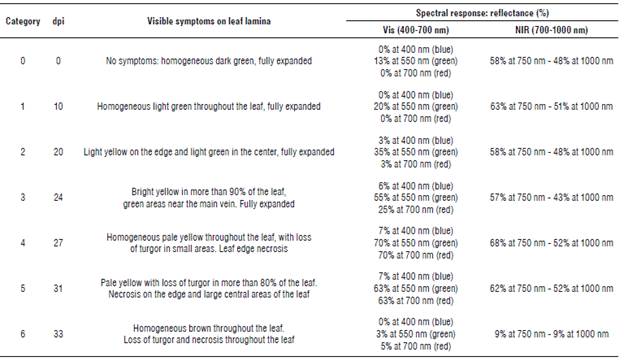
Reflectance percentages at each wavelength are approximate.
Reflectance differed in the NIR (700 to 1000 nm), with values oscillating between 57 and 68% in categories 0 to 3. Starting at category 4, it increased to 68% and then dropped to 9% in category 6.
The healthy susceptible plants (category 0) had reflectance percentages of 13% in the Vis and 58% in the NIR. This variable increased by up to 70% in the Vis and 68% in the NIR in category 4 leaves, where the leaf blade had yellowing. Then, in the final stage of the infection, a rapid deterioration of the leaves was observed, coinciding with a decrease in reflectance values to less than 10% in the entire spectral range (category 6) (Fig. 3).
Discussion
Differences in the spectral response in healthy plants of Williams (resistant) and Gros Michel (susceptible)
The reflectance graphs for the first four leaves of both cultivars are similar in the Vis spectrum, as reported by Sinha et al. (2020), who spectrally characterized 12 banana genotypes. However, reflectance varies as a function of many leaf properties, such as leaf shape and thickness, pigment content, nutrient status, age, moisture content, and phenological stage (Hatfield et al., 2008; Martínez & Solís, 2018). In this case, the curves of both cultivarshad low reflectivity in the Vis spectrum, as described by Mather and Koch (2011), who confirmed that vigorous vegetation has low reflectivity in the visible spectrum, with a relative maximum around 550 nm, because the reflectance of a wavelength in this range decreases with an increase in the content of chlorophyll in the leaf (Hatfield et al., 2008), indicating that the incident light is being used.
As the phenological stage of leaves progresses, there is a general decrease in the entire spectrum; in the Vis range this is due to the increase in the chlorophyll content to the maximum possible for a mature leaf (Dray et al., 2012; Castañeda et al., 2018), which decreases when senescence begins. Leaves in early stages of development may have a different spectral imprint than mature leaves because they have less cellulose and lignin in the cell wall than mature leaves (Durgante et al., 2013) and because the pigments and leaf blade are just reaching their full potential for development peaks (Durgante et al., 2013). Changes in the carotenoid content of leaves and their ratio to chlorophyll are widely used to diagnose the physiological state of plants during development, senescence, acclimatization, and adaptation to different environments and types of stress (Young & Britton, 1990; Demmig-Adams et al., 1996).
On the other hand, the spectral reflectance in the broad portion of Vis and NIR has been related to plant chlorophyll content, leaf health and water content, while the red edge band (NIR) has been related to photosynthesis and foliar nitrogen (Verrelst et al., 2015; Féret et al., 2017, Silva-Perez et al., 2018). In the NIR, healthy vegetation has high reflectivity, which gradually decreases towards the mid-infrared (Mather & Koch, 2011). In this case, although the two cultivars peaked in this range of the spectrum, the W reached higher reflectance in the NIR range (infrared spectrum, 700-1000 nm). Specifically, the spongy mesophyll has cavities that scatter most of the incident energy in the near-infrared band of the electromagnetic spectrum (Mather, 2004). For this reason, any healthy leaf will have high reflectivity in the near infrared but very low reflectivity in the visible spectrum (Chuvieco, 2008). A large difference was observed between the Vis bands (especially in the red light) and the near infrared. Some authors have studied the importance of this relationship, proposing as a general principle that the greater the contrast between these bands (red and near infrared), the greater the vigor of the observed plants (Chuvieco, 2008). Here, the leaves of the healthy plants of the two cultivars presented very similar curves in the measured spectral range, with differences in the infrared spectrum, possibly, because of subtle differences in the structure of their tissues and the water content they can store (Chuvieco, 2008).
The differential spectral response measured in the cultivars identified specific wavelengths that can be used for their classification. In recent decades, this technology has been used to discriminate closely related forest species, using discriminant analysis of spectral data, which confirmed the existence of spectral signatures in species, with a correct identification rate of over 96% (Durgante et al., 2013). Sohn et al. (2021) used Vis-NIR spectroscopy to discriminate Amaranthus sp. with an accuracy rate of up to 99.7%, recommending the use of this technology for species recognition even in juvenile stages. In addition, these authors suggested the use of Vis-NIR spectroscopy in combination with pre-processing, spectral libraries, and appropriate models for the identification and discrimination of varieties and plant species.
Spectral response of plants infected with Foc R1
Infection by F. oxysporum causes a series of physiological and morphological changes, both internally and externally (Pérez et al., 2014). Likewise, stress will manifest itself as a variation in the spectral response of healthy plants (Chuvieco, 2008).
In the GM plants, an increase in reflectance was initially observed throughout the spectrum. When a banana plant is infected by Foc R1, there are structural and biochemical changes that result in plant senescence (Dong et al., 2014). Plant wilting is generally attributed to vessel obstruction or systemic toxicity (Berestetskiy, 2008). The plugging theory has been proposed for the specific case of Foc R1 infections, which suggests that the vessels of infected plant become clogged with fungal hyphae, callose, tylose, and gel, which hinders water transport and, finally, causes a water deficit (Pivonia et al., 2002). When the water content in the leaves decreases, reflectivity increases, especially in the mid-infrared light, since there is no plant water to absorb energy (Chuvieco, 2008). Additionally, in the colonization process of plants, microorganisms can secrete phytotoxins capable of reducing the vital activity of plant cells. For example, there are toxins that have their site of action in the cytoplasmatic membrane, with the formation of transmembrane ion channels being the mechanism of action (Feigin et al., 1996). The formation of these channels causes alteration in the ion transport, the massive exit of electrolytes from the interior of the cells and, finally, death (Lavermicocca et al., 1997).
Likewise, when a plant is infected, chlorophyll degrades faster than carotenoids (Sanger, 1971). This effect generates an increase in the reflectance of the red-light wavelengths because of the reduction of absorbed chlorophyll. The loss of chlorophyll in a leaf produces greater reflectivity between the blue and red wavelengths (which is why the leaf turns yellow) because carotenes and xanthophylls, which absorb blue light and reflect green and red light, are dominant (Boyer et al., 1988). Finally, when a leaf is senescent, its internal cellular structure deteriorates, with lower reflectivity in the near infrared spectrum (Martínez & Solís, 2018). When leaves die, brown pigments (tannins) appear, and leaf reflectance and transmittance in the wavelength range between 400 nm and 750 nm decrease (Boyer et al., 1988). This behavior was observed in the leaves of the susceptible cultivar, where the accumulation of internal and external symptoms ended with senescence.
In the W leaves, a constant trend was observed for the reflectance throughout the spectrum during the study. However, although these plants are resistant, they were still subjected to inoculation stress, where the roots were injured, and Foc R1 structures were added. For this reason, a slight increase in the reflectance was noted in the infrared peak, which stabilized, resulting in a similar curve to that in the control plants. This can be attributed to a temporary accumulation of anthocyanins in response to inoculation; since these pigments serve as stress indicators for many plant species, their detection and quantitative evaluation provide information on the response and adaptation of plants to different types of stress (Chalker-Scott, 1999). In short, this group is stressed by the presence of the pathogen, being tolerant rather than resistant.
Relationship between the spectral response and the intensity of vascular wilt symptoms in Gros Michel plants susceptible to Foc R1
The data related the spectral response with the intensity of the symptoms of vascular wilt in Gros Michel. Pérez et al. (2014) proposed a scale of external and internal symptoms for banana plants in greenhouses, in which five important stages in the infection process are considered; the description of these stages was accompanied by photographs and a description of typical external and internal symptoms for each one. In the present study, a complementary scale was proposed with the description of the reflectance obtained between 400 and 1000 nm in banana plants infected by Foc R1 under greenhouse conditions. Although it is similar to that of Pérez et al. (2014), it offers greater detail for monitoring the progress of the disease. The spectral characterization, complementary to other diagnostic methods, facilitates the diagnosis and identification of diseased plants in early stages.
To conclude, it is necessary to identify discriminating wavelengths in the NIR since, in the initial stages, the appearance of symptoms is very subtle. Wavelengths must be specific to the phenomenon to differentiate between healthy and sick plants. Categories based on the intensity of the visible symptoms observed during the different stages of the infection are recommended.
Conclusions
A method for detecting and discriminating the spectral response of two varieties of banana plants was tested using reflectance spectroscopy in healthy plants and in Foc R1-infected plants. The results showed that Vis-NIR spectroscopy, in combination with appropriate pre-processing methods and multivariate data analysis, is an efficient tool for effectively classifying GM and W banana plants. Spectral fingerprints for the plants were elucidated in each variety for leaves in different stages of development. The differences in the Vis range of the spectrum were very evident.
The results suggested that the biochemical and biophysical changes generated in banana plants by Foc R1 infection can be detected and discriminated before visible symptoms appear using reflectance spectroscopy in the VIS/ NIR ranges. Specifically, Gros Michel plants (susceptible to Foc R1) infected by Foc R1 presented a spectrum that differentiated them from healthy plants of the same variety and from Williams plants in the asymptomatic period of the disease. The spectral characterization differentiated diseased plants, making it an objective tool for diagnosis of banana wilt and its identification in early stages. Additionally, it is possible to improve the precision and efficiency of this diagnostic method for plant diseases with a scale of symptoms based on the spectral response of leaves in each stage of pathogenesis development.

