


 Inglés (pdf)
 Articulo en XML
 Referencias del artículo
 Enviar articulo por email
 Citado por SciELO
  Citado por Google
  Similares en
SciELO
Similares en
SciELO  Similares en Google
 Permalink
Introduction
In recent years, interest in tropical fruits has increased in non-producing countries, leading to a growing market for these fruits. Global production of tropical fruits was estimated to be approximately 100.2 million t in 2018 with an annual increase of 4% from 2017 to 2018 (FAO, 2020). Tropical fruits comprise more than 2700 species and are an important source of economic growth, food security, and nutrition in rural production areas (Altendorf, 2017).
Import demand in developed countries for these fruits has evolved with migration, as consumers tend to maintain their food preferences. The volume of world trade in major tropical fruits in 2021 rose to a record of USD 10.5 billion in constant 2014-2016 dollar terms, marking an expansion of approximately 8% from 2020 (FAO, 2022). In addition, increased awareness among consumers about the health and nutritional benefits of tropical fruits is increasing the demand for diversity of minor fruit production in developed markets (Altendorf, 2018).
Lulo or naranjilla (Solanum quitoense Lam.) is a tropical fruit that belongs to the Solanaceae family. The main lulo varieties are septentrionale, produced mainly in Colombia, Panama, and Costa Rica, and quitoense produced in southern Colombia and Ecuador (Ramírez et al., 2021). "Lulo Castilla", "lulo de Castilla" or "Castilla variety" are appellatives used to refer to the native material used in the planting of lulo in Colombia. These denominations may correspond to different ecotypes propagated from seeds extracted by producers and, therefore, have no certification, given the existence of only one registered cultivar in Colombia, "La Selva" (Lobo Arias et al., 2007).
Lulo arouses great interest in the global market due to its sensory characteristics such as aroma, refreshing acidic flavor (Hinestroza-Córdoba et al., 2020) and the striking yellowish-green color of the juice. Lulo is a low-calorie fruit characterized by its high contents of potassium and vitamin C. The antioxidant compounds and other biofunctional compounds found in this fruit can help control hypertension (Forero et al., 2016).
Lulo fruits are round or oval, depending on the variety, and fruit weight (W) varies between 35 g (Bernal & Díaz, 2006) and 210 g (Ochoa-Vargas, 2016). Axial diameter (AD) is between 3 cm and 9 cm and longitudinal diameter (LD) is between 3 cm and 8 cm (Bernal & Diaz, 2006). In color, lightness (L*) varies between 37 (Acosta et al., 2009) and 61 (Forero et al., 2014), with color coordinate green-red (a*) between -10 and 52 (Mejía et al., 2012), color coordinate blue-yellow (b*) between 31 (Mejía et al., 2012) and 62 (Forero et al., 2014), chroma (C*) between 47 (Mejía et al., 2012) and 53 (Gancel et al., 2008), and hue (h) between 67 (Gancel et al., 2008) and 179 (Mejía et al., 2012). In biochemical characteristics, the pH of juice can vary between 2.4 and 3.5 (Morillo-Coronado et al., 2019), titratable acidity (TA) is between 2.6% (Acosta et al., 2009) with 4% citric acid (Forero et al., 2014, Ochoa-Vargas et al., 2016), and total soluble solid (TSS) contents is between 6.5 °Brix (Almanza-Merchán et al., 2016) and 13.6 °Brix (Jaime-Guerrero et al., 2022).
One of the key factors affecting the distribution of the lulo crops is the fluctuation in fruit quality and in the maturity stages, due to the ratio between soluble solids and organic acid content (Ochoa-Vargas et al., 2016). The ripening of lulo fruits is a complex process due to multiple factors, such as metabolic pathways associated with the development of color, flavor, texture, aroma, and nutritional value (minerals, vitamins, fibers, and antioxidants) (Ramírez et al., 2018). During the ripening, an increase of yellow-orange and loss of green color is observed (Andrade-Cuvi et al., 2015).
There are different ways of classifying "lulo de Castilla" by ripening stage, all of them visual. These are commonly used to set the optimal harvest date of the fruits for export, fresh consumption, or use as raw material for the food industry, etc. The Colombian Technical Standard (NTC 5093) establishes the requirements that "lulo de Castilla" must meet for its use and establishes a visual classification into six stages of ripening by color change: green fruit (color 0) to an orange fruit (color 5) (ICONTEC, 2002). Another type of classification uses the color percentage, from 100% green (1) to 100% orange (5) (Andrade-Cuvi et al., 2015).
These visual classification methods can hardly be considered objective for several reasons: environmental lighting conditions are not specified to perform the classification, the surface of green or orange areas specified by the classifications is subjective since no measurement method is established, and the perception of color will be influenced by interindividual differences in the subjects performing the classification. For these reasons, the present research aims to determine the main physicochemical characteristics of the lulo fruits. The authors hypothesized that it is possible to objectively classify lulo fruits according to their stages of maturity from external characteristics of the fruits that can be determined quantitatively.
Materials and methods
Fruit material
The fruits used in this study were "lulo de Castilla" (So-lanum quitoense Lam.), originally from Colombia and exported by the company Heaven's Fruits to Spain. The fruit was purchased from a local retailer in 2 kg lots, on different dates to ensure more representative sampling. The fruits were then taken to the laboratory of the Avances en Enología y Tecnología Alimentaria (Aenoltec) research group of the Universidad Pública de Navarra in Pamplona, Navarra (Spain), where the experiments were carried out. Eight different lots were purchased; and from each lot between five and seven fruits were randomly selected. A total of 52 fruits were chosen, of which 40 were used to establish the classification models, and the remaining 12 fruits were used to test the predictive power of the models.
Visual classification by stage of maturation
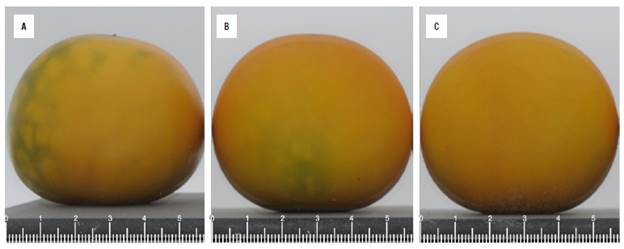
The lulo fruits were visually classified by ripening stage (Fig. 1) following the Colombian Technical Standard (NTC 5093): color 0, a dark green fruit, physiologically ripe; color 1, dark green fruit with light green shades; color 2, green fruit with some orange shades; color 3, orange fruit with green glimpses towards the center of the fruit; color 4, orange fruit with few green glimpses; and color 5, orange fruit (ICONTEC, 2002). To minimize the influence of the different factors (environmental conditions, operator) in the classification, four photographs (top, bottom, and two sides) of each fruit were taken under controlled conditions with DigiEye equipment (VeriVide Ltd.,United Kingdom) that uses a computer-controlled digital camera (Nikon) allowing high-quality repeatable images of both two and three-dimensional samples. The photographs were used to classify the fruits always under the same conditions.
External physical characteristics
The analyses detailed below were performed on the whole fruits. Weight (W) of the individual fruits was measured with the use of a balance (Cobos Jt-300c, Spain). LD and AD were measured with a digital micrometer (Mitutoyo Corp., Japan). The relationships between weight and dimensions (W/LD and W/AD) were calculated.
DigiEye equipment (VeriVide Ltd., United Kingdom) with standard illuminant D65 and using the CIELAB scale was used for color measurement. The measurement method described by Matusiak (2015) was followed. The equipment was calibrated first with a white folder (Model No Digital uniformity Card, Issue DEUCOO2) and subsequently with a color folder (Model No Digitizer Calibration Chart, version No 3.6). Calibration values were ΔE*<5 points, median <1 (usually 0.7); R, G, and B with values between 225 ± 5. Color coordinates L*, a*, b*,
C* =
Juice extraction
After external characterization, juice was extracted. For this purpose, the fruits were split in half, and juice, seeds and placenta were extracted manually. The juice was separated with the aid of a 710 sieve (Retsch, Germany).
Physicochemical analysis
The analyses detailed below were performed on the extracted juice.
The pH was measured by AOAC method 945.10 with a potentiometer equipped with a glass electrode (Crison GLP 22, series 530013, European Union) (AOAC, 2005a). TSS was determined by AOAC method 932.12 (AOAC, 2005b), with a refractometer (RX-700 CX, Japan). Data were expressed in °Brix. The determination of TA was made according to the procedure of the UNE 12147 standard. Results were expressed in g citric acid/100 ml of lulo juice (Asociación Española de Normalización (UNE), 1997). The maturity index (MI) was calculated as the TSS/TA ratio. All analyses were carried out in triplicate.
Statistical analysis
The first step of the statistical analysis was to perform a descriptive analysis of all the variables to determine outliers using box plots. After eliminating outliers that were out of range, a hierarchical agglomerative cluster analysis was performed with Euclidean distance, according to the Ward agglomeration method and truncation by several classes to define homogeneous groups of individuals according to the experimentally determined MI. Commonly, fruits for export are harvested at a medium ripening stage to avoid loss of weight and firmness during transit. Since we have been working with fruits for export, lulo are usually harvested as they belong to group Color 3 of the Colombian Technical Standard NTC 5093. So, it was only possible to have fruits of ripening groups 3, 4, and 5 according to the standard. Therefore, in this research, a truncation was performed in two and three groups (MI2 and MI3, respectively) since the analyzed fruits corresponded only to the three highest maturity groups defined by ICONTEC in the NTC 5093 standard.
To determine significant differences between the dependent variables (external physical and physicochemical characteristics of the lulo fruits) in the different ripening groups according to the Instituto Colombiano de Normas Técnicas y Certificación (ICONTEC) classification and the MI classifications obtained from the cluster analysis, an ANOVA was performed followed by Tukey's multiple comparison analysis with a significance level of 5% (P<0.05).
Subsequently, with the non-destructive parameters that showed significant differences between the groups by ripening stage, a partial least squares discriminant analysis (PLS-DA) was performed to try to establish functions to classify the fruits according to their ripening stage. The method was applied on centered and reduced values with a 95% confidence interval. The discriminant analysis was carried out for the new classifications established by the MI, using as predictive variables the non-destructive parameters with significant differences between groups by the ripening stage. The predictive analysis was performed with a new set of 12 fruits. All analyses were performed with XLSTAT 2021.2.1.1116 software (Addinsoft).
Results
The values obtained for the external measurements and physicochemical analysis were in the following ranges: W ((83.36-119.80 g), LD (49.27-58.83 mm), AD (55.10-64.13 mm), L* (47.32-58.37), color coordinate a* (12.29-34.69, red zone), color coordinate b* (54.91-80.15, yellow zone), C* (62.21-86.47), h (60.36-75.73), pH (2.84-3.23), TSS (6.3211.47 °Brix), and TA (1.99-4.07 g citric acid/100 ml).
The maximum reflectance percentages, whose values varied between 30.45 and 53.55%, were measured as 600 nm (R600).
With the parameters measured, the following indexes were calculated (the range of variation obtained is indicated in parentheses): W/LD (1.66-2.26 g mm-1), W/AD (1.49-1.93 g mm-1), MI (1.57-6.20 °Brix/(g citric acid/100 ml) and AUC (43.93-75.36%).
Table 1 contains the results of the cluster analysis performed for the groups of fruits by ripening stage using the MI as a variable.
TABLE 1 Results of the cluster analysis performed for the groupings of lulo fruits in two or three groups by maturity index (MI).
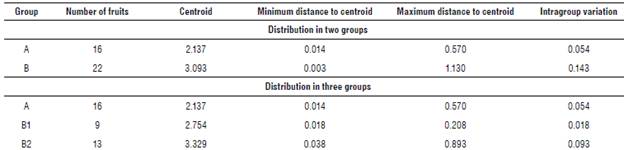
The grouping of the fruits into two clusters (A and B) provides two heterogeneous groups in which, according to the maximum distance to the centroid and intragroup variation (Tab. 1), there is greater variability among fruits in group B. In the grouping of three clusters (A, B1, and B2), there are three groups with greater homogeneity in terms of maximum distance to the centroid and intragroup variation.
When comparing the maturity groups of the new classifications (MI2 and MI3), group A had the same centroid (2.137) and distances (0.014 minimum and 0.570 maximum) in both classifications. This indicates that the same 16 lulo fruits were classified in the same class in both the second and third maturity groups. Group A in both classifications obtained the lowest MI compared to the other groups, and it corresponds to the group with the lowest fruit maturity. According to the centroid contents in the MI3 classification, the most mature lulo fruits belonged to group B2.
Table 2 summarized the results of the ANOVA analysis followed by Tukey's multiple comparisons test, performed to identify the parameters in which the groups in each of the classifications differed significantly (P<0.05).
TABLE 2 Mean values and standard error of physical and physicochemical characteristics of "lulo de Castilla" (Solanum quitoense Lam.) at different ripening stages according to the ICONTEC classification and maturity index (MI) classifications in two and three groups (MI2 and MI3).
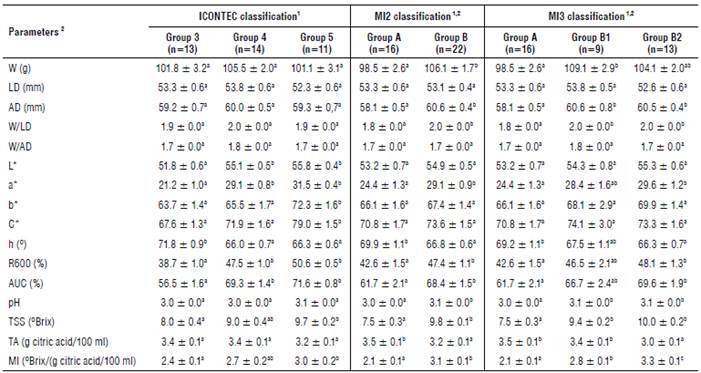
1 For each classification, values in the same row with different letters indicate statistically significant differences (P<0.05) according to Tukey's test.
2 W: weight; LD: longitudinal diameter; AD: axial diameter; W/LD: ratio weight/longitudinal diameter; W/LD: ratio weight/axial diameter; L*: lightness; a*: color coordinate green-red; b*: color coordinate blue-yellow; C*: chroma; h: hue; R600: percent reflectance at a wavelength at 600 nm; AUC: area under the curve of percent reflectance from 400 to 700 nm; TSS: total soluble solids; TA: titratable acidity; MI: maturity index; MI2: classification of 2 groups by maturity index; MI3: classification of 3 groups by maturity index; ICONTEC: Colombian Institute of Technical Standards and Certification; A and B: groups obtained from grouping the fruits in two clusters; A, B1, and B2: groups obtained from grouping the fruits in three clusters.
ICONTEC groups significantly differed (P<0.05) in color parameters (coordinates L*, a*, b* C*, h*, R600, and AUC), TSS content and MI. In the case of classification by MI, all variables except DL, L*, b*, C* and the W/AD index showed significant differences (P<0.05) between groups.
Discriminant analyses were performed with the PLS-DA method to establish the functions that best classify the ripening stages of the fruits, with the external parameters that have shown significant differences (P<0.05) between the groups established by MI (W, AD, W/LD, a*, and h coordinate, R600, AUC). The explanatory variables with the greatest influence on the model (W, AD, and W/LD) were selected and discriminant analyses were again performed using only these variables. The classification functions obtained are presented in Table 3.
TABLE 3 Classification functions and percentage of correctly classified fruits obtained by PLS-DA.
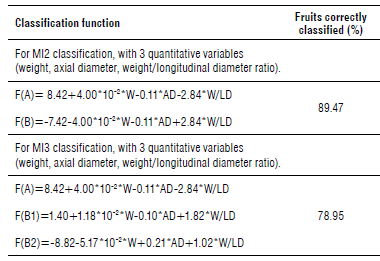
W: weight; AD: axial diameter; W/LD: weight/longitudinal diameter ratio.
The MI2 clustering correctly classified 89.47% of the lulo fruits, while the MI3 clustering correctly classified 78.95%.
The predictive power of the equations obtained was assessed with a new set of 12 fruits. When two ripening stage groups (MI2) were considered, 75% of the fruits were correctly classified, and when three groups (MI3) were considered, 33% were correctly classified. Figures 2 and 3 show the totality of the fruits (used to establish the classification models and to test the predictive power of the models) on the tl, t2 and tl, t3 axes generated in the PLS-DA analysis. They allowed visualizing the better discrimination in the case of two groups classified (MI2) by maturation stage.
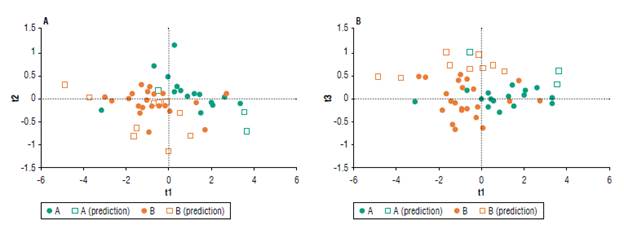
FIGURE 2 Classification with two groups (MI2) by maturation stage (A group=16 fruits and B group=22 fruits) and the classification of new fruits used to evaluate the prediction model (A group=3 fruits and B group=9 fruits). A) Observations on axes one and two; B) Observations on axes one and three.
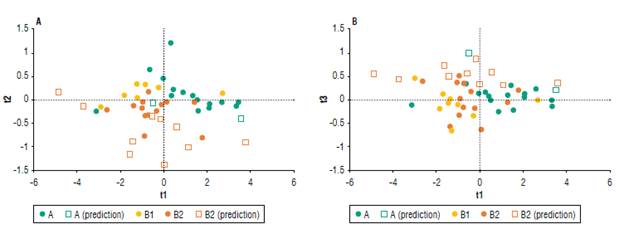
FIGURE 3 Classification with three groups (MI3) by maturation stage (A group=16 fruits, B1 group=9 fruits and B2 group=13 fruits) and the classification of new fruits used to evaluate the prediction model (A group=2 fruits and B2 group =10 fruits). A) Observations on axes one and two; B) Observations on axes one and three.
Discussion
The fruits used in this research were characterized by medium weight, low height, and medium-high width, a tendency to red and yellow, low tonality, medium C* coordinate, TSS in the medium range, and pH and TA in the medium-high range. When compared to other studies performed with "lulo de Castilla", the fruits used had a weight above average, low height and medium width (Bernal & Díaz, 2016).
Color was in a medium range in the green-red coordinate (a*): it was high in lightness, lower in h and higher in blue-yellow (b*) and C* coordinates (Mejía et al., 2012). TA and pH were in the medium-high range and TSS in medium range (Mejía et al., 2012; Molano-Díaz et al, 2022).
It is of great importance to obtain fruits with optimally mature characteristics for their use by consumers. To determine the optimum moment of maturity, there are different indexes; but, in the case of fruits, one of the most used indexes is the ratio between sugar and acid content, since this ratio gives many fruits their characteristic flavor and it is an easy indicator of commercial and organoleptic maturity (Angón-Galván et al., 2006).
MI (TSS/AT) increases during maturity, when organic acids decrease as they are used as substrates for respiratory processes and/or TSS increase (Andrade-Cuvi et al., 2015). The reduction of TA and/or TSS content can be used as a standard criterion to detect fruit ripening. The MI (TSS/ TA) is a good indicator of fruit maturity as it increases significantly during ripening (Ochoa-Vargas et al., 2016).
Considering that the ICONTEC classification is based on external changes in fruit color, it makes sense to distinguish significant differences between groups in the variables related to color (coordinates L*, a*, b* C*, h*, R600, and AUC); However, color is not enough to characterize the stage of the lulo fruit maturation (Mejia et al., 2012). In this research, no differences between ICONTEC classification groups were observed in parameters W, LD, AD, W/ LD, W/AD, TA. An overlapping of groups was observed in physicochemical characteristics such as pH, TSS, and MI. In particular, the MI does not allow differentiating group 4 from groups 3 and 5. These facts show the deficiencies of the classification by color, since the groups obtained by this method do not show a clear relationship with the distinct stages of maturation. The ICONTEC method of classifying lulo fruits by ripening stages lacks specific methodology (environmental lighting conditions not specified; percentage areas of green, yellow, or orange color not detailed) to aid an objective classification. This classification is only visual, and depends on the color perception of the person doing the grouping, influenced by interindividual differences (Emery & Webster, 2019; Jeong & Jeong, 2021). In addition, this includes the difficulty of classifying the lulo fruits in intermediate groups since the fruits had different green and orange tones.
As MI was the criterion used to establish the groups MI2 and MI3, both classifications were discriminated by MI.
For the rest of the parameters, even though in both classifications there were differences between the groups on the same parameters (W, AD, W/LD, a*, h, R600, AUC, pH, TSS, and TA), the classification into three groups did not discriminate well in the more mature groups (B1, B2), except for TA. When the lulo fruits get closer to full maturity the acids are utilized as substrates for respiratory processes and/or being transformed into sugars reflecting an increase in TSS (Ochoa-Vargas et al., 2016). These facts were better observed in the MI2 grouping. The more advanced the stage of ripening, the greater the weight of the fruits. Significant differences were found in the MI2 classification groups. On average, the values obtained for W were higher than those reported by Gancel et al. (2008) and lower than those of Ochoa-Vargas et al. (2016) and Jaime-Guerrero (2022). In other varieties of lulo, Forero et al. (2014) presented W data for the quitoense variety higher than for the "lulo de Castilla" used in this study. In other research (González Loaiza et al., 2014), W was not a determining parameter to differentiate the lulo fruits at different ripening stages since no significant differences (P<0.05) were found in the W of 100%, 50%, and 15% green lulo fruits.
No differences in LD were found between groups for any classification, while AD showed a significant increase between groups A and B (MI2). The data obtained for the dimensions were similar to those reported by Obregón-La Rosa et al. (2021). The W/AD value was within the ranges published by the Colombian Technical Standard (NTC 5093). During the maturation phase, the lulo fruits can increase in size (Jaime-Guerrero et al., 2022), acquiring a circular or oval shape (Obregón-La Rosa et al., 2021). In the current research, the lulo fruits grew more in width than in length, showing a more oval shape, thus, showing significant differences for AD while not for LD.
As for the color parameters, the L*, a*, b*, and C* coordinates showed the same tendency to increase values as the ripening stage advanced, explaining the greater presence of red and yellow colors in the ripest fruits, and the opposite for the h coordinate. For the MI2 and MI3 classification, no significant differences were found between the groups by ripening stage in L*, b* and c*, in contrast to the ICONTEC classification. During the ripening period of lulo fruits, changes in fruit hue occur with variations from green to yellow-orange due to chlorophyll degradation and synthesis of other pigments (Wills et al., 1998; Burbano Valdivieso & Daza, 2012) that are generally present in the fruit epidermis (Mejía et al., 2012). During the ripening period the different stages are best discriminated by hue and variation from green to red (a*) rather than blue to yellow (b*) chroma or fruit luminosity. The L* coordinate increased as fruit maturity advanced; however, the L* coordinate values showed a decrease in the group of higher maturity, with values lower than those obtained in this research (Mejía et al., 2012). The values of a* and b* were higher than those obtained by Gancel et al. (2008), similar to values for coordinate a*, and lower than values for coordinate b* as reported by Mejía et al. (2012). The increase in C* values responded to a greater vividness of color as the fruits ripened. The h-coordinate decreased significantly (P<0.05) with increasing fruit maturity stages. Mejía et al. (2012) and Gancel et al. (2008) report higher values in h and lower values in C* than those obtained in this research.
The highest percentage of reflectance in the visible spectrum was found at 600 nm, regardless of the ripening stage. These spectra can be related to the different compounds present in the fruits. For example, in apples, reflectance percentage between 425 and 480 nm was the maximum absorption point for carotenoids, 550 nm for anthocyanins, and between 550 nm and 705 nm reflectance for the chlorophyll content (Merzlyak et al., 2013). The AUC increased with the maturity stage.
In the physicochemical characterization, pH increased with increasing fruit maturity. In the MI3 clusters, there were no significant differences between B1 and B2 groups. The pH values were lower than those obtained by Mejía et al. (2012), Morillo-Coronado et al. (2019) and Duarte Alvarado et al. (2021) and higher than those by González Loaiza et al. (2014). Although the study by González Loaiza et al. (2014) reports an increase in pH with increasing maturity stage, Casierra-Posada et al. (2004) indicate that the pH value of lulo juice should not be taken as a parameter to determine fruit maturity because it is very similar and ranges from 2.9 to 3.2 from the 1st to the 7th d of harvest. TSS increased with ripening as is generally the case, regardless of the variety of lulo used (Casierra-Posada et al., 2004).
TA showed opposite behavior to pH and TSS: acidity decreased in the most mature lulo fruits. Both the studies of Casierra-Posada et al. (2004) and González Loaiza et al. (2014) report a decrease in acidity as fruits mature, similar to that obtained in this study. In the MI3 classification, TA showed significant differences (P<0.05) for group B2, but not in groups A and B1. According to the Colombian Technical Standard NTC 5093, the maximum TA content (expressed as citric acid) in lulo fruit juice, regardless of the fruit maturity stage, should be 3.23%; however, the values obtained were somewhat higher for lulo fruits belonging to groups A and B1. The reduction of TA as well as TSS content can be used as a standard criterion to detect fruit ripening. The MI (TSS/TA) is a good indicator of fruit maturity as it increases significantly during ripening (Ochoa-Vargas et al., 2016).
The ICONTEC classification is based on appearance parameters. Color variables are related to MI, because, during ripening color is one of the characteristics with the most significant transformations due to the degradation of green color (chlorophyll) that is associated with the synthesis of yellow (carotenoids) and red-purple (anthocyanins) pigments (Wills et al., 1998). However, the differences in various parameters between groups, especially pH, TA, TSS, and MI, show that the ICONTEC classification does not distinguish well between the different stages of maturity. Although the fruits used in this research belong to three groups (groups 3, 4, and 5 according to the Colombian Technical Standard NTC 5093), the results obtained do not justify their classification in three groups but in two.
In the MI3 classification, in general, the parameters (external physical and physicochemical) did not show clear significant differences between the three groups by maturity stage, added to the low percentage (33.33%) in prediction, questioning the need for a third group.
Mejía et al. (2012), who conducted a physicochemical characterization of lulo fruits of the Castilla variety at the 6 ripening stages established by the Colombian Technical Standard NTC 5093, already questioned the segmentation into 6 groups, concluding that by measuring color parameters, only three ripening stages are defined: green (corresponding to groups 0, 1 and 2 of the standard), pinton (corresponding to groups 3 and 4) and mature (5) that would support the hypothesis that only two ripening groups can be distinguished when working with color groups 3, 4 and 5 defined by ICONTEC.
In this research, when working with imported lulo fruits, the fruit sample was in a limited range of maturity grades, so it would be convenient to extend the study with a sample that includes sufficient fruit of all maturity stages.
Conclusions
Among the genetic diversity of lulo (varieties, hybrids, etc.), the fruits of the current research were of a medium size, the exterior of the fruit showed a tendency to color red and yellow, TSS content was in the medium range, and acidity and pH were in the medium-high range. The nondestructive parameters that best discriminated the different groups by maturity stage were W, AD, W/LD.
The ICONTEC classification based on appearance parameters did not respond to different ripening stages. The three groups (Color 3, 4, and 5) classified by ICONTEC were equivalent to 2 stages of maturity. In the classifications based on MI, with 2 groups (MI2), the external physical and physicochemical parameters did distinguish the different groups by ripening stage. In comparison, the classification with 3 groups (MI3), failed to differentiate group B1 from group A or B2. With the equations obtained, the maturity stage of the lulo fruits can be predicted in 75% of the cases only by measuring the weight of the fruits and their longitudinal and axial diameters.
Even though it would be convenient to extend the current research with a larger number of samples, it was possible to classify lulo fruits in an objective way with a limited number of non-destructive parameters that constitutes a very useful tool for an optimal harvest date for these fruits for export, fresh consumption, or use as raw material for the food industry and other purposes.

