


 Inglés (pdf)
 Articulo en XML
 Referencias del artículo
 Enviar articulo por email
 Citado por SciELO
  Citado por Google
  Similares en
SciELO
Similares en
SciELO  Similares en Google
 Permalink
Introduction
Among the current wide variety of oilseeds in the world, soybean (Glycine max [L.] Merrill) is the main cultivated crop. Due to its high levels of adaptability in tropical and subtropical climates, combined with high productive potential, soybean has become the most produced grain in the world (Piemontez et al., 2021). Added to this is the important use of it as a natural grain, industrialized food, and biofuel.
In recent years, because of high demand in the productive sector, soybean production has increased exponentially worldwide. Notably in Brazil, production follows the global advance. According to estimates of the Coompanhia Nacional de Abastecimento - Conab (2022), the planted area of the crop in the 2021 and 2022 would reach 40.58 million ha, an increase of 35% compared to the 2020 and 2021 harvests.
Agricultural areas in the Cerrado region are ideal for the development of Brazilian agriculture and production, mainly due to the favorable tropical climate and soils, especially Oxisols with good characteristics that facilitate mechanization and management practices (Vilela et al., 2020; Ratke et al., 2023).
Among the great need to expand soil cultures, mineral resources in the soil must be maintained so that high productivity is always achieved. Knowing and understanding all the spatial variability of soil attributes is essential because it allows for more coherent decision-making regarding the management that will be adopted. It is important to point out that the chemical, physical, and biological conditions of soil are extremely important for obtaining satisfactory agricultural production.
Roots can homogeneously exploit the soil for root development under ideal conditions when the soil volume is relatively greater than in soils with compaction problems (Valadão et al., 2015). Some compaction states cause changes in soil structure, resulting in increased soil density and soil resistance to soil penetration (Cortez et al., 2018; Oliveira et al., 2020).
In geostatistics, studies used in precision agriculture from simple and crossed interpolation of data (kriging and cokriging) refers to the physical attributes of the soil that allow an estimate of the spatial variability of a given variable by means of another variable that allows ease of determination (Montanari et al., 2015).
This study aimed to correlate the soil resistance to penetration and chemical properties of a dystrophic Red Latosol, performing mapping, and evaluating the correlation between soybean yield and soil attributes.
Materials and methods
This research was carried out in the municipality of Chapadão do Céu-GO, on the premises of the Fazenda Independência and its arable area during the 2017/2018 harvest period. The experimental site is located in the southern mesoregion of Goiás at the following geographic coordinates: 18°24T7"S, 52°44'57"W at 825 m a.s.l. The region has a megathermic humid tropical climate (Aw), according to the Koppen classification with two well-defined seasons: dry winter and humid summer with rainfall concentrated from September to March and annual averages between 1,400 and 2,200 mm and air temperatures ranging from 17°C to 30°C. The soil was classified as typical dystrophic Red Latosol with a very clayey to moderate epidystrophic texture (Santos et al., 2018).
Soil liming was carried out in July 2015, and the sequence of crops adopted was soybean and subsequently millet until the start date of the experiment. The soybean cultivar used was Desafio with pre-planting treatment. Sowing took place on November 15, 2017 under millet straw in a no-tillage system. The plant density was 310 thousand plants/ha.
Soybean fertilization was carried out as recommended with fertilizer applied at sowing using 78 kg ha-1 of P2O5 and 16 kg ha-1 of N (monoammonium phosphate-MAP). At 30 d after sowing (V4 stage-four fully expanded leaves, i.e., fourth trifoliolate), and 80 kg ha-1 of K2O (KCl) was applied in topdressing.
Soybean seeds used in this experiment were pretreated with pyraclostrobin + methyl thiophanate + fipronil (at a dose of 2 ml kg-1) and then inoculated with efficient Bradyrhizobium spp. strains at a dose of 3.0 ml kg-1 as recommended by the supplier.
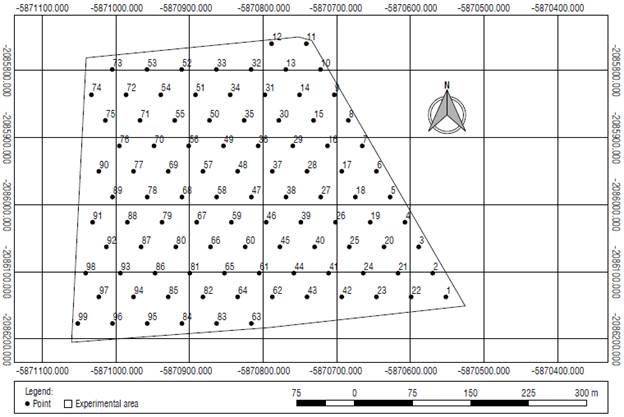
The total area of the experiment equaled 22 ha, and we collected soil samples from points in a regular grid of 40.0 x 40.0 m, totaling 99 points (Fig. 1). The deformed soil samples were collected on March 20, 2018 using a mug auger (0.0-0.2 m) with 4 simple sub-samples collected to obtain a composite sample.
Subsequently, the soil samples were sent for determination of chemical properties (Teixeira et al., 2017). The chemical attributes were as follow: pHCaCl2, phosphorus (P) (mg dm-3), potassium (K) (mmolc dm-3), calcium (Ca) (mmolc dm-3), magnesium (Mg) (mmolc dm-3), aluminum (Al) (mmolc dm-3) and sum of bases (SB) (mmolc dm-3), acid potential (H-Al) (mmolc dm-3), cation exchange capacity (CEC) (mmolc dm-3), base saturation (V) (%), organic matter contents (OM) (g dm-3) and the amount of liming required (LR) to increase the soil base saturation to 70%. Grain productivity (GP) was obtained from the harvest carried out in the total area of the experiment by a John Deere® harvester model S and totaled 670 kg ha-1 on March 5, 2018.
Mechanical resistance to penetration of soil was determined in kPa with a digital Falker® penetrolog at the soil depths of 0.0-0.10 m (PR1), 0.10-0.20 m (PR2), 0.20-0.30 m (PR3), and 0.30-0.40 m (PR4).
Statistical analysis
Soil chemical properties were submitted to a descriptive classical analysis using Rbio software (Bhering, 2017). Mean, minimum, and maximum values, standard deviation, coefficient of variation, kurtosis, asymmetry, and frequency distribution were calculated. To test the hypothesis of normality, the Shapiro & Wilk (1965) test at 5% probability was used. To assess the degree of relationship between the variables involved in the modeling process, Pearson's correlation analysis was performed, aiming to perform simple linear regressions for the combinations, two by two, among all the attributes studied. Combinations with the highest linear correlation were selected for regression modeling.
For the classification of the coefficient of variation (CV), the following variability classes and magnitudes were adopted: low (CV≤10%), medium (10%<CV≤20%), high (20%<CV≤30%), and very high (CV>30%) (Pimentel-Gomes & Garcia, 2002).
An analysis of spatial dependence of the soil chemical properties was performed by calculating the semivariogram, based on the stationarity assumptions of the intrinsic hypothesis using the Gamma Design Software GS+.
For each attribute, the nugget effect (C0), the reach (A0), and the threshold (C0 + C) were related. A dependency evaluator analysis (DEA) was performed following Cambardella et al. (1994) and according to Equation 1:

The proposed interpretation for the DEA was: 0<DEA<0.25 = weak; 0.25≤DEA<0.75 moderate; 0.75≤DEA<1 = strong.
Results and discussion
Figure 2 shows the network of correlations between the attributes studied, where V% has significant correlations of the same intensity with Ca, Mg, SB, the same as Al and H-Al. In this case, differences are the types of correlation with each character. Related to the Ca, Mg, and SB, the correlation was positive and strong; and with Al and H-Al, the correlation was negative and strong. Cations such as Ca and Mg are adsorbed on the surface of the soil colloids, and the percentage of these cations that occupy the CEC is called base saturation (V%) (Gorski et al., 2023). When V is high, that is, greater than or equal to 50%, the soil is eutrophic, rich in nutrients, especially in Ca and Mg.
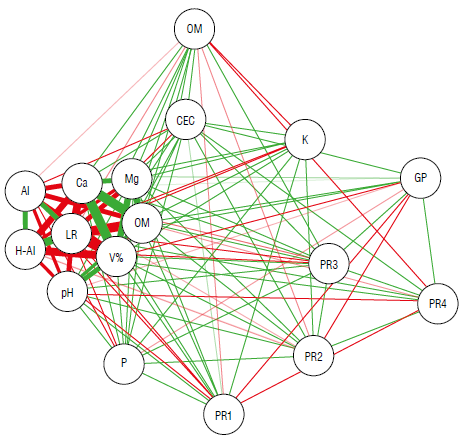
FIGURE 2 Correlation network of the attributes studied: grain productivity (GP) in kg ha-1; soil organic matter (OM) in g dm-3; phosphorus (P) cmolc dm-3; hydrogen potential (pH); potassium (K) in cmolcdm-3; calcium (Ca) in cmolcdm-3; magnesium (Mg) in cmolcdm-3; hydrogen + aluminum (H-Al) in cmolcdm-3; aluminum (Al) in cmolcdm-3; sum of bases (SB); cation exchange capacity (CEC); base saturation (V%); liming requirement (LR) in t ha-1 ; penetration resistance 0.0-0.10 m (PR1) in kPa; penetration resistance 0.10-0.20 m (PR2) in kPa; penetration resistance 0.20-0.30 m (PR3) in kPa; penetration resistance 0.30-0.40 m (PR4) in kPa.
The data from the descriptive analysis of the attributes under study are shown in Table 1. From these analyses, we see a considerable variation. However, simply knowing this change is not enough to identify high-value locations for any attribute, nor low-value locations. Geostatistics must be used to determine if there is spatial variability and how this variability occurs in the study area, and subsequently Table 1 presents the descriptive analysis of the productive maps must be created to manage the necessary field inter- components studied. The variability of a property can be ventions more accurately. classified according to the magnitude of its coefficient of variation (CV) (Pimentel-Gomes & Garcia, 2002). The OM, pH and CEC were determined to be low. The properties GP, K, H-Al, V%, and RP4 were classified as average. The CV, Ca, Mg, SB, and PR4 were determined as high. Finally, P, Al, NC, PR1, and PR2 were classified as very high. High values for coefficients of variation referring to phosphorus are completely normal due to its availability in the soil but the values vary noticeably. Lautharte et al. (2021) explain that in the case of phosphorus, the sorption of this nutrient is common in soils of this type, as it has low mobility in the soil and high retention capacity for clay minerals and oxides, which is the general case for Latosols that are relatively rich in Fe and Al oxides.
TABLE 1 Descriptive statistics for soil properties and soybean productivity.
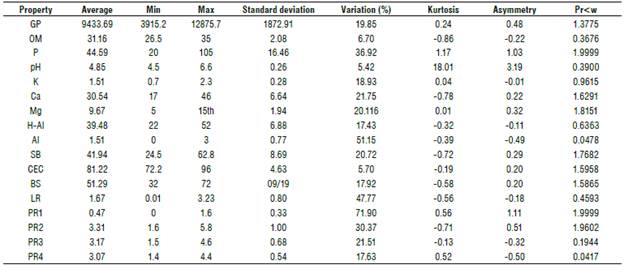
Grain productivity (GP) in kg ha-1; soil organic matter (OM) in g dm-3; phosphorus (P) cmoltdnv-3, hydrogen potential (pH); potassium (K) in cmoltdnv-3; calcium (Ca) in cmoltdnv-3; magnesium (Mg) in cmoltdnv-3; hydrogen + aluminum (H-Al) in cmoltdnv-3; aluminum (Al) in cmoltdnv-3; sum of bases (SB); cation exchange capacity (CEC); base saturation (BS); liming requirement (LR) int ha-1; penetration resistance 0.0-0.10 m (PR1) in kPa; penetration resistance 0.10-0.20 m (PR2) in kPa; penetration resistance 0.20-0.30 m (PR3) in kPa; penetration resistance 0.30-0.40 m (PR4) in kPa.
The average soybean yield was 9433.7 kg ha-1 and within the values found in soybean with high technology. Similar results in the same soil type were observed by Machado et al. (2018) who found average soybean yields of 4786.5 kg ha-1.The average productivity among producing states in Brazil is 3517.5 kg ha-1 (Conab, 2022).
The range values related to the semivariograms found by the variables ranged from 66.0 m (potassium) to 337.0 m (pH). The spatial variability observed in the crops can positively or negatively influence the crops used in rotation, so that the homogenization of the stand is essential for increasing the productive potential (Della Flora et al., 2021).
In the cross semivariogram presented in Table 3, between soybean productivity and soil attributes, we found a positive correlation. For grain yield as a function of soil cation exchange capacity (GP=f(CEC)) there was a strong spatial dependence of 0.998% on the adjusted Gaussian model. This result shows a direct relationship between productivity and CEC.
The coefficients of spatial determination (r2) were all higher than 0.940 for the semivariogram adjustments of the cross validations. Thus, there was a significant linear correlation between GP and soil attributes. Therefore, analyzing Table 3, as an example, high CEC rates might serve as a good indicator when destined for productivity projections in distrophic Red Latosol.
After adjusting the semivariograms (Fig. 3A-J) for each attribute, values were estimated using ordinary kriging. In this way, it was possible to build maps of spatial distribution for all variables in this study (Fig. 4A-J) that allowed visualizing the spatial variability in the area.
TABLE 2 Parameters estimated for the simple semivariogram of the productive components of the soybean crop.
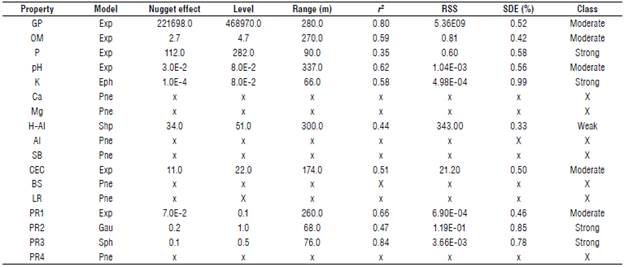
Grain productivity (GP) in kg ha-1; soil organic matter (OM) in g dm-3; phosphorus (P) cmolc dm-3; hydrogen potential (pH); potassium (K) in cmolc dm-3; calcium (Ca) in cmolc dm-3; magnesium (Mg) in cmolc dm-3; hydrogen + aluminum (H-Al) in cmolc dm-3; aluminum (Al) in cmolc dm-3; sum base (SB); cation exchange capacity (CEC); base saturation (BS); liming requirement (LR) in t ha-1; penetration resistance 0.0-0.10 m (PR1) in kPa; penetration resistance 0.10-0.20 m (PR2) in kPa; penetration resistance 0.20-0.30 m (PR3) in kPa; penetration resistance 0.30-0.40 m (PR4) in kPa; residual sum of square (RSS); spatial dependence evaluator (SDE); exponential (Exp); gausian (Gau); spherical (Sph); pure nugget effect (Pne).
TABLE 3 Parameters estimated for the cross semivariogram of the productive components of the soybean crop.

Residual sum of square (RSS); spatial dependence evaluator (SDE).
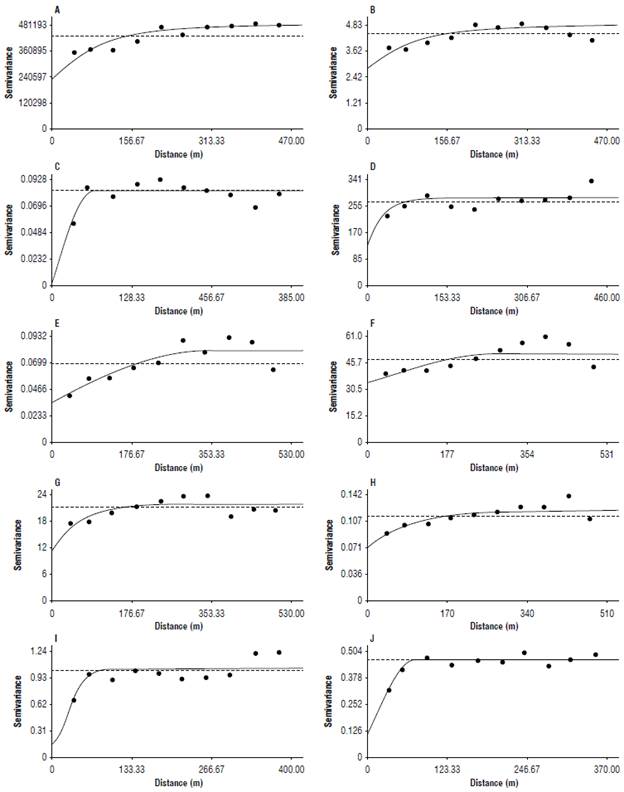
FIGURE 3 Semivariograms ajustaded: (A) grain productivity (GP) in kg ha-1; (B) soil organic matter (OM) in g dm-3; (С) phosphorus (P) cmolc dm-3; (D) hydrogen potential (pH); (E) potassium (К) in cmolcdm-3; (F) hydrogen+aluminum (H-Al) in cmol0dm-3; (G) cation exchange capacity (CEC); (H) penetration resistance 0.0-0.10 m (PR1) in kPa; (I) penetration resistance 0.10-0.20 m (PR2) in kPa; (J) penetration resistance 0.20-0.30 m (PR3) in kPa.
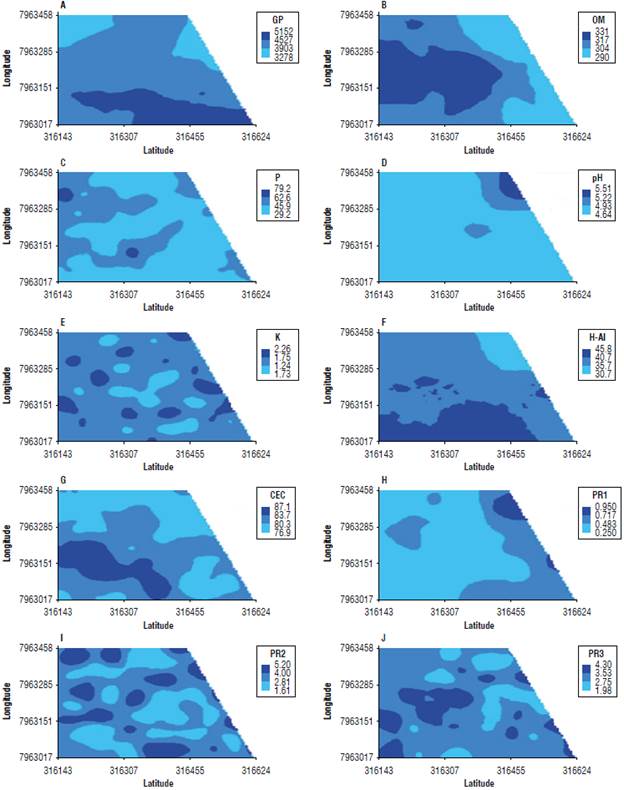
FIGURE 4 Kriging maps of parameters: (A) grain productivity (GP) in kg ha-1; (B) soil organic matter (OM) in g dm-3; (C) phosphorus (P) cmol0dm-3; (D) hydrogen potential (pH); (E) potassium (K) in cmol0dm-3; (F) hydrogen + aluminum (H-Al) in cmol0dm -3; (G) cation exchange capacity (CEC); (H) penetration resistance 0.0-0.10 m (PR1) in kPa; (I) penetration resistance 0.10-0.20 m (PR2) in kPa; (J) penetration resistance 0.20-0.30 m (PR3) in kPa.
Analyzing the spatial variability map of productivity, the southern regions of the experimental area had the highest rates of crop productivity. The observation of a productivity map (Fig. 4A), together with the observation of other types of maps, such as the physical attributes of the soils, can help to find the reasons for the occurrence of production variability. With this identification, the possibility of correction for failures arises, leaving the possibility of minimizing problems in the crop. Oliveira et al. (2018) explain that, in this way, the grower can take advantage of historical information of the area from previous mappings to make the necessary decisions for crop management, identifying regions where there is a greater or lesser need for intervention, whether in the soil or on the plants.
Observing correlated maps of GP (Fig. 3A), K (Fig. 3E) and CEC (Fig. 3G), we can analyze a higher incidence in the graph from the same region and towards the south. More incisively, there was a greater aggregate of GP correlated with the CTC map. Gazola et al. (2017) explain that, in this sense, areas with high CEC have a greater capacity to retain cations (K, Ca, and Mg) and, consequently, a greater supply of these cations are available for the plants, in view of lower leaching losses. Consequently, we can expect higher productivity.
Interpreting the map of organic matter (Fig. 3B), we see a higher incidence in the central and western regions of the cultivated area. So, it is possible to correlate areas with higher rates of organic matter available in the soil with high productivity figures. The increase in soil organic matter content is the most appropriate recommendation for maintaining soil structure and increasing water retention in the soil, favoring adequate plant development and providing better results (Oliveira et al., 2022).
Analyzing the Figure 4H, an incidence of PR1 (0.10-0.20 m) in the northeast region is classified as strong; and, in the entire eastern sector it is classified as moderate. This resistance in the surface layers of the soil hinders and restricts the results of the initial development of the plant. An important strategy to achieve soil decompaction consists of the adoption of cover crops with a robust root system as an important "biodecompaction" soil agent of soil since with the disturbance in the surface layers of the soil at planting in the direct planting system, combined with compaction because of the use of agricultural implements, the subsurface layers tend to become denser, reducing the pore space causing compaction (Oliveira et al., 2021). The cultivation of cover crops in the off-season of grain production is a practice much appreciated for Oxisols in the Cerrado region (Ratke et al., 2023).
Even with kriging providing information regarding spatial distribution and management zones, the pure nugget effect is common in soil analysis. Due to this, the attributes Ca, Mg, Al, BS, V% showed this result, that is, an absence of spatial dependence. The nugget effect is an important parameter of the semivariogram and indicates unexplained variability, considering the sampling distance used (Vieira, 2000). The greater the difference of the nugget effect in relation to the semivariogram level, the greater the continuity of the phenomenon and the smaller the variance of the estimate or the greater the confidence that can be had in the estimate.
Conclusions
Soybean productivity, soil organic matter content, phosphorus, pH, potassium, potential acidity, cation exchange capacity and soil penetration resistance from 0.00 m to 0.30 m showed spatial dependence.
The cation exchange capacity was the attribute that best described soybean productivity data in the studied dystrophic Red Latosol. Geographic points where the verified locations show higher potential acidity values have low productivity rates and consequently high CEC values correspond to places with higher productivity.

