


 Inglés (pdf)
 Articulo en XML
 Referencias del artículo
 Enviar articulo por email
 Citado por SciELO
  Citado por Google
  Similares en
SciELO
Similares en
SciELO  Similares en Google
 Permalink
Introduction
In Colombia, floriculture is one of the most important agro-industrial sectors, and it is oriented to cultivating, producing, and marketing flowers and ornamental plants. This sector has a high production for export, which gives international recognition to the country. Colombia is one of the countries with the highest exports in Latin America and, after Holland, the largest world exporter to the USA (Bautista Silva et al., 2016). This situation contributes to the generation of employment and to foster the country's economic income. Colombia produces around 60 species and 1,400 varieties of flowers for export. The main species marketed are the carnation (since 1956), roses, chrysanthemums and alstroemeria, which reach 100 countries, mainly the USA, Japan, the United Kingdom, Canada, Korea, and Spain. Between January and May 2022, the country received approximately 1.050 billion $US from their commercialization (Colombiatrade, 2019).
In the agroindustrial sector, especially in cultivation of ornamental plants for export, different types of pests and diseases affect crops from the time of planting, growth and development, harvesting, cold chain, and vase life (Yanchapaxi et al., 2010); this problem leads growers to face low productivity, decrease in quality, and high costs generated by the constant applications of agrochemical or biological products that help prevent and mitigate the effects caused by the biological targets (Rodríguez Ramírez & Torres, 1995; Álvarez Romero et al., 2018). Additionally, on certain occasions, the application of these products does not give the expected results, thus reducing the export production and quality of roses (Gómez & Arbeláez, 2005).
Studies of the behavior of pests, such as mites Tetranychus urtica, and diseases in the rose crop (Rosa spp.), such as downy mildew Peronospora sparsa, powdery mildew Podosphaerapannosa, and botrytis Botrytis cinerea have shown a relationship of their incidence with the climatic conditions that occur during their growth (Perilla & Sanabria, 2007; Filgueira & Zambrano, 2014).
Modeling in agriculture becomes increasingly important not only for monitoring the variable state of the system but also in the decision-making and management processes of the system (Arredondo Hoyos & Castañeda-Sánchez, 2020). Some models are listed below.
According to Fatnassi et al. (2015), for each sampled monitoring site i, i = 1, ...,15, and observation time tj (in weeks) tj = j; j = 1,..., 5., let Hiq denotes the weekly mean of humidity, Tiq the weekly mean of temperature, NL iq the number of thrips larvae, and NA i;tj the number of thrips adults. This model takes into account several thrips states of development.
The Kiani and Mamedov (2017) experimental model for recognizing plant diseases consists of two processes; the first is detecting the healthy and disease infected area in plants based on color processing detection algorithm (CPDA). The second is decision making based on fuzzy logic classification algorithm (FLCA). Finding the binary image of the red and green pixel of the image will guide the program to the next step. The aim of this process is to find the type of disease on strawberry leaves, which may be iron deficiency or fungal infection (Kiani & Mamedov, 2017).
The objective of this study is to develop an innovative system to assess the risk of pests using a fuzzy logic approach (Tay et al., 2021). The system is designed to provide farmers with an index representing an estimate of the risk of presence of Western Flower Thrips (WFT), Frankliniella occidentalis, in a greenhouse of roses. For this purpose, a modular knowledge-based decision support system has been designed.
González (2013) proposed the exponential increasing model, using the age of the crop in days of planting, the maximum, minimum and average temperature and the maximum, minimum and average relative humidity, 7 d before each evaluation.
The aim in this study was to obtain a mathematical model to predict the behavior and incidence of the most common pests and diseases in the rose (Rosa spp.) crop. This model considered local climatological variables of evaporation, precipitation, temperature, and relative humidity, which directly affect the presence of the biological targets (Rodríguez Ramírez & Torres, 1995). The prediction achieved with the model will contribute to preventive and/or curative actions to mitigate the effects caused by the biological targets.
Materials and methods
The main objective was to obtain an equation that allows predicting the incidence of each of the pests and diseases from the forecast of a climatological platform, to permit prompt action for preventive rather than curative control, thus, reducing costs in agrochemical purchases.
The instrument used in the study was database from the Betania farm located in the municipality of Tabio Cundinamarca - Colombia, belonging to C.I. SUNSHINE BOUQUET S.A.S. with the percentage of incidence of pests and diseases. The database contained the information of the predictor variables measured in an in situ meteorological station. The predictor variables were: evaporation, precipitation, temperature, and relative humidity, each taken as a weekly average. The weather station had evaporation and relative humidity sensors, with a rain gauge and thermometers to measure precipitation and temperatures, respectively. It was also connected to the Climate connector meteorological platform (Canal Clima S.A.S, 2023) (Canal Clima S.A.S., 2023) which shows the behavior in real time and a 14-d forecast for each of the aforementioned predictor variables.
Procedure
Direct monitoring
Direct monitoring sought to verify the presence or absence of insects, diseases and other factors that can limit or optimize the productivity of the crop.
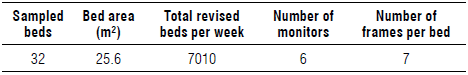
Block monitoring was carried out by a trained monitor, who moves around the bed and directly observes the presence of pests, diseases and natural enemies in different parts of the bed, as well as the plant strata, with the help of implements such as magnifying glasses, sticks, bags to collect plant material, among others. This monitoring was carried out once a week, checking 100% of the beds on one side only; the following week the opposite side was covered and, thus, in 2 weeks, 100% of the area has been checked. Beds generally have an agronomic length of 32 linear meters, but there are some beds that, due to the topography of the site, are shorter (Tab. 1). Depending on the length of the bed, the product and the monitored object, the points where the work is to be done were defined, usually two fixed points at the beginning and end of the bed, and three additional points distributed along the bed for a minimum total of 5 points. In each monitored point, an area of approximately 1 m2 and the three thirds of the plant (upper third, middle third, lower third) was checked.
The presence of any pest or disease was recorded in the monitoring application. At the end of the check (only for some pests and diseases defined by the technical department), the beginning of the bed was marked with ribbons with the color corresponding to the biological target.
To ensure the process, the person in charge was checking 5 positive and 5 negative beds for each monitor and verifying what was reported in each table by the monitor. The quality level of direct monitoring had to be greater than 90%, obtained through the assurance.
Indirect monitoring
Indirect monitoring sought to detect the presence, absence or migration of pests or diseases out of the bed, through different strategies such as:
a) Wet chamber. This monitoring consists of an assembly of flowers of six each of the species and/or varieties (67 in total) in a space saturated with relative humidity, which makes it possible to identify the presence and reproduction of the disease. The reading in a humid chamber is carried out according to the frequency established by the work center, where the presence of the disease is evaluated in all samples, and those affected are eliminated. The results of the trace are recorded in a form;
b) Pheromone and kairomone traps. These traps (50 traps in 32 ha, 1.56 traps ha-1) release a pheromone or sexual attractant, which attracts the adults of the species (moth, fly, or thrips) to the trap. Diffusers are designed to reproduce a proportion of the insect's own attractive chemical components, but with a higher emission rate. The detection and count of captured insects are carried out weekly to identify migrations or increased pest pressure on the farm;
c) ICA traps. These consist of placing kiosk traps at the four cardinal points of the farm determined by the ICA (4 traps for 32 ha, 0.125 traps ha-1), used specifically for monitoring thrips and especially Thrips palmi, reading the trap tubes located there. The reading is carried out twice a week and is recorded in the ICA "form for the weekly report of detection of thrips". This information must be registered on the platform https://sisfito.ica.gov. co/
According to the schedule, the vials (sample of captured thrips) are sent to the ICA for analysis.
Monitoring plates
Internal plates
To quantify the presence of pests in the crop, the farms must place plaques at the end of or interspersed in the block, using colors depending on the biological target. The plates should be read weekly by the monitor in charge of recording, and immediately cleaned and prepared for re-reading. These readings must be entered into the Colibri app for indirect monitoring. This application is proprietary software developed by the company Sunshine Bouquet S.A.S.
External plates were placed as follows: plate No. 1 near the entrance of the farm and the following plates every 100 m according to the clockwise movement, until the periphery of the farm is covered (around the blocks). Each plate was located on a 2 m long pole, and this should have a height above ground level of 1.5 m, located at a maximum of 1.5 m from the greenhouses. The plate was identified with the abbreviation EXT and the number corresponding to its distribution. The identification had to be placed perpendicularly on the top of the mast.
The plates were read every 7 d on one side only (external side facing the periphery of the farm), and the number of individuals of each pest trapped per plate was counted. Once the reading of the plate was finished, it was removed and replaced by a clean plate. The information from the reading was recorded in the form (with the average number of individuals per plate/pest/week) and recorded electronically.
Result analysis
The technical department of each farm consolidated the indirect monitoring data for the incidences of each of the pests and diseases. The Farm Manager/Area Manager and Plant Health Manager analyzed the results and established the control strategies to be followed: Physical Strategy -Cultural Strategy - Biological Strategy - Chemical Strategy.
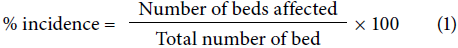
The first step in conducting this research was to collect data by monitoring the rose crop for pests and diseases. As a result of this monitoring, a report on the percentage of incidence of each of the pathogens on a weekly basis was obtained. This database was fed daily with data from the monitoring performed by the personnel in charge of this task at the farm. The percentage of incidence data is standard for the entire company. The reported percentage of incidence per pathogen is obtained by dividing the number of beds affected by the total number of beds monitored.
The information was also collected from the data obtained at the meteorological station for each of the predictor variables from week 01 of 2020 to week 24 of 2022.
The second step determined how to present the data to handle identical frequencies of analysis, considering that the pathogen incidence data were presented as a percentage on a weekly basis, and the data for the climatological predictor variables were presented on a daily basis. A weekly average of the predictor variables was chosen.
The third step cleaned the data obtained using the statistical program R. After this cleaning, correlation and multiple regression between the four predictor variables and a response variable for each pathogen was performed.
Model analysis
Pearson's correlation coefficient and multiple linear regression analysis with equations were used.
The following ranges were used for the correlation coefficient:
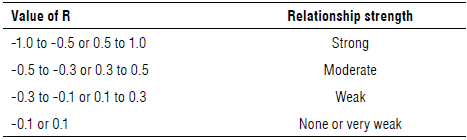
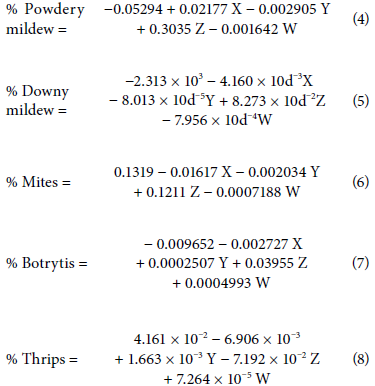
Using multiple linear regression in R, we obtained an expression of the form

where:
% Pathogen = % incidence of the pathogen tested;
X = response variable "Average evaporation/week";
Y = response variable "Average temperature/week";
Z = response variable "Average relative humidity/ week";
W = response variable "Average precipitation/week";
β 0 = Intercept; β 1 , β 2 , β 3 , β 4 = slopes corresponding to variables X, Y, Z, and W, respectively.
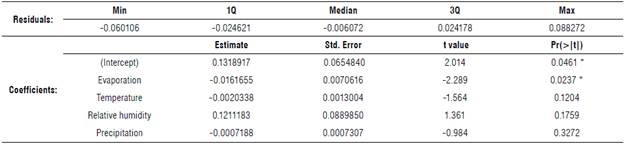
Utilizing the lm function in the R software for the statistical analysis of the database, we performed the respective multiple linear regression to see the behavior of the response variables with regard to the predictor variables. The result of this function provides an equation that allows determining the prognosis or future behavior of each of the pathogens (Tab. 3).
Example equation for prediction of mites
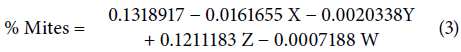
TABLE 3 Resulting multiple linear regression in the statistical software R. Example is given to predict percentage of mites.
Results and discussion
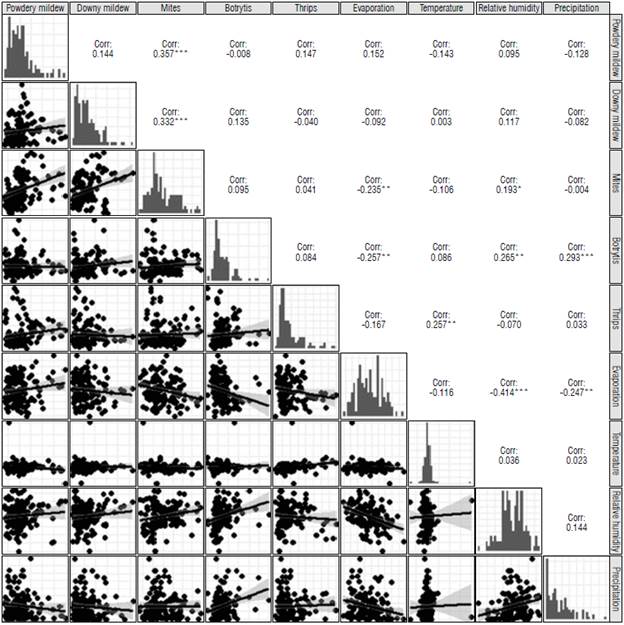
Figure 1 shows each of the existing correlations between the predictor variables (evaporation, temperature, relative humidity, and precipitation) and the response variables (powdery mildew, downy mildew, mites, botrytis, and thrips), showing how these different variables interact with each other, either directly or indirectly or what type of correlation exists, whether strong, moderate, slight or null. The correlation is expressed in percent.
As a result, in Figure 1, the correlation coefficients between each response variable and predictor variable can be observed.
The powdery mildew has weak inverse correlation with the predictor variables temperature and precipitation and a weak direct correlation with the evaporation and relative humidity variables.
Downy mildew has a weak inverse correlation with the predictor variables evaporation and precipitation, a weak direct correlation with the predictor variable relative humidity, and a very weak correlation with the predictor variable temperature.
Mites have a weak inverse correlation with the predictor variables evaporation and temperature, a weak direct correlation with the predictor variable relative humidity and a very weak correlation with the predictor variable precipitation.
Botrytis has a moderate direct correlation with the predictor variables relative humidity and precipitation, a weak direct correlation with the temperature variable, and a moderate inverse correlation with the predictor variable evaporation.
Thrips have a weak inverse correlation with the predictor variables evaporation and relative humidity, a moderate direct correlation with the predictor variable temperature, and a very weak correlation with the predictor variable precipitation.
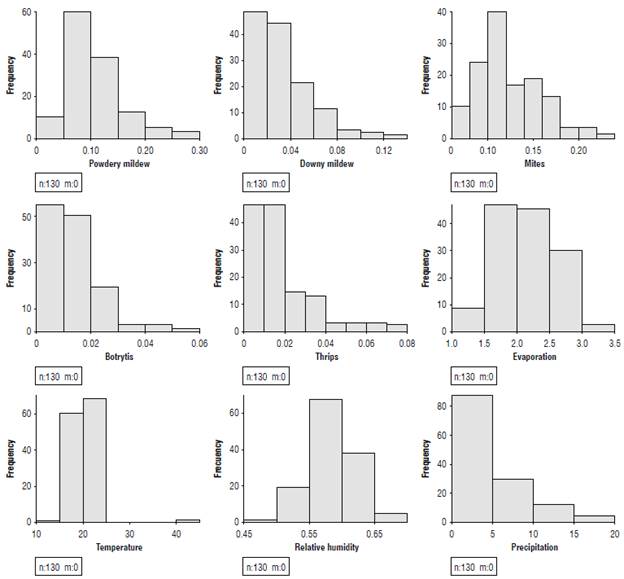
A histogram (Fig. 2) was used to graphically show the frequency of occurrence of each of the variables to determine which pest and disease occurs more frequently and in which interval.
Predictor equations obtained by means of the R statistical software
For a reliable statistical analysis, a relevant database is obtained to predict the behavior of the different pests and diseases that occur during the development of the rose crop.
This analysis used the multiple linear regression method, which allows us to take more than one independent variable to see the behavior of the response variable; in this case, the independent variables are the climatic conditions, and the response variables are each of the pests and diseases that occur in the crop.
A database was used to record the climatic conditions and the presence of pests and diseases in the Betania farm.
By means of the statistical software R and the statistical method of multiple linear regression, the following equations are proposed as a contribution of this research with the objective of predicting the increase of diseases and pests in rose crops.
These results were similar to the equation proposed (Eq. 9) in the exponential increasing model of González (2013), where the variables were the age of the crop in days of planting, the maximum, minimum and average temperature and the maximum, minimum and average relative humidity 7 d before each evaluation. This corroborates that there is a directly proportional relationship between pests and diseases with the behavior of climato-logical variables.
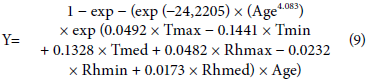
where
Tmax = Maximum temperature;
Tmed = Medium temperature;
Tmin = Minimum temperature;
Rhmax = Maximum relative humidity;
Rhmed = Average relative air humidity;
Rhmin = Minimum relative air humidity.
In the different predictor equations, verifications were made by replacing the predictor variables with values already observed to predict the percentage of incidence of each of the pests and diseases and to compare with the values reported.
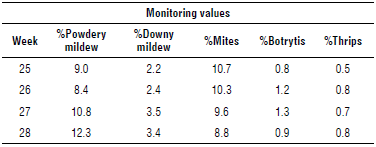
The monitoring obtained very close values, with differences of below 5% for the downy mildew, botrytis, mites and thrips, and below 10% for powdery mildew.
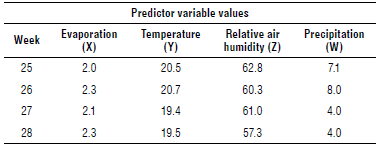
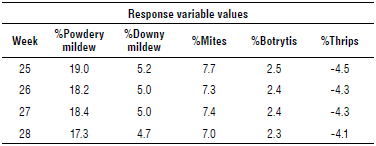
Table 4 shows the values of the predictor variables provided by the Canal Clima platform (CANAL CLIMA S.A.S., 2023), Table 5 shows the incidence percentages calculated with the predictor equations, and Table 6 shows the incidence percentages reported in the monitoring. These results show that the objective has been achieved, namely, to predict the incidence of a pest and disease based on the values of the predictor variables with an acceptable error percentage of +/- 5%.
The week number corresponds to the week of the year in which the evaluation was carried out.
Although the correlations between pathogens and predictor variables are moderate or weak, the latter have a significant influence when predicting the percentage of incidence of each pathogen by replacing observed values of the predictor variables in the equations obtained.
Correlation tests are useful to identify the trend of the response variables as a function of each of the predictor variables, which does not necessarily mean that when two variables correlate with each other, it is due to a cause and effect relationship; these variables may be independently related to a third variable.
While this analysis obtained satisfactory predictions, the amount of information in the database should be increased in order to make a more accurate prediction, considering that the data used in this research were limited.
Agriculture has improved due to the use of intelligent agricultural machines for crops and livestock control, intelligent monitoring drones for pest control, as well as to observation sites that record agro-climatic variables to collect large amounts of data at the lowest costs. This has led to more information-oriented, potentially more productive, and efficient agricultural processes.
The above results indicate the need to deepen understanding of the incidence of diseases in the face of the climate changes that are manifesting themselves by constantly feeding the database and thus obtaining better predictions. Further studies to address the subject could be done using different methodologies, such as the application of Machine Learning and Deep Learning, thus creating an autonomous learning algorithm that can make it even more efficient in its predictions.
From the practical point of view, it is important to correct some aspects, to undertake improvements and to include new elements of interest for the solution to the problem addressed.
Conclusions and recommendations
The objective of obtaining equations that allow predicting the incidence of pathogens according to the predictor variables was achieved; this provides several benefits, including the ability to make timely decisions to counteract the effect or damage that pathogens may cause in the crop.
The incorporation of these equations into the agrochemical application program for pathogen control could clarify what type of agrochemical to use and which pest or disease to attack. This would also contribute to a rational use of the different agrochemicals, biological controls, or both, and would also yield cost savings in the purchase of agrochemicals.

