


 Spanish (pdf)
 Article in xml format
 Article references
 Send this article by e-mail
 Cited by SciELO
  Cited by Google
  Similars in
SciELO
Similars in
SciELO  Similars in Google
 Permalink
Introduction
Food insecurity (FI) is a risk factor for developing acute and chronic disease. In addition, the likelihood of treatment success decreases when treating sick subjects. This trend has been described in cancer patients, in whom the cancer risk and treatment complications are greater when there is evidence of FI 1),(2), (3), (4. Food insecurity leads to nutrient-poor diets, including dietary fiber. Colon cancer in Colombia is the third cause of death and its incidence is increasing 5.
FI is an expression of inequality, and it is closely linked to economic incapacity. In addition, FI limits the body’s biological response to fight infections, leads to metabolic disorders, and favors the development of risk factors for the onset of mental illness, brain and cardiovascular disease, and cancer 1), (6), (7. An increase in chronic disease and cancer is explained as an undesirable effect of socioeconomic development.8 In Latin America, per capita income, life expectancy, level of schooling, and other indicators related to the quality of life in the population have increased 9. However, the epidemiological profile has transitioned from a predominance of diseases from group I to those from group III. Health care systems went into crisis when dealing with high-cost diseases as the diet changed from traditional patterns to a Western-like diet. In addition, in some countries such as Colombia, social and economic inequality has been accentuated 6), (10), (11), (12), (13.
In Colombia at the end of 2010, there were 8 population-based cancer registers in 8 geographic areas, in 2012 they were evaluated and found in the four main ones, some degree of under-registration and need for improvement in their information 14), (15. In the absence of better data, based on these four profiles, the National Institute of Cancerology [Instituto Nacional de Cancerología - INC] used mortality data and the International Agency for Research on Cancer (IARC) methodology to estimate the cancer incidence in Colombia. Colon, rectal, and anal cancer is the third most prevalent cancer in women after breast and cervix cancer and is the fourth most prevalent in men after prostate, stomach, and lung cancer. In Colombia, the annual colon, rectal and anal cancer incidence rates (CRACIs) adjusted by age between 2007 and 2011 per 100,000 inhabitants were 12.3 and 12.2 in women and men, respectively 16. Mortality from colon, rectal, and anal cancer continues to increase 17.
The objective of this study was to establish the degree of association between FI and the CRACI in the Colombian territory. In addition, we determined whether it was possible to predict the CRACI at the ecological level based on biological and socioeconomic variables expressing different development dimensions, here known as the “context”, where colon, rectal, and anal cancer occurs.
Materials and methods
With data collected during the 2007-2011 period an ecological study was carried out using official secondary data that was produced by different state agencies. The database that gave rise to the study is part of an effort to establish the relationship in Colombia of nutritional variables with some types of cancer. The design, statistical analysis and description of the variables had already been performed 16), (18.
Population and sample
The population consisted of adults (male and female), between 18 and 64 years of age, living in Colombia. The sample size was 24, corresponding to the 24 of 33 geodemographic units in Colombia, also known as departments. The sample, n=24, corresponds to the geodemographic units of the country where 95 % of the Colombian population lives 18.
Dependent variable
Incidence rate adjusted by age per 100,000 inhabitants (CRACI). The National Institute of Cancerology [INC, in Spanish] and the Ministry of Health and Social Protection [Ministerio de Salud y protección Social - MSP] published a report on the incidence, mortality, and prevalence of cancer in Colombia in 2015 according to population-based cancer records from the cities of Pasto, Cali, Bucaramanga, and Manizales 16. The CRACI was estimated and reported in this document. The codes used by the study were those of the international classification of diseases (ICD-10; codes C18-C21). In summary, the population records from 2003-2007 were modeled using multiple regression and weighted by the square root of the population of each record to obtain the specific incidence of the different cancer types in each geodemographic unit for the period 2007-2011. The details of the methodology have been previously described 16.
Context variables
A total of 13 variables representing the development or context of the geodemographic units where colon, rectal, and anal cancer occurred were established.
Adherence to dietary consumption patterns 18. Colombia carried out the National Survey of Nutritional Situation in 2010 [Encuesta Nacional de Situación Nutricional - ENSIN-2010].19 In the ENSIN, a food frequency questionnaire (FFQ) was applied to estimate the frequency/day, i.e., “times/day”, of consumption of some foods considered of interest for nutrition and public health given the Colombian nutritional and epidemiological profile. The FFQ measurement methodology in ENSIN has reproducibility and validity studies and has been previously described in detail 19. In 2015, based on the FFQ records applied in the ENSIN-2010 and through factor analysis, it was established that three food consumption patterns coexist within the Colombian population: traditional/starch, fiber/dairy, and snacks 12), (13. The individual adherence to each of the three consumption patterns was established as a Z score. Since the average adhesion is a Z score, here they were centered as follows: [adherence Z score - minimum value]. In this sense, the value zero represents the least adherence to a certain food consumption pattern within a geodemographic unit.
Excess waist circumference (%) 18. This measurement was taken in the ENSIN-2010 in subjects between 18 and 64 years of age, excluding pregnant women and those who had a child in the previous three months. A ROSSCRAFT® tape measure was used, with a 1 mm sensitivity. This measure establishes abdominal obesity. Excess waist circumference was defined as ≥ 90 cm in men and ≥ 80 cm in women 19.
Excess weight based on body mass index (%) 18. In the ENSIN-2010, weight was measured in subjects between 18 and 64 years of age using the Seca electronic balance, model 872®, with a sensitivity of 100 g. Height was determined with a Diseños Flores SR® portable stadiometer, with a sensitivity of 1 mm. The BMI was established as kg/m2, and a BMI ≥ 25 was defined as excess BMI 19.
Monetary poverty - 2010 18. This value was obtained according to the monetary income of households. Since 2011, the National Administrative Department of Statistics (DANE) has calculated this index using the same methodology and regularly reports it. Monetary poverty data were obtained from regional bulletins, one per geodemographic unit 20), (21.
Gini coefficient - 2011 18. This measure represents the income inequality in each geodemographic unit; it is calculated on a regular basis by DANE 22.
Household FI 18. The ENSIN-2010 estimated the domestic FI using the Latin American and Caribbean Food Security Scale [Escala Latinoamericana y Caribeña de Seguridad Alimentaria - ELCSA] 23. The survey was completed by the head of the household. The ELCSA evaluates an FI dimension, namely, physical access to food. The official definition reported by the ENSIN-2010 was as follows: “FI is the limited or uncertain availability of adequate and safe nutritional foods, or the limited and uncertain capacity to acquire adequate food in socially acceptable ways” 7), (19. FI is a measure that is established on a regular basis by the Colombian ENSIN.
Annual growth rate, in volume of gross domestic product (GDP) for the geodemographic units (%) - 2011. This value represents the growth in the total value of goods and services produced in the geodemographic unit per department for the year 201 24.
Human development index (HDI) - 201 18. This index summarizes the achievements of those who inhabit a geodemographic unit. It measures three dimensions:
a) a long and healthy life, b) knowledge/access to education, and c) a decent standard of living. The HDI is the arithmetic mean of the normalized indices of each of the three dimensions. The dimension of health is evaluated according to life expectancy at birth; education according to the average schooling years reached by adults 25 years or older, and the gap between the actual and theoretical schooling years that children of school age should reach, while the standard of living dimension is measured by the per capita gross national income. This index is calculated and reported regularly by the United Nations Development Program 25.
Health system coverage (%) - 2010. This calculation based on the number of individuals registered in the Single Affiliate Database in the contributory and subsidized programs as of December 31 of each year, as reported by the MSP, compared to the projected population published by DANE, according to the 2005 census 26), (27.
The total population in the geodemographic units in 2011 and the average age per gender in 2010 were taken from the projections made by DANE, which were based on the population census of 2005 27.
Statistical análisis
The statistical analysis was oriented to establish, a) the raw and adjusted association of FI and the context variables in the geodemographic units with the CRACI and b) the possibility to predict the CRACI in the ecological context. Associations between FI and the context variables were established through simple and multiple linear regressions (LR), with the β partial regression coefficient and its 95 % confidence interval (95 % CI), where the CRACI was the dependent variable, and the context variables (including FI) were the independent variables. The statistical normality of the CRACI was guaranteed. The choice of variables to establish predictive models was made based on Student’s t statistic and the p-value reached in the bivariate relationship. The goodness of fit of the LR models in predicting the CRACI at the ecological level was established with the coefficient of determination, R2, the Pearson r correlation coefficient, and the average difference between the observed and estimated CRACIs using the Bland and Altman method 18), (28. All the evaluations were carried out with the statistical package Stata 14.1 29.
Results
In the twenty four geodemographic units that make up Colombia, a total of thirteen context variables were studied (including FI) in relation to the CRACI.
Characteristics of the population
The average monetary poverty, Z ± Standard Deviation (SD), was 41.5 % ± 13.8; the average GINI coefficient was 0.52 ± 0.03; the average GDP growth was 6.0% ± 4.4; the mean prevalence of excess weight (BMI ≥ 25) was 52.2 % ± 5.0; the mean FI prevalence was 45.9 % ± 11.7; the average HDI was 0.81 ± 0.05; and the average health system coverage was 88.2 % ± 6.6. Table 1 shows other characteristics of the studied population.
Table 1 Characteristics of the studied population. Colombia, 2007-2011.
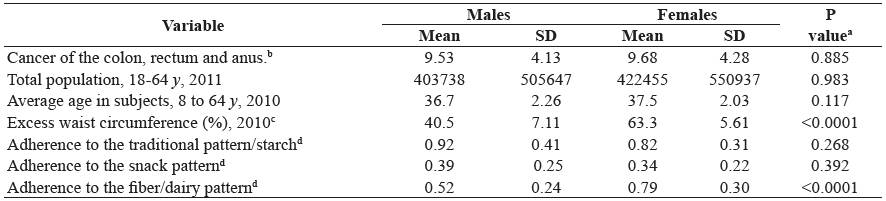
SD Standard deviation. a Value of p for the student t statistic. b Incidence x 100,000 inhabitants, adjusted by age. c Prevalence of excess waist circumference, for males ≥ 90 cm, for females ≥ 80 cm. d Based on factor analysis. Z-scores centered [Z - minimum value]. Zero represents the least adherence to the consumption pattern.
CRACI, FI, and context variables in thegeodemographic units
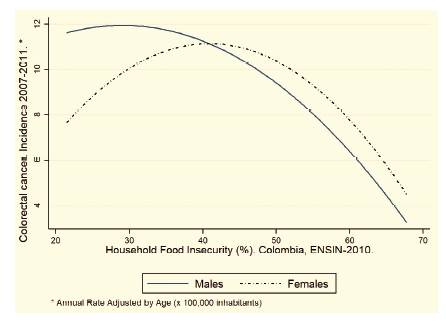
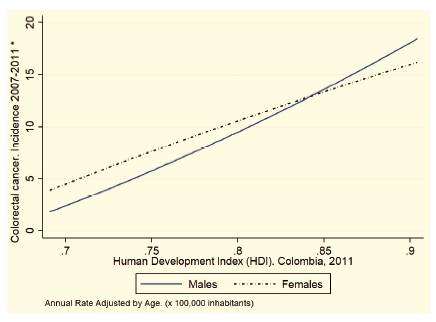
In the bivariate relationship, there is a direct relationship between the CRACI and the population size, average age, HDI, and adherence to the fiber/dairy pattern for both men and women. There is an inverse relationship between the CRACI and both monetary poverty (%) and FI in the household (%). Table 2 shows the details of the bivariate relationships between the CRACI and the context variables in the geodemographic units. Figures 1 and 2 show the relationship between
When these relationships are fitted in multivariate [CRACI = -6.38 + -0.25 * FI + 35.5 * HDI] models, both FI and the HDI remain associated with men and women. Table 3 features six models, A-F, In women, model F, established through multiple LR to study the association between the CRACI and the context variables in the [CRACI = 6.47 + -0.23 * FI + 19.1* HDI] geodemographic units.
Two equations predict the CRACI:
In men, model C,
[CRACI = -6.38 + -0.25 * FI + 35.5 * HDI]
In women, model F,
[CRACI = 6.47 + -0.23 * FI + 19.1* HDI]
Table 2 Incidence adjusted for age of colon, rectum and anus cancer - rate x100,000 inhabitants, and contextual variables in the geodemographic units. Colombia, 2007-2011.
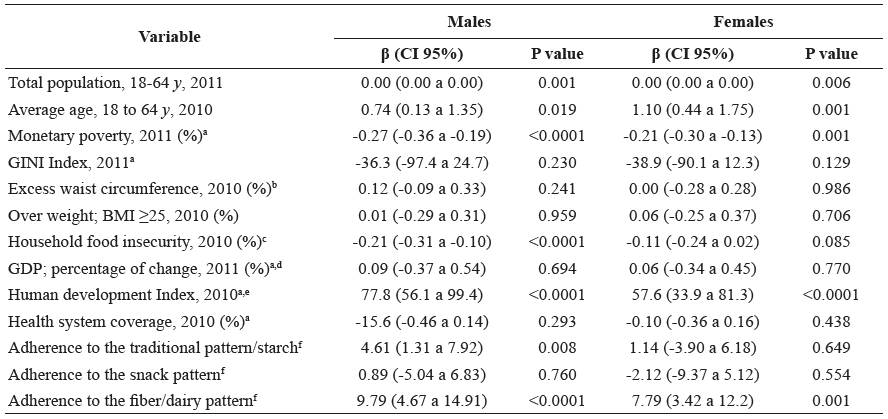
β (CI 95%). Partial coefficient of regression achieved in the bivariate relationship and 95% confidence interval. In the linear model, the incidence rate of colon and rectal cancer - rate x 100,000 inhabitants is the dependent variable, and the context variable is the explanatory variable. a n = 33 except for this variable, where n = 24. b Prevalence of excess waist circumference, for males ≥ 90 cm, for females ≥ 80 cm. c Based on the Latin American and Caribbean scale of food security -ELCSA. d Represents the growth in the total value of the goods and services produced in the geodemographic unit. e Measures three dimensions, a) have a long and healthy life, b) acquire knowledge / access to education and c) enjoy a decent standard of living. f Based on factor analysis. Z-scores centered [Z - minimum value]. Zero represents the least adherence to the consumption pattern.
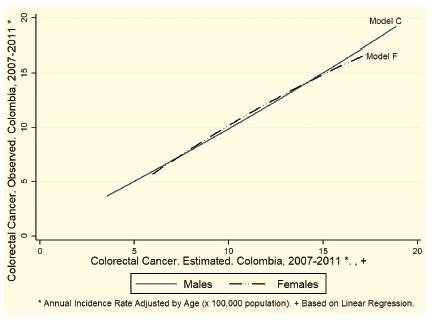
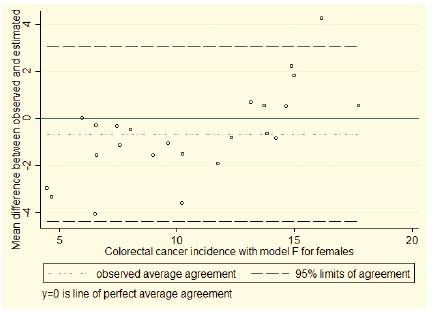
The R2 coefficient of determination for model C is 88%, while in model F, it is 72%. The correlation between the estimated and observed CRACIs with model C is r = 0.94 (95% CI: 0.86 to 0.97), while for model F r = 0.85 (95% CI: 0.68 to 0.93). The Bland and Altman statistic estimating the average difference between the CRACI observed in each geodemographic unit versus that estimated with LR models C and F is -0.00 (95% CI: -3.13 to 3.13) for men and 0.00 (95% CI: -4.08 to 4.08) for women. Figure 3 shows the relationship between the observed CRACI versus that estimated with models C and F.
Figures 4 and 5 show the mean difference between the observed CRACI and estimated CRACI with models C and F and their limits of agreement (Bland and Altman).
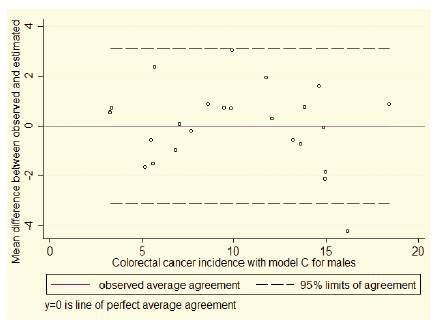
Figure 4 Mean difference between the observed and estimated incidence of colorectal cancer in males. Model C. Colombia, 2010
Discussion
We establish that in Colombia, FI is significantly and inversely associated with the CRACI and that it is possible to predict the CRACI at an ecological level using two variables that are calculated on a regular basis by Colombian state agencies-FI and the HDI. The achievements of the economic model adopted in Colombia have allowed improvement in the HDI and have allowed the country to be considered a mediumincome, or even a high-income, country 30), (31. However, in the territory, there are deep economic inequalities, and extreme levels of development coexist, from primitive to industrialized rural societies; furthermore, the prevalence of FI is high 19), (25), (32), (33. In addition, demographic, epidemiological, nutritional, and food transitions are still Dynamic 10), (11), (13), (32), (33.
FI has previously been identified as a risk factor in the development and treatment of patients with cancer since the associated economic incapacity reduces adherence to treatment and promotes a limited biological response, explained by a limited and poor-quality diet that exposes these patients to greater levels of infection and relapse 1), (2), (3. There are also reports showing a lower quality of life in minorities with cancer who also have FI 4. We can now confirm that in the territories with increased FI, the CRACI is lower. A possible explanation for this is that as greater social and economic development is achieved in the territory, decreasing FI, the diet transitions toward a greater consumption of proteins of animal origin, more refined carbohydrates and less fruits and vegetables and in general less dietary fiber, which in turn favors the development of mediators of chronic disease, such as obesity, hypertension, and cancer. This change is part of the phenomena called nutritional transition and food transition12),(34),(35. The increase in food availability as a result of the decrease in IF favors greater longevity at an ecological level, but this does not mean greater quality in the diet. FI is an imperfect expression of development; greater levels of development and a lower CRACI do not necessarily guarantee an adequate diet that protects against the development of cancer, i.e., food security, does not seem to translate into real “security” against cancer. In general, what is conceived as development compromises food culture, decreases adherence to traditional consumption patterns, which have demonstrated to be a protective dietary factor against mediators of chronic disease, and encourages individuals to migrate to undesirable diets, such as the so-called Western diet 36), (37. FI as a predictor variable of the CRACI has enormous potential, because in relative terms, it is much more economical to establish the FI of a territory through the ELCSA than to implement an epidemiological surveillance system, a population registry of cancer, or a specialized observatory 23), (38. FI interacts with chronic conditions such as cancer, and health care costs are higher in the presence of this interaction in subjects with FI and poor health than in subjects with FI alone 39.
Table 3 Linear regression models that explain the incidence rate of cancer of the colon, rectum and anus - rate x 100,000 inhabitants, in the geodemographic units. Colombia, 2007-2011.
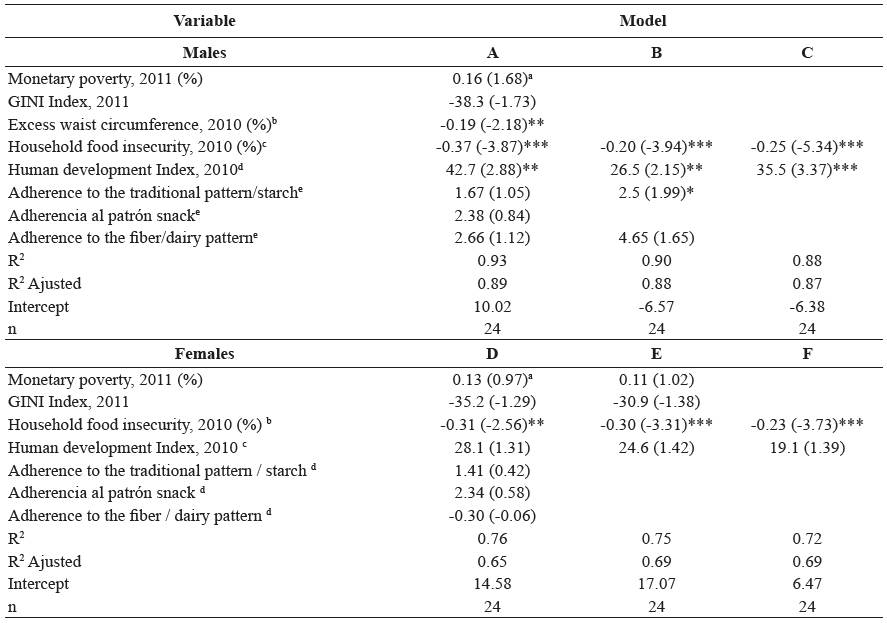
ab Coefficient β and value of the statistic (t) in parentheses. Based on the Latin American and Caribbean scale of food security -ELCSA.
C Measures three dimensions, a) have a long and healthy life, b) acquire knowledge / access to education and c) enjoy a decent standard of living.
d Based on factor analysis. Z-scores centered [Z - minimum value]. Zero represents the least adherence to the consumption pattern.
*, **, *** Represent the statistical significance of 10%, 5% and 1% respectively
The HDI is calculated on a regular basis by the United Nations Development Program based on secondary information and is routinely available in Colombia 25. The direct relationship between the HDI and the CRACI is explained by the fact that this complex index is similar to the welfare concept derived from socioeconomic and physical development, a greater life expectancy and longevity, and better education levels that, in theory, should translate to greater capacities for self-determination to choose and ensure a healthy diet and better conditions in the context of the territory to lead a dignified life 40), (41), (42. Both FI and the HDI are calculated with known methods and are widely used in many countries. Cancer is an undesirable effect of development, and therefore, the idea of development that we pursue today can at least be questioned to better understand what the imbalanced dimension that produces this effect is. In Latin America and Colombia, it is clear that the inequitable redistribution of wealth is the cause of FI and is in contrast to diets that are similar to a “Western diet” 25), (42.
We carried out differential analyzes by sex, because the reported national rates of CRACI in Colombia are differential according to sex and because we found differences at the ecological level in two variables that have been associated in the causal pathway of CRACI, the mean of the Consumption adherence to the fiber/ dairy pattern was lower in men, as was the prevalence of abdominal circumference (Table 1). However, the prevalence of abdominal circumference was ruled out in the first adjusted models and, although the fiber/ dairy pattern remained slightly associated with men, the final model did not include it (model C). Dietary fiber intake is an attractive variable for an explanation in CRACI 5), (8), (38), (39, but multi-causality is what is most relevant in the study of complex phenomena such as the one studied.
Scope and limitations of the study
CRACI was estimated for the 2007-2011 and food patterns were estimated for 2010. The food patterns do not change easily and are stable for long periods, given that the latency period of the tumors is on average five years, the periods of estimation of cancer and the eating pattern are concurrent. Studies with cross-sectional data do not allow causality to be established. However, the associations presented here are plausible, and the CRACI can reasonably be the dependent variable in a mathematical model that operates as a theoretical explanation. In ecological studies, the variables that represent the context of the territory can act as a proxy for other variables and interactions that are difficult to measure, which constitutes the strength of this study. In this study there is no possibility of cross-level bias or ecological fallacy, since all analyzes were made based on aggregated data and the conclusions are made exclusively based on the unit of analysis; the territory. The idea of development, as conceived by Western logic and supported by variables that represent improvements in social, economic, and physical aspects, is sufficiently represented in the context variables that were studied.
Population-based cancer registries are essential to establish the incidence, disease burden, epidemiological surveillance, and success of control strategies and are, in general, based on research, but in spite of their relative low cost as an information system, in Colombia they still have important deficiencies14),(15. Without consolidating these deficiencies, and as a complementary alternative to obtain reliable information on the occurrence of cancer, the MSP is developing the National Cancer Observatory initiative 40. The equations and explanations presented here constitute a cost-effective method when there are real difficulties in reliably estimating the CRACI, as in Colombia

