Serviços Personalizados
Journal
Artigo
Indicadores
-
 Citado por SciELO
 -
 Acessos
Links relacionados
-
 Citado por Google
 -
 Similares em
SciELO
 -
 Similares em Google
Compartilhar
Revista Facultad de Ingeniería
versão impressa ISSN 0121-1129
Rev. Fac. ing. vol.25 no.43 Tunja set./dez. 2016
Acoustic lung signals analysis based on Mel frequency cepstral coefficients and self-organizing maps
Análisis de señales acústicas de pulmón basado en coeficientes cepstrales de la escala Mel y mapas auto-organizados
Análise de sinais acústicos de pulmão baseado em coeficientes cepstrais da escala Mel e de mapas auto-organizados
Álvaro David Orjuela-Cañón*, Hugo Fernando Posada-Quintero**
* Ph. D. Universidad Antonio Nariño (Bogotá D.C.-Distrito Capital, Colombia). alvorjuela@uan.edu.co.
** Ph. D. (c) Universidad Antonio Nariño (Bogotá D.C.-Distrito Capital, Colombia). hposada@uan.edu.co.
Fecha de recepción: 18 de marzo de 2016 Fecha de aprobación: 25 de mayo de 2016
Abstract
This study analyzes acoustic lung signals with different abnormalities, using Mel Frequency Cepstral Coefficients (MFCC), Self-Organizing Maps (SOM), and K-means clustering algorithm. SOM models are known as artificial neural networks than can be trained in an unsupervised or supervised manner. Both approaches were used in this work to compare the utility of this tool in lung signals studies. Results showed that with a supervised training, the classification reached rates of 85% in accuracy. Unsupervised training was used for clustering tasks, and three clusters was the most adequate number for both supervised and unsupervised training. In general, SOM models can be used in lung signals as a strategy to diagnose systems, finding number of clusters in data, and making classifications for computer-aided decision making systems.
Keywords: acoustic lung signals; computer-aided decision making; self-organizing maps.
Resumen
En este trabajo se realizó un análisis de anormalidades en señales acústicas de pulmón. La metodología incluyó el uso de coeficientes cepstrales de la escala Mel (MFCC), Mapas Auto-Organizados (SOM) y el algoritmo de agrupamiento K-means. Los modelos obtenidos con los mapas son conocidos como redes neuronales artificiales, que pueden ser entrenados en una forma supervisada o no supervisada. Ambos tipos de entrenamiento fueron usados para comparar el uso de este tipo de herramientas computacionales en estudios de señales respiratorias. Los resultados mostraron un 85% de acierto en la clasificación, cuando fue implementado un entrenamiento supervisado. Al realizar tareas de agrupamiento con entrenamiento no supervisado fue encontrado que el número de grupos más adecuado es de tres. En general, los modelos SOM pueden ser usados en este tipo de señales como una estrategia útil en sistemas de diagnóstico, encontrando información en los datos y realizando clasificación para sistemas de apoyo a decisión.
Palabras clave: mapas auto-organizados; señales acústicas de pulmón; sistemas de apoyo a decisión.
Resumo
Neste trabalho realizou-se uma análise de anormalidades em sinais acústicos de pulmão. A metodologia incluiu o uso de coeficientes cepstrais da escala Mel (MFCC), Mapas Auto-Organizados (SOM) e o algoritmo de agrupamento K-means. Os modelos obtidos com os mapas são conhecidos como redes neurais artificiais, que podem ser treinados em uma forma supervisada ou não supervisada. Ambos os tipos de treinamento foram usados para comparar o uso deste tipo de ferramentas computacionais em estudos de sinais respiratórios. Os resultados mostraram um 85% de acerto na classificação, quando foi implementado um treinamento supervisado. Ao realizar tarefas de agrupamento com treinamento não supervisado foi encontrado que o número de grupos mais adequado é de três. Em geral, os modelos SOM podem ser usados neste tipo de sinais como uma estratégia útil em sistemas de diagnóstico, encontrando informação nos dados e realizando classificação para sistemas de apoio à decisão.
Palavras chave: mapas auto-organizados; sinais acústicos de pulmão; sistemas de apoio à decisão.
I. Introduction
Chronic Respiratory Diseases (CRD) are a critical public health problem in developing countries [1, 2]. Diagnosis of this kind of diseases can be challenging for the medical staff when they have limited resources (like rural regions far from big cities), making the diagnosis process to vary according to access to medical care of each patient [3]. In this way, new technological tools can contribute to clinicians and physicians in diagnostic tasks, providing additional information. In addition, for respiratory diseases diagnosis, traditional methods to assess lung functions are based on auscultation. Disadvantages of these methods are related to the use of the stethoscope, because it is a subjective process that depends on stethoscope characteristics and the capabilities of the physician [4, 5].
Computer-aid decision support systems are commonly used in the biomedical fields because of the information they can provide in diagnosis assignments [6]. This information is useful for the medical staff when extra help is needed. Most of these systems take advantage of previous stored data, conducting a procedure known as data mining [7], where Artificial Neural Networks are preferred due to their flexibility treating any kind of data.
Artificial Neural Networks (ANN) are mathematical tools for modeling in high dimensional classification problems. The ANN establish a non-linear relationship between input variables and known outputs in a supervised learning system [8]. Another applications of ANN are developed in an unsupervised learning, known as tasks of clustering. Examples of ANN in respiratory diseases diagnosis can be seen in [9-11], where clinical and epidemiological variables are used to train neural models.
For ANN training, it is necessary to extract from datasets parameters that conform the input vector. These features can be extracted from patients' data by using signal processing representation or image processing parameters. In this study, lung acoustic signal is acquired and processed by Mel Frequency Cepstral Coefficients (MFCC) to obtain representative parameters of each signal. A database was built with these coefficients and then used in the ANN training. This signal processing technique has shown good results in representing acoustic signals of the respiratory system [12-14].
The present work studies the use of ANN based on Self Organizing Maps (SOM), as a pre-processing for clustering task developed through K-means algorithm. Subsequently, SOM was used as a classifier of acoustic lung sounds resulting from respiratory abnormalities. Experiments using signal processing to obtain features, which were used as inputs in the ANN training, are presented. Three different classes were defined, two representing abnormal sounds, and a third class representing normal sounds. Results are compared with previous studies, which used Gaussian Mixture Models and Support Vector Machines for the classification [12]. Other studies [15, 16] utilized methodologies including neural networks, but without using MFCCs.
II. Materials and Methods
First, the used database and signal processing implemented to extract features from each signal are presented. Then, characteristics about neural network architecture and training are described.
A. Database
RALE database [17], developed by the University of Manitoba, Winnipeg-Canada, was utilized in this study. This repository is composed by thirteen recordings obtained from patients who exhibited normal breath, crackles, wheezes and other abnormalities found in acoustic lung sounds. These signals were high pass filtered at 7.5 Hz to suppress any DC offset by using a first-order Butterworth filter. Additionally, a second eighth-order low-pass Butterworth filter at 2.5 kHz was applied to avoid aliasing. All signals were sampled at 10 Hz.
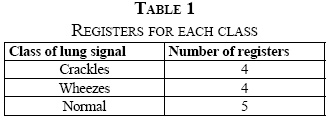
Table 1 shows the number of signals for each class, according with abnormalities located in the database. Crackles represent discontinuous explosive adventitious lung sounds, and are obtained from patients with cardio-respiratory disorders. Characteristics of these sounds are the time length, less than 20 milliseconds, and frequency range, which typically ranges from 100 up to 2000 Hz [18]. The waveform of the wheeze signals is similar to a sine wave with fundamental frequency around 100-2000 Hz, and time length for this kind of signals varies between 80 and 250 milliseconds [18].
B. Mel Frequency Cepstral Coefficients-MFCC
MFCC is a representation from speech signals based on perception of human being. MFCC uses Discrete Fourier Transform (DFT) and the Discrete Cosine Transform. The main difference is that the bands are placed in a logarithmic way, according to the Mel scale. In this way, the speech is modeled by a more human answer, allowing a more efficient signal processing [19].
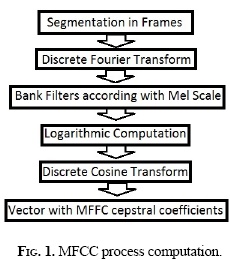
MFCC process computation is carried out first with signal segmentation into frames, and DFT is calculated. Afterward, the spectrum is filtered using thirteen triangular windows corresponding to the Mel frequency scale. Logarithmic functions are applied to the energy computed in the Mel frequency bands, and Discrete Cosine Transform (DCT) is used for each logenergy. Finally, the MFCC correspond to the amplitude spectrum provided after DCT (Figure 1). In this study, signal was divided into frames of 30 milliseconds with a frame shift of 10 milliseconds. For each frame, thirteen coefficients are computed to represent the acoustic lung signal based on performance obtained in previous studies [12, 14, 19].
C. SOM neural networks
SOM neural networks are capable of arranging the input data into a discretized two-dimensional space known as map, which attempts to preserve the topological properties of the input space. This is motivated by behavior of visual, aural and sensory areas of the human cerebral cortex [20, 21].
The main advantage of SOM architectures, compared with other neural network models, is the training because in most of the cases it is unsupervised. This is useful in clustering tasks because similarities in the data can be found by the map [20].
SOM uses the information from the input to do a representation across a nonlinear mapping in an output space with reduced dimensionality. This new space is taken to analyze the original dataset in a graphical way, where different areas of the map preserve characteristics of the classes employed in the training process.
Learning process is composed by three stages: competitive, cooperative and adaptive. In competitive learning, Euclidian distance (weights) from each input to all units or neurons is computed. The unit with the most similar weight to the input is defined as the best matching unit (BMU). Then, a cooperative process is given around BMU, and units close to it are updated based on a neighborhood function. Finally, adaptive process (1) changes BMU weights according to the input [20]. This is reached through the expression:
where ωi(t) are weights of the map, η (t) is a learning coefficient, hij (t) is a neighborhood function, and x (t) is the input vector.
For training, SOM network provides necessary information such as number of units, size, type of lattice map, and neighborhood function parameters. Number of units and size define the map resolution, type of lattice defines arrangement units from regular or irregular forms, and the base size of the neighborhood function controls cooperative process [20].
There are heuristic rules to compute number of units and map dimension, one of them is based on principal component analysis (PCA). The ratio of first and second principal components from the training dataset can provide an initial value to obtain the length and width relation of the map [20, 21]. Also, it is necessary to attempt that data activate all units of the map. These rules were followed to determine the number of units and size. Hexagonal topology for lattice was implemented because the distance between adjacent units is similar.
Finally, the neighborhood function (2) establishes the strength in connections between the units. In the present work, it is based on Gaussian distribution, given by:
where dij is the Euclidian distance between the j unit and BMU, and σ (t) is the basis of the function in the iteration t. This parameter changes during the training, beginning with a basis of four units and ending with just one unit. The map size and area where the neighborhood function has significant values determine the classification accuracy and generalization [20].
D. Training process
In training process, database size is important to build sets to train the neural networks, and sets to validate the best model. In this case, a high number of events is demanded. Nevertheless, different strategies have been studied to solve these difficulties. Cross validation and bootstrap techniques are examples of these solutions [22-24].
In this study, where only thirteen registers/events are available, a specific cross-validation technique known as Leave One Out (LOO) was implemented. Therefore, the number of ANN obtained is the same as the events in the database (thirteen). For each network, training set is settled by all but one event, and the use of SOM networks is validated in a general way, through the error of all trained ANN.
The LOO error is a statistical estimator of the behavior when a learning algorithm is used, and it is very useful for model selection because is slightly biased, despite its empirical error. Also, when the algorithm is stable, LOO error is low [21, 22]. The LOO error (3) can be calculated using:
where m is the number of samples in the D set, composed by the zi elements, and fi is the function obtained after training. These methods have been used in applications where models of regression or structures in time series are required.
An unsupervised training was developed, where just information extract from acoustic lung signal was established. In this case, a vector with thirteen features was presented to the input of neural network. Here, trained maps were analyzed clustering the neurons, and searching for a map divided into groups that represent the information in the input of the map.
Additionally, a supervised training based on labels of acoustic lung signals was implemented. As shown in Table 1, three classes were established for map training. A map clustering was pre-defined through K-means algorithm, adjusting to three groups the neurons of the trained map output.
E. Post-training process
After SOM training, it was established a clustering process using the K-means algorithm that is based on proximity measures between data representation. In this case, information from neurons in the map were used as the algorithm. Proximity between neurons is measure through synaptic weights [25].
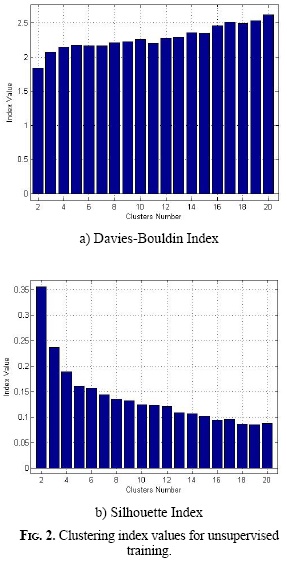
When unsupervised training was implemented, the number of clusters extracted from the map, through K-means algorithm, was evaluated using quality measures for clustering processes. Davies-Bouldin and Silhouette indices were used with this objective [26-27]. According to this, the best number of clusters was found, and labels were put for each one of them, corresponding to the number of hits given by each signal in different regions of the map. Then, a classification rate for unsupervised proposal was computed.
For supervised training, the number of cluster was settled to three that corresponds to the number of abnormalities in the database. Then, a classification rate for supervised proposal was calculated.
Computation of the classification rate was based on frames. Each signal was divided into frames to extract the MFCC values, and each frame was presented as an input vector to the SOM+K-means proposal. The classification rate was determined according to the cluster with the highest number of activations given by the frames. In this way, lung signal was classified according to the class with the highest number of activations in each neuron in the network output. This calculation was developed for each neural network from thirteen trained networks by proposal. Then, general efficiency was computed, using the LOO technique.
III. Results
According to LOO method, validation is obtained with one sample left out. This means that a single neural network was trained for each acoustic lung signal, obtaining thirteen networks by unsupervised and supervised proposal. The results of the two approaches are shown below.
A. Unsupervised proposal
Figure 2 shows values for Davies-Bouldin and Silhouette indices. The best values for both indices correspond to small number of clusters. Therefore, it was preferable to maintain three clusters, and compare these results with supervised approach. Subsequently, the SOM+K-means proposal was adjusted to this number of clusters.
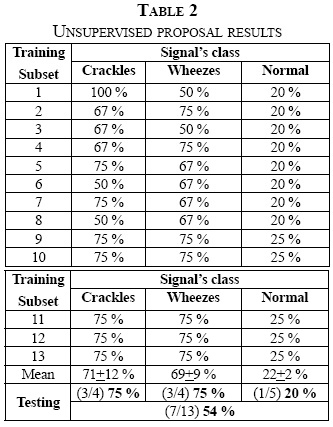
Table 2 shows the unsupervised proposal results. The best classification rate performance from training was 71% for crackles class. It is possible to see that the Normal class had a low classification rate, showing the poor capability of neural network to learn this pattern. Wheezes class had a classification rate of 69%.
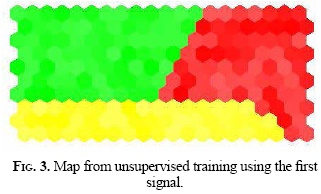
Results from the testing test are shown as number of hits out of number of maps for each class obtained through LOO technique. In summary, crackles cluster had 75%, Wheezes 75% and Normal 20% of classification accuracy. In general, these results had 54% of classification accuracy. Álvaro David Orjuela-Cañón - Hugo Fernando Posada-Quintero Figure 3 shows the first of the thirteen maps obtained with three clusters defined with red, green and yellow colors (crackles, wheezes and normal).
B. Supervised proposal
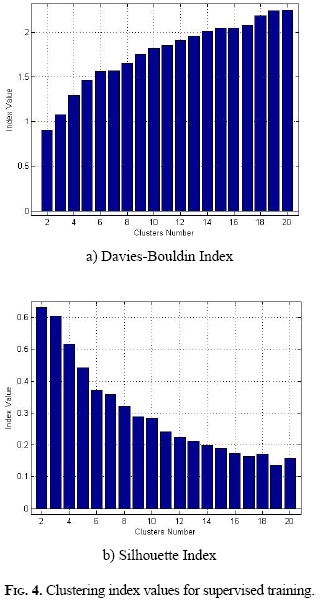
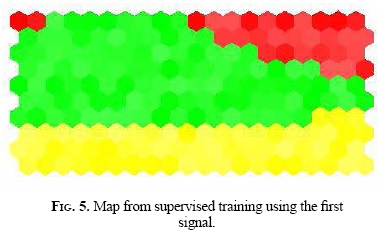
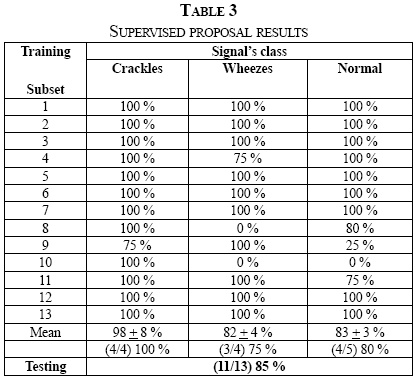
For comparison, Figure 4 shows Davies-Bouldin and Silhouette indices from maps obtained by supervised training. Both indices showed that small number of clusters exhibit better results. According to the classes in the database, the number of clusters was fixed to three. Table 3 shows the results of the supervised proposal, and Figure 5 shows the clustering map. In the map, three regions are visualized, according to the supervised proposal. Red, yellow and green colors were used to label the crackles, wheezes and normal clusters, respectively.
IV. Discussion
As previously mentioned, the LOO method attempts to obtain results in terms of method efficiency in a general way. This means that there is not a single network that solves the classification problem; however, there is a models based study on neural networks for the classification methodology.
A substantial difference between unsupervised and supervised approaches was the classification efficiency. In the first proposal, results reached 54% for testing set. In the second approach, 85% of efficiency was reached. This shows that information included in supervised proposal was important in terms of classification rates.
When results are compared with other approaches [12, 28], it was noticeable that classification rates, for supervised proposal, were closer to these results. Table 4 summarizes these comparisons.
Results from normal signals were poor in the unsupervised training. This can be explained by intra-cluster differences. Signals for this class were obtained from sounds such as vesicular, tracheal, bronchial and bronchovesicular, which are different but belong to the normal class [17].
Index values were comparable in both type of trainings. The best indices were obtained with small number of clusters and in the supervised proposal.
Differences in clustered maps can be noted where clusters have better performance in the supervised proposal with well-defined regions (Figures 3 and 5). Irregular clustering was exhibit in the supervised proposal, where for crackles signals (Map1 to Map4), one cluster was divided into the corners of the map (Figure 5).
The results from testing could be shown using a mean computed with just thirteen maps, according to the available number of signals. Therefore, complementary experiments with bigger databases would provide more information about the use of current methodology. Databases with more samples facilitate the study of other kind of validation methods, without the limitations exposed here.
V. Conclusions
Neural networks are useful tools to analyze acoustic lung signals. SOM trained in a supervised way provided a rate classification of 85%, obtaining comparable results to previous studies for classifying lung signals. Finally, the clustering technique used here showed that it is possible to analyze this kind of signals to extract relevant information, and determine whether they belong to an abnormal or a normal group.
Acknowledgment
This work has been funded by Universidad Antonio Nariño through research grants and PFAN program.
References
[1] A. Alwan, Global status report on noncommunicable diseases 2010-2011. World Health Organization, pp.1-176. [ Links ]
[2] R. Beaglehole, S. Ebrahim, S. Reddy, J. Voute, and S. Leeder, "Prevention of chronic diseases: a call to action," The Lancet, vol. 370 (9605), pp. 2152-2157, Dec. 2007. DOI: http://dx.doi.org/10.1016/S0140-6736(07)61700-0. [ Links ]
[3] D. T. Jamison et al., Disease Control Priorities in Developing Countries, 2nd. ed., World Bank Publications, 2006. [ Links ]
[4] A. R. Sovijrvi et al., "Characteristics of breath sounds and adventitious respiratory sounds," European Respiratory Review, vol.10 (77), pp. 591-596, 2000. [ Links ]
[5] H. J. Schreur et al., "Abnormal Lung Sounds in Patients with Asthma Function During Episodes with Normal Lung Function," Chest, vol. 106 (1), pp. 91-99, Jul. 1994. DOI: http://dx.doi.org/10.1378/chest.106.1.91. [ Links ]
[6] A. Belle, M. A. Kon, and K. Najarian, "Biomedical Informatics for Computer-Aided Decision Support Systems: A Survey," The Scientific World Journal, vol. 2013, pp. 1-8, 2013. DOI: http://dx.doi.org/10.1155/2013/769639. [ Links ]
[7] D. S. Kumar, G. Sathyadevi, and S. Sivanesh, "Decision Support System for Medical Diagnosis Using Data Mining," International Journal of Computer Science Issues, vol. 8 (3), pp.147-153, 2011. [ Links ]
[8] S. Haykin, Neural Networks and Learning Machines, 3rd ed., Pearson Prentice Hall, 2008. [ Links ]
[9] O. Er, T. Termutas and A. C. Tanrikulu, "Tuberculosis Disease Diagnosis Using Artificial Neural Networks," Journal of Medical Systems, vol. 34 (3), pp. 299-302, Jun. 2010. DOI: http://dx.doi.org/10.1007/s10916-008-9241-x. [ Links ]
[10] E. Elveren and N. Yumusak, "Tuberculosis Disease Diagnosis Using Artificial Neural Network Trained with Genetic Algorithm," Journal of Medical Systems, vol. 35 (3), pp. 329-332, Jun. 2011. DOI: http://dx.doi.org/10.1007/s10916-009-9369-3. [ Links ]
[11] A. D. Santos et al., "Neural networks: an application for predicting smear negative pulmonary tuberculosis," Advances in statistical methods for the health sciences, pp. 275-287, 2006. [ Links ]
[12] P. Mayorga et al., "Acoustics Based Assessment of Respiratory Diseases using GMM Classification," in 2010 Annual International Conference of the IEEE Engineering in Medicine and Biology, pp. 6312-6316, Aug. 2010. DOI: http://dx.doi.org/10.1109/iembs.2010.5628092. [ Links ]
[13] A. Abushakra and M. Faezipour, "Acoustic Signal Classification of Breathing Movements to Virtually Aid Breath Regulation," IEEE Journal of Biomedical and Health Informatics, vol. 17 (2), pp. 493-500, Mar. 2013. DOI: http://dx.doi.org/10.1109/JBHI.2013.2244901. [ Links ]
[14] P. Mayorga et al., "Expanded Quantitative Models for Assessment of Respiratory Diseases and Monitoring," in 2011 Pan American Health Care Exchanges, pp. 317-322, 2011. DOI: http://dx.doi.org/10.1109/pahce.2011.5871917. [ Links ]
[15] A. Banik, R. S. Anand, and M. A. Ansari, "Remote monitoring and analysis of human lung sound," in 2008 IEEE Region 10 and the Third International Conference on Industrial and Information Systems, pp 1-6, 2008. DOI: http://dx.doi.org/10.1109/iciinfs.2008.4798463. [ Links ]
[16] A. Gurung et al., "Computerized lung sound analysis as diagnostic aid for the detection of abnormal lung sounds: A systematic review and meta-analysis," Respiratory Medicine, vol. 105 (9), pp. 1396-1403, Sep. 2011. DOI: http://dx.doi.org/10.1016/j.rmed.2011.05.007. [ Links ]
[17] Database RALE Univeristy of Manitoba, Canada. http://www.rale.ca/. [ Links ]
[18] G. Charbonneau et al., "Basic techniques for respiratory sound analysis," European Respiratory Review. vol. 10 (77), pp. 625-635, 2000. [ Links ]
[19] L. Rabiner and J. Biing-Hwang, Fundamentals of Speech Recognition, Prentice Hall, 1993. [ Links ]
[20] T. Kohonen, Self-Organizing Maps, Springer, 2000. [ Links ]
[21] L. Faussete, Fundamentals of Neural networks: architectures, algorithms, and applications. 3rd ed., Prentice Hall, 1994. [ Links ]
[22] R. Kohavi, "A study of cross-validation and bootstrap for accuracy estimation and model selection," in Proceedings of the 14th International Joint Conference on Artificial Intelligence, pp. 1137-1143, Feb. 1995. [ Links ]
[23] A. Zoubir and R. Iskander, Bootstrap Techniques for Signal Processing. Cambridge: Cambridge University Press, 2004. DOI: http://dx.doi.org/10.1017/CBO9780511536717. [ Links ]
[24] A. Elisseeff, "Leave-one-out error and stability of learning algorithms with applications," NATO Science Series Sub Series III Computer and Systems Sciences, vol. 190, pp. 111-130, 2003. [ Links ]
[25] T. Kanungo et al., "An Efficient k-Means Clustering Algorithm: Analysis and Implementation," IEEE Trans. Pattern Anal. Mach. Intell., vol. 24 (7), pp. 881-892, Jul. 2002. DOI: http://dx.doi.org/10.1109/TPAMI.2002.1017616. [ Links ]
[26] D. L. Davies and D. W. Bouldin. "A cluster separation measure," IEEE Trans. Pattern Anal. Mach. Intell., vol. PAMI-1 (4), pp. 224-227, Apr. 1979. DOI: http://dx.doi.org/10.1109/TPAMI.1979.4766909. [ Links ]
[27] P.J. Rousseeuw, "Silhouettes: a graphical aid to the interpretation and validation of cluster analysis," J. Computational Appl. Math., vol. 20, pp. 53-65, 1987. DOI: http://dx.doi.org/10.1016/0377-0427(87)90125-7. [ Links ]
[28] A.D. Orjuela-Cañón and D.F. Gómez-Cajas, "Artificial Neural Networks for Acoustic Lung Signal Classification," Lecture Notes in Computer Sciences, vol. 8827, pp. 214-221, 2014. DOI: http://dx.doi.org/10.1007/978-3319-12568-8_27. [ Links ]


