I. Introduction
In the department of Casanare, Colombia, there has been a major expansion of the oil industry, particularly in the field of exploration and extraction of crude oil, which has generated a considerable increase in electricity demand above the projected level for the current population. This growth involves the residential, industry and commerce sectors that overloads the electrical system attempting to meet the new demand, which results in overloaded and unreliable systems.
The Power Company Enerca S.A. E.S.P Casanare is the operator of the Regional Transmission System (RTS) and the Local Distribution System (LDS), and commercializes the electricity in the department. The company offers electrical services to 98 973 regulated and unregulated users [1], which generates a great responsibility for improvement and constant updating of the power systems. This is because the Colombian Law 143 of 1994 establishes that "Activities related to electricity service shall be governed by principles of efficiency, quality, continuity, adaptability, neutrality, solidarity and equality" [2].
Due to the unexpected growth in demand, power grids have expanded in an unplanned way. Currently, the company has problems of coordination protection, maintenance, regulation and voltage imbalance, making the system unreliable and prone to failure. To reduce these problems in an orderly and planned manner, we decided to model the electrical system using commercial some available computational tools used worldwide [3,4] to prepare projects that improve service availability.
Initially, parameters of loading capacity, transformer short-circuit impedances (Zcc), conductor sizes, height and distance between phases, and structure types were updated. The loading parameter was measured on site using network analyzers, and the information of the remaining parameters was gathered directly from the company (i.e., information files and databases), and from visits and inspections to the circuits and electrical substations of ENERCA S.A E.S.P. With this data, the system was entered into the computational tool to perform load flow and fault analyses.
Two types of simulation were carried out. In the first, we determined the actual electrical system, indicating currents (I), voltages (V), apparent power (S) and power factor (PF). The second simulation was made with the forecast demand for the year 2019 according to the growth projection for the three geographical areas covered by the electrical system; we used a linear regression according to the growth in current years.
The most critical circuits in terms of power quality and frequency faults during 2012 and 2013 were determined from modeling and system simulation, with the statistical faults generated by the quality department by Enerca S.A. E.S.P. For the five most critical circuits, different solution strategies were determined. it is worth noting the 34.5 kV Maní circuit, which showed deficiencies in voltage regulation suggesting a double circuit construction, and the 34.5 kV Morichal circuit, which displayed overloads at peak hours, hence transformer repowering is proposed. The redesign and development of the coordination protection, which is in poor coverage, is one of the proposals to improve the quality and system reliability.
II. Power system topology
An Electric Power System comprises a set of elements that allow the transmission of electric power from the generator to the end user. This process is defined in three stages: generation, transmission, and distribution (Figure 1) [1].
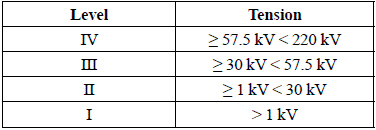
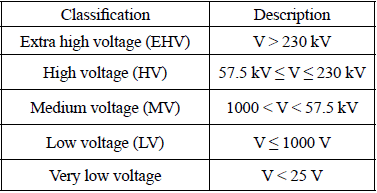
In Colombia, the voltage classification levels, according to the Energy and Gas Regulation Commission (CREG) (Table 1), are in accordance with the Regulations of Electrical and Technical Installations (RETIE) [5] and the Colombian Technical Standards (NTC) 1340 [6] (Table 2).
A. Regional Transmission System (RTS)
According to CREG, the RTS is the set of elements responsible for transmitting electricity from generation centers to consumption centers through various stages of transformation tension. Electrical substations that are responsible for interconnecting transmission lines and power plants transform different voltage levels, operating voltages below 230 kV, which do not belong to a local distribution system [2]. For the Power Company Enerca S.A. E.S.P Casanare, the transmission system is 115 kV.
B. Local Distribution System (LDS)
The Mining and Energy Planning Unit (UPME) defines distribution as the activity of transmitting electricity through a series of lines and substations, with their associated equipment, which operate at voltages below 230 kV that do not belong to an STR dedicated to the service of a municipal, district or local distribution system [7].
In conclusion, the distribution system is comprised of a set of elements that allow high quality, reliable and successful connection of the electrical energy that it requires [8]. For the Power Company Enerca S.A. E.S.P Casanare, the distribution system is 34.5 kV, 13.8 kV, and low voltage networks are from 220 V to 120 V.
III. Methodology
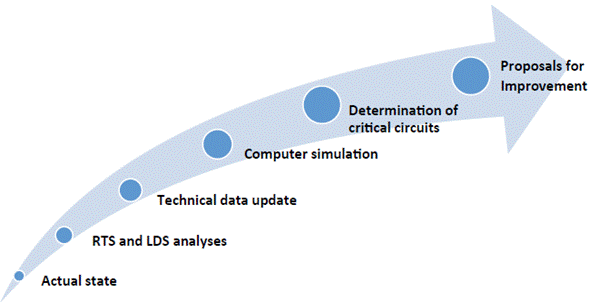
Figure 2 shows all the steps and methodology developed.
A. Enerca S.A. E.S.P. electrical system current status
The Enerca S.A. E.S.P Electric Power System is completely radial; therefore, it is weak, with low reliability and robustness. It is necessary that this type of system has a good quality of service operation and maintenance. It has three power generators of 115 kV (Yopal Thermoelectric, Paipa Thermoelectric and Chivor Hydroelectric). The system has four power substations 115/34.5/13.8 kV, with a 128 MVA installed capacity.
B. Regional Transmission System (STR)
The Enerca S.A. E.S.P Electrical System is divided in four zones: North, Center 1, Center 2 and South. North, Center 1 and Center 2 are fed from San Antonio substation or thermoelectric Yopal, and the South zone from Chivor substation.
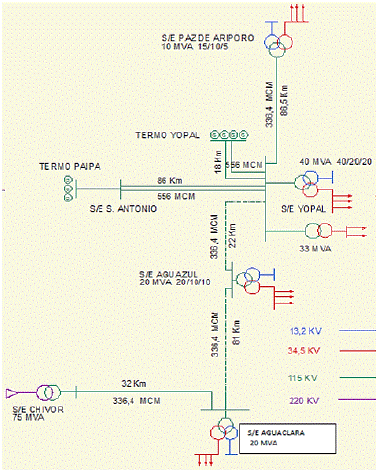
Figure 3 shows the single-line diagram of Enerca S.A. E.S.P. Regional Transmission System S.A., and Table 3 presents the 115 kV, 34.5 kV and 13.8 kV line lengths.
C. Local Distribution System (SDL)
Most of the construction units in the 34.5 kV distribution system in Enerca S.A. E.S.P., according to the structure code of the Ministerio de Minas y Energía de Colombia (ICEL) [14], are P-103 type-52 %, followed by PH 202 type-20 %, SH 226 type-16 %, and the remainder are P102 type-12 %.
According to the users' behavior history, there was observed a demand increase of 7.31 % in 2013, compared with 2012. In 2013 in Casanare, the electrical system had 49 substations of 34.5/13.8 kV and 4 substations of 115 kV, of which 16 of 34.5/13.8 kV were suspended for maintenance.
Measurements were carried out for voltage regulation, losses and power level in 36 of the 49 substations, both in low and medium voltage. Also, technical information about the bus configurations, power transformers, conductors, phase distance, insulation levels, among others, for modeling and system simulation, were taken. This showed that some substations were working in risky condition as follows: 7 substations without shield systems, 7 with problems in fuse cutouts, 6 with oil leaks in their power transformers, and many others failed to meet the minimum safety standards and hot spot at 34.5 kV. Table 4 shows loading of the 115 kV substations in service during 2013.
Loading measurements in the 34.5/13.8 kV substations allowed us to find that some of these were overload or close to being so: S/E Calceta (99 %), S/E Quebrada Seca (101 %) and S/E Tilodiran (101 %). In addition, the 34.5 kV Morichal circuit is 20 % overloaded with respect to its nominal rating. If the overloads last more than two hours a day, the useful life of the power transformers is reduced [15,16].
D. Updating technical information of the electrical system
Existing information about electrical diagrams, line and transformer loads, conductor sizes, circuit structure types, substation capabilities, and lengths of the electrical lines and grids was collected. To compare, measure, and test the acquired data, appropriate formats to record each visit to the electrical substations were created.
The inductance and capacitance parameters of the lines were determined using the Geometric Mean Radius (GMR) method and the conductor's manufactures manuals. The structure type and distances between conductors were determined by visual inspection according to the number of conductor guards, followed by the identification of the five most critical circuits according to power and service quality.
E. Power systems simulation
In the past, field engineers of the company Enerca S.A. E.S.P. made decisions for the electrical power expansion system based on field measurements of a small system. However, due to the rapid growth in demand and the need to expand the company's networks, they encountered numerous problems mainly due to the increasing complexity and difficulty taking on-site measurements on its system, resulting in an unreliable system. Given the availability of digital computer simulation tools, which allow reproduction of the electrical system behavior to study its response to various operating conditions, the company decided to use one of them to improve its system.
Enerca S.A. E.S.P. acquired the computational tool Electrical Transient Analyzer Program (ETAP) because is one of the most complete for design, simulation, operation, control, optimization, design of grounding systems, protection coordination, etc., for systems of generation, transmission, and distribution. This program was acquired because many companies in the electricity sector and universities in Colombia use it. Additionally, it is an analytical tool used by several companies worldwide to design, maintain and operate electrical systems [9-12].
Planning a future expansion of the system entails to determine the best operation of existing systems or network reconfigurations. In order to do so, Enerca S.A. E.S.P. began collecting circuit data characteristics to perform initial power flow and short circuit analyses, and hence obtain a more accurate assessment of electrical power and projection system voltage levels 115 kV and 34.5 kV.
F. Determination of circuits with more failures in the Enerca S.A. E.S.P. power system
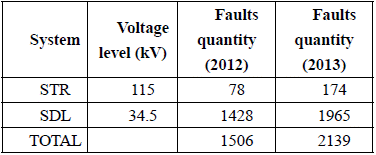
The current Enerca S.A. E.S.P. electrical system is unstable, and in the event of a fault, the system can easily go out of service. Between 2012 and 2013, the system had 1822 faults and meltdowns (Table 5).
According to Table 5, in 2013, faults increased 27 % for the SDL and 55 % in the STR. However, it should be noted that this sharp increase in the STR was due to the introduction to operation of the 115 kV Aguazul substation, and the testing conducted before commissioning such substation. The fault quantity and frequency is higher in SLD than in STR.
The main cause of 34.5 kV circuit faults is the frequency rate disruptions -FES (87.5 %). Table 6 shows the circuits with more critical fault history.
Most faults are caused by lightning and inadequate protection coordination (65 %), followed by natural disasters (22.4 %), replacement fuse faults (2.8 %), lines maintenance (1.8 %), configuration variation (1.3 %), and other minor occurrences. Within the line fault group, there are 50/51 and 50N/51N relays and reclosers. This information is recorded by the control center equipment and power quality meters available in all substations of 34.5 kV.
IV. Simulation of ENERCA S.A. E.S.P. Electric System
Once the parameters and data of type and line configuration, sizes and distances between conductors, impedances, reactances and TAP position of power transformers as well as the peak loads in the 34.5 kV substations and the regulated and non-regulated users was collected, the system model was built and introduced in a similar way to a single-line diagram to the simulation software.
Two simulations were carried out; first, Event 1, with current loads and the highest demand during the day; and second, Event 2, with the medium-term projection of demand for 2018. The load forecast for the medium-term was performed according to the zone's demand growth using the demand projection as designated by [17]. For Center 1 and 2 zones the projected demand growth is 12 %, for the Southern zone 7 %, and for the Northern zone 6 %.
The electrical system in the simulation program consists of all substations, lines and transformers of 115 kV and 34.5 kV, and the loads are the circuit exits of 13.8 kV.
A. Event 1 simulation (Current state)
This simulation analyzed the entire Enerca S.A. E.S.P. power system to find the demand behavior under normal and fault conditions. The load flow and fault analyses were conducted with minimal and maximum demand.
1) Load Flow Simulation Event 1: There are several methods for calculating a power flow. In this paper, we used the Newton-Raphson method because it is the most commonly used [8,13]. The results were similar to the values measured in-situ during the substation visits. Table 7 presents the percentage of the main substations capacity operation, showing the ones that are overload, which place them in marginal or alert state.
According to Table 7, the 40 MVA transformer is overloaded, which generates an emergency state because it is the most important plant in the Center zone. When transformers are overload over a long period of time, the temperature increases considerably reducing their lifetime [16]. On the other hand, when the utility reaches maximum demand, the tension in 34.5 kV buses falls considerably (Table 8). These buses are in critical condition, being below 90 % of the rated voltage, which is the minimum operating voltage in the resolution CREG 024 of 2005 [18].
2) Fault Simulation Event 1: The short circuit current Icc is one of the most important parameters, when a fault occurs on different nodes of the system, to size the conductors, transformers of current, protection relays, power interrupters, and other newly installed units. The short circuit current defines the minimum value of interruption capacity that the elements involved during the fault must have to be able to support the Icc and clear it.
The most severe type of short circuit is the three-phase, which also produces high current values and reduces to zero the line transmission capacity. This short circuit is followed by the two-phase and the single-phase [8]. The most common fault type is the single-phase, which is due to atmospheric discharges (in about 75 % of cases), and the least frequent is the three-phase (in about 5 % of cases) [19].
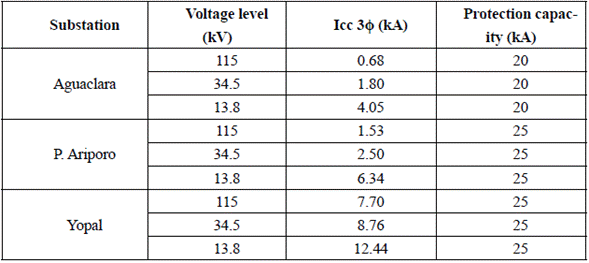
The simulations enabled the identification of the maximum short circuit currents in the 13.8 kV bus, which is is located in the Yopal substation with a value of 12.4 kA. Table 9 shows the results of the short circuit current in 115 kV substations, proving they do not exceed the protection capacity; therefore, they do not represent a risk to the protection equipment.
B. Simulation Event 2 (Electrical System 2018)
In event 2, the departmental demand was projected until 2018, using the last five year's growth rate in Industry and Population. According to the information provided by the utility's Engineering and Planning office, the North zone will have an annual increase in demand of 5 %, the Center 1 and 2 zone will have 12 %, and the South zone will have 6 % [15].
Because the city of Yopal reflects the highest growth in demand in the entire zone, it is expected that by 2018 the repowered Yopal substation will be back on service, with the introduction of a new 50/30/20 MVA transformer.
1) Load Flow Simulation Event 2: According to the simulation results, it was determined that fifteen 34.5/13.8 kV substations will present an overload condition, and seven 34.5 kV buses will present voltage drop levels of more than 10 %. In the South zone, the growth in demand will be 7 %, and the distribution network and transmission will not be overloaded.
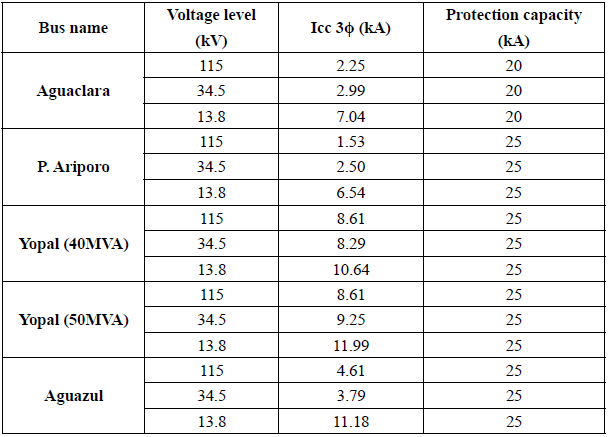
2) Fault Simulation Event 2: The short circuit currents (Icc) found in substations repowered by 2018 will not exceed the interrupters capacity, therefore, they will not require any change.
Table 10 shows the maximum short circuit currents in 115 kV substations. The only increase is in the Icc at the 115 kV bus of the Yopal substation, from 7.7 kA to 8.6 kA. This is because transformer loads of 40 MVA will be distributed by the new 50 MVA transformer, even though it will not be harmful to the system.
V. Proposals to improve the electrical system
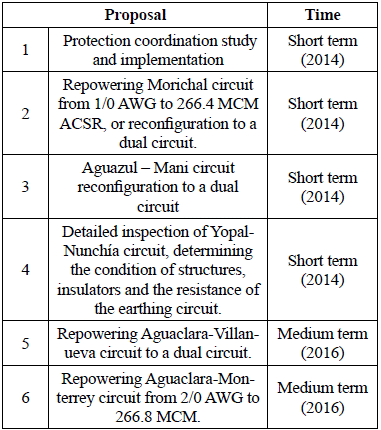
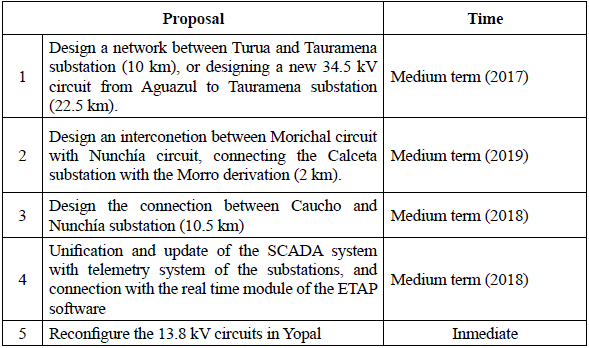
The analysis of the simulations results permitted the identification of six immediate proposals to correct the 34.5 kV system, which are indicated in Table 11.
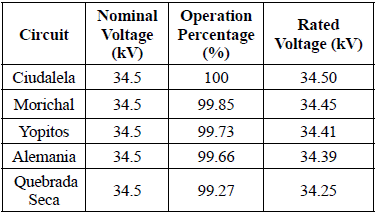
The implementation of proposals 1 and 4 would provide the system with very significant improvements to its reliability. By implementing proposal 2, the voltage regulation in the 34.5 kV circuits would improve significantly, as shown in Table 12. In addition to improving the voltage profiles, the circuit chargeability would improve to 42 %, considerably increasing the possibility to connect new loads.
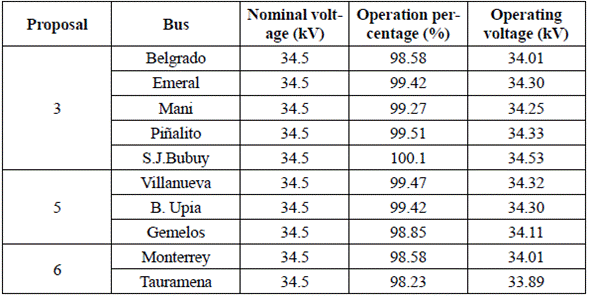
Implementation of proposal 3 would considerably improve voltage levels in the 34.5 kV substations, and they would remain within the regulation of voltage profiles, mainly in the Gemelos substation bus. By implementing proposals 5 and 6, the voltage levels at the other 34.5 kV substations would also be considerably improved. Table 13 shows the new regulation of voltage for each proposal.
In 115 kV substations, the repowering of transformers in Paz de Ariporo and Agua Clara substations is necessary as shown in Table 14. When these proposals are implemented, the ENERCA S.A. E.S.P system will significantly improve the service reliability.
VI. Other types of analyses
The simulation tool allows field engineers to envisage many operating conditions, and potential fault events under various premises such as:
- What would happen if the Monterrey circuit, which feeds two large load centers, went out of service?
- In what way the demand might be met depending on a circuit?
- How could the power be supplied in case the Morichal circuit network fails?
- How can corrective and preventive maintenance be carried out in lines and substations without taking the circuits out of service?
Multiple simulations that anticipated normal and abnormal operation conditions were performed with the purpose of creating a project bank, which can be discussed and implemented to improve service quality.
Table 15 shows another five proposals to improve the system that arose from the question "what would happen if ...?".
Currently, Enerca S.A. E.S.P. is considering the possibility of connecting the 115 kV grid with the Arauca department (230 kV grid) in a dual circuit, with Chivor Substation, or the 230 kV to Paipa Substation.
VII. Conclusions
This study highlights the importance of small and medium companies in the electrical sector that nowadays are growing, updating, modeling and performing simulation of their electrical systems. In addition, to consider multiple load scenarios and fault conditions to achieve better planning and system improvements.
It was found that in the 34.5 kV circuits, Mani circuit showed major deficiencies in voltage regulation, while the Morichal circuit was highly overloaded at peak hours, requiring the repowering of the transformers (to double their capacity) in the Paz de Ariporo and Aguaclara substations. The load flow analysis allowed the observation of the electrical system behavior under normal and contingency operating conditions, demonstrating the need to modify the TAP changer positions of the power transformers in Aguazul, Paz de Ariporo, and Aguaclara substations. In order to obtain acceptable tension levels in 34.5 kV and 13.8 kV buses, TAP was moved from 3 to 5 in 2015 and from 5 to 6 in 2016, and it will be moved from 6 to 9 in 2017.
Of the 12 proposals, ENERCA S.A. E.S.P. is developing the repowering of the 34.5 kV Ciudalela and Mani circuits. The other proposals are being technically and financially evaluated by the company. If ENERCA S.A. E.S.P. implements all the proposals, the reliability will significantly improve and new loads will be met until 2030.


