


 Inglês (pdf)
 Artigo em XML
 Referências do artigo
 Enviar este artigo por email
 Citado por SciELO
  Citado por Google
  Similares em
SciELO
Similares em
SciELO  Similares em Google
 Permalink
I. INTRODUCTION
Land use is linked to different human activities, which in turn are conditioned by a combination of biophysical and socioeconomic factors that modify ecological processes and biodiversity patterns in the terrestrial ecosystem 1. Among these activities, mining generates important changes and alterations of the landscape, especially in places with long periods of intervention 2,3. Nowadays, environmental studies focus on soil cover changes and land use, as well as on their relation with loss of habitat and biodiversity, environmental services, and the productive capacity of ecosystems 4.
Colombia has experienced, in the last decade, a significant growth in both the volume and value of production of primary goods, particularly in the mining sector, affecting positively its Gross Domestic Product-GDP 5. Since the eighties, the Bajo Cauca region has been the center of gold production in Antioquia 6. This region is one of the oldest in the department with a relatively recent colonization. National and international mining companies arrived in the late nineteenth century to exploit the gold mines, modifying the villages and occupying the territory with technological innovations for mining operations 7. Nechí, one of the municipalities in this region, has been influenced by mining, especially gold, leading to permanent gold extraction, and conditioning the local economy toward this sector that intensifies or diminishes in response to international gold prices. Mining is considered the main cause of changes in the dynamics of landscapes and degradation of vegetation cover in this municipality 7.
Remote sensing has been intensively used in environmental studies to estimate and classify land and vegetation covers from satellite imagery 8-9. The information captured by a satellite allows the identification of the spatial diversity of land uses 10. An analysis of land-use changes is fundamental to understand social, economic and environmental problems, and can be quickly implemented using cartography. Moreover, the temporal analysis of land changes, with the support of GIS and historical documents, is a fundamental tool for monitoring landscape diversity and investigating changes in vegetation 11. Nowadays, the open access to LANDSAT datasets has facilitated the analysis of forest changes at the global scale 12.
In Colombia, there is a special interest in the assessment and quantification of soil cover changes due to anthropogenic processes that impact the environment directly and indirectly 13. In 2002, IGAC-CORPOICA interpreted satellite images to determine the current use and conflicts of use in the country. Similarly, in 2010 IDEAM determined soil covers and current uses at a scale of 1:100.000, using CORINE Land Cover methodology, approved for Colombia 13. Nevertheless, in Colombia the studies aimed at determining variations in both soil cover types and land uses are still scarce.
This study evaluates and quantifies changes in soil cover in the municipality of Nechí through the analysis and processing of three LANDSAT images from 1986, 1996 and 2010. These changes are related to political, social, and economic conditions experienced in Colombia during the studied period, which conditioned the mining activities.
II. MATERIALS AND METHODS
A. Study area
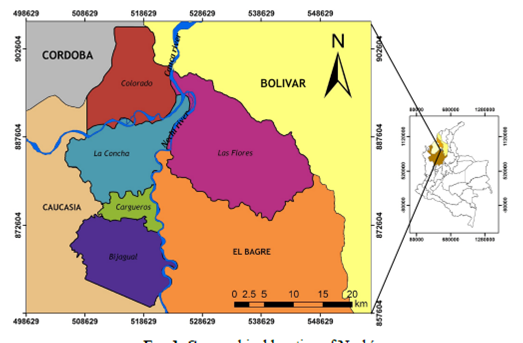
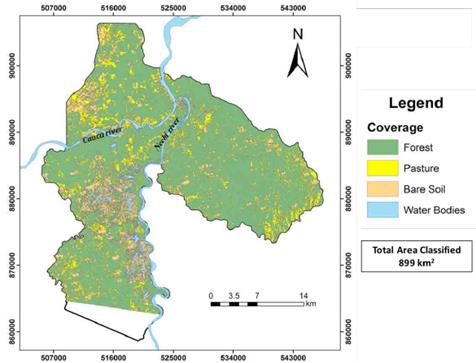
The municipality of Nechí has an area of 935.135 km2, and is located in Antioquia's northwest corner in the Bajo Cauca region, limiting to the north with both Córdoba and Bolívar departments, to the east with the municipality of El Bagre, and to the west and south with the municipality of Caucasia (Fig. 1). The main network is formed by the watersheds of the rivers Cauca and Nechí, characterized by their high flows and considerable length. The most notable geological process in this area is the lateral erosion by scouring, which affects the margin of the rivers mentioned above in some reaches. Nechí has a low, undulating topography between 30 and 600 m.a.s.l., a tropical climate with temperatures between 28 and 30 °C, and an average annual rainfall between 2000 and 4000 mm. Additionally, Nechí has great biodiversity and natural resources, which are threatened by an accelerated deterioration mainly due to human activities 7.
The main economic activities in Nechí are mining, followed by farming, fishing, agriculture, forestry, and the trade of goods. The participation by economic activities in the Bajo Cauca region, mainly Nechi, El Bagre and Zegovia, to the Departmental GPD is mining with 36.3 %, and agriculture, farming, forestry, and fishing with 1.5 % 35. Mining activities, particularly of gold and silver alluvium, are carried out without the adoption of clean development practices, which negatively impacts the environment 7.
B. Metallurgy and exploitation of alluvial gold
The alluvial gold in Nechí is extracted from the stream shores and riverbeds using dredges, bulldozers, hydraulic monitors, and wells or "apiques" 14-15. In the benefit stage, the extracted material is deposited in gutters where mercury is added. Leakage of some of the mercury generates losses of pure gold, and produces pollution and sedimentation in soil and water 16.
The lack of knowledge about the geological characteristics of the deposits in the exploitation, along with the improperly planned operation produce a considerable loss of mineral, as well as serious impacts on the environment, mainly in soil cover and water bodies 15. Soil deterioration starts right after defining the interest sites through brief prospection, when forests are cleared, and the machinery, especially dredges and bulldozers, remove topsoil and sterile covering layers of economic importance. These materials are removed without control in large areas, without techniques to properly dispose them, and eventually become sediment loads into rivers and nearby effluents 15.
The impacts on soil and vegetation include deforestation by destruction and loss of healthy vegetation, soil contamination by fuel mismanagement, changes in the landscape, and soil losses by disposition of sterile equipment in the vicinity of the extraction sites and gutters 17. Although measures such as reforestation programs have been carried out to remediate the impacts on the ecosystems in the municipality of Nechí, these measures have not been sufficient, and the current situation shows a loss of forests and an increase in eroded soils.
C. Landsat satellite images
The primary information used in this research comes from three Landsat 7 ETM+ images of the study area. These images cover a period of 24 years (1986, 1996 and 2010), and are available at the Glovis website of the United States Geological Survey USGS. Each Landsat image is composed of seven bands, representing portions of the spectral range. The Landsat satellite has a cycle of 16 days, which means that Colombia is covered 22 times a year on average. The three images were chosen based on their quality, that is, with a mean percentage of cloud cover of zero, and with a time span that allows the analysis of land cover changes that may be related to historical, political, social, and economic conditions in Colombia.
D. Landsat imagery processing
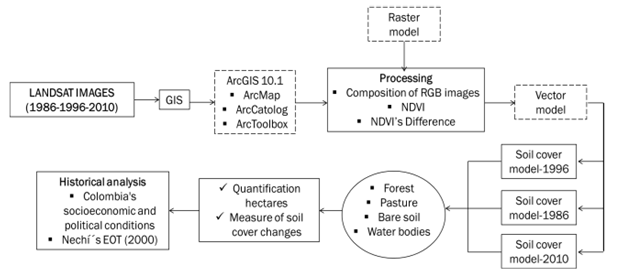
The methodology used in this study is shown in Figure 2. The images were processed in ArcGIS10.1, using Arc Map, Arc Toolbox, and Arc Catalog modules. Initially, bands were combined to extract and emphasize the information contained on each satellite raster image, based on spectral responses of the Earth's surface objects. A visual analysis was performed combining three information bands of each satellite image (e.g., 4-3-2, 5-4-3, 3-21, and others) to form false and true color images with the Red Green Blue-RGB channels 18. The color combinations are used to discriminate aspects represented by the image, such as geology, land use, urban morphology, surface water, eroded areas, vigorous vegetation, and transition zones, among others 19. These combinations allowed the identification of soil cover types in the study area.
Subsequently, the Normalized Difference Vegetation Index (NDVI) was calculated on each image, in order to examine the density and intensity of green vegetation growth using the spectral reflectivity of solar radiation. This index uses the contrast of two bands of a satellite image: band 3 or visible red band, and band 4 or near infrared band. Healthy vegetation absorbs most of the visible light, and reflects a large part of the near infrared light. In contrast, unhealthy or sparse vegetation reflects more visible light and less near-infrared light 20. The NDVI is calculated by Equation (1) 20:

where R and IR represent bands 3 and 4, respectively. The NDVI is provided as a raster image with each pixel varying between -1 and +1. Values near zero indicate lack of green vegetation, values equal to zero mean absence of vegetation, and values close to one indicate the strongest vigorous vegetation density.
We calculated the NDVI differences between 1986 and 2010 to determine vegetation changes in the study area, and considered the change to be an improvement if vegetation was stronger or greener, or a depletion if vegetation was less vigorous or dry. The difference between NDVIs was calculated by Equation (2) 21:
where NDVI19A6 and NDVI2Q\Q correspond to the NDVI from 1986 and 2010, respectively. The raster was classified and organized into classes to describe the changes in vegetation. The values of each class were defined based on the spectral response of the different types of vegetation due to chlorophyll content. A conventional way of representing the differences in vegetation with the limits of spectral response was implemented in order to show the change in vegetation 21-22.
After considering different band combinations, we identified four soil cover types: Forest, Pasture, Bare Soil, and Water Bodies (surface). We extracted these soil cover types as vector images from the difference of NDVIs, and used them to quantify the hectares and analyze soil cover maps and directions of vegetation changes in the 1986, 1996 and 2010 images.
E. Historical analysis
We reviewed the literature on the main historical facts related to the social and political economic conditions in Colombia during the period of study, 1986-2010, associated with the periods of the "gold rush", when the international price of this commodity rose, and whole type of mining exploitation become profitable.
III. RESULTS AND DISCUSSION
The reclassified total area for the municipality of Nechí was calculated in 899, 898 and 897.8 km2 in 1986, 1996 and 2010, respectively. These differences in the area are attributed to processing, since the Landsat images miss a small portion of the municipality's surface. Similarly, these values also differ from the territorial extension of Nechí. After analyzing Landsat images based on the NDVI, a vector representation of the spatial component of the information contained in this index was performed. Vector format consists of three elements: points, lines and polygons. Polygons were extracted to quantify land cover changes over the three images. Similarly, historical events associated with political, social, and economic conditions experienced in Colombia at each period were presented.
A. Colombia's socioeconomic and political conditions
During the 1980s, Latin America experienced the crisis of "the lost decade", characterized by declines in per capita GDP, growing inequality in income distribution, and increased poverty levels, among others. Despite the crisis, Colombia performed better than other countries due to a prudent management of external debt in previous years, in addition to good macroeconomic management 23. Between the mid-80s and mid-90s, the country adopted reforms toward an open trade liberalization of the economy to international markets, despite the limitations in existing infrastructure. The economic growth at the time was based mostly on primary goods from agriculture, manufacturing, and largely the exploitation of oil, coal and ferronickel. From then on, mining continued growing. In Nechí, gold exploitation increased between 1985 and 1990, becoming the main economic base of the municipality 7. A period of recovery in 1986 was driven by a phase of higher growth in mining exports in Colombian history.
Subsequently, the growth of the mining sector was starred in the Colombian economy. During the second half of the 1990s, the mining sector grew at an average annual rate of 4.8 %, becoming fundamental for the Colombian economy, contributing to the production of goods, services, and exports, as well as generating tax revenues at national and local levels. Even though mining has a small contribution to GDP, it maintained a positive trend since the 1980s. The mining GDP, including hydrocarbons, grew from 1.5 % in 1980 to 4.8 % in 1999, with a positive rate of incremental growth 24.
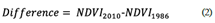
Between 2009 and 2010, Colombia underwent changes in its economy due to the global economic crisis. The good performance of various economic sectors in the country allowed a fast economy recovery. The most outstanding sector was the mining industry, which had a significant growth of 11.1 %, based on the increased production of oil, natural gas, and minerals, such as gold, coal, silver, and nickel 25-26, as a response to increasing international ore prices. Figure 3 shows the mining titles in the department of Antioquia, and the relationship of some of the largest gold mining projects in 2010 27.
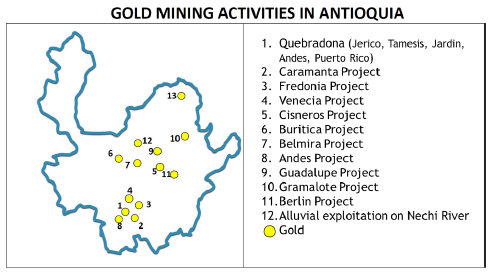
Fig. 3 Map of gold mining titles and megaprojects of mining companies in antioquia, colombia. Adapted from 27.
B. Soil coverage and NDVI analysis
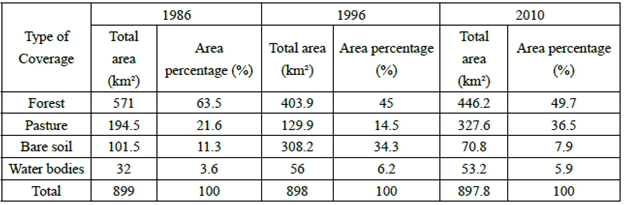
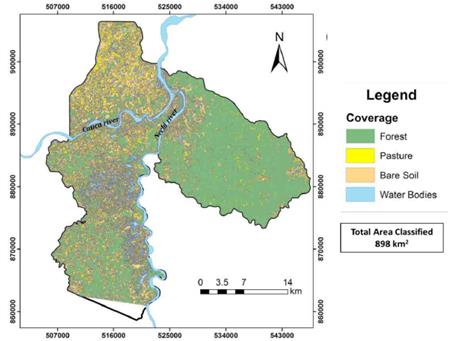
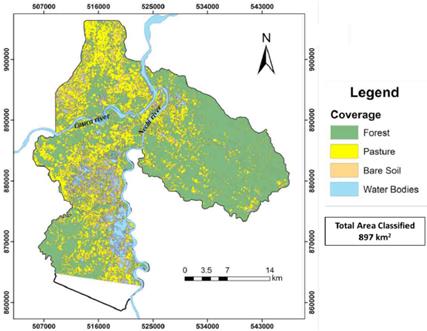
Table 1 summarizes the areas corresponding to the four types of coverage obtained after the spatial analysis of NDVI from each studied year. An atmospheric correction was carried out due to the presence of clouds in some parts of the images from 1996 and 2010. This correction consists in subtracting the cloudy areas from the total amount of the other types of coverage. Figures 4, 5 and 6 show the land cover maps of 1986, 1996 and 2010, respectively.
C. NDVI differences between 1986 and 2010
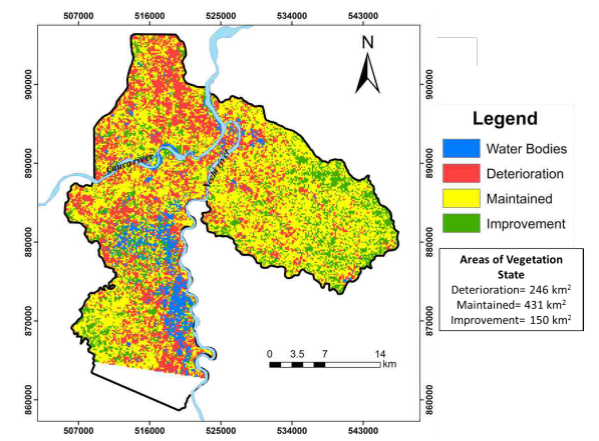
We classified the changes in vegetation cover over 24 years in the studied area based on the land cover maps of 1986 and 2010 under three categories proposed by 21 (Fig. 4 and 6): deteriorated condition of soil cover, maintained condition, and improved condition. Table 2 summarizes the areas where these categories were identified.
Table 2 Areas of vegetation states between 1986 and 2010
| Vegetation state | Total area (km2) | Area percentage (%) |
| Deterioration | 246 | 29.8 |
| Maintained | 431 | 52.1 |
| Improvement | 150 | 18.1 |
| Total | 827* | 100 |
*The total does not consider the areas occupied by of vegetation cover remained stable without any water bodies on 1986 and 2010. disturbance or affectation, whereas 246 km2 (29.8 %)
deteriorated with vegetation losing vigor, and only According to the vegetation changes observed in 150 km2 (18.1 %) of vegetation improved (Fig. 7). Nechí during the studied period, 431 km2 (51.2 %)
D. Analysis of soil cover changes
Soil cover maps show that the east side of Nechí has preserved the forest cover, since this part is within the area of jurisdiction of the Serranía de San Lucas, a forest reserve that has been recommended for protection due to high levels of endemism 28-29. According to Figure 7, most of this area has remained unaltered, and even a small extension has improved. In contrast, deterioration is observed in the area surrounding the Nechí River due to the development of alluvial mining in the Complejo Cenagoso El Sapo 7. Marked changes in land cover are perceived at southwestern Nechí, characterized by a sudden increase of bare soil and pastures between 1986 and 1996. A significant increase in pastures is also noticeable by 2010. Most areas considered deteriorated are also located in this part of the municipality (Fig. 7). An increase in water bodies occurs in areas bordering the Nechí River, a zone with permanent presence of alluvial gold mining.
Over the 24-year period, there have been significant changes in land cover (Table 3). Forests lost nearly 22 % of coverage, while pasture advanced by 68 %. Surprisingly, the amount of bare soil resulted from erosion processes, loss of vegetation cover, and possibly gold mining was reduced by 30 %. According to the results, it is possible to establish a relationship between livestock and the effects of mining in Nechí. The increase in livestock exploitation in Nechí has become an important factor, not only for the economy of the municipality but also for the Bajo Cauca region; this growth can be associated with the increased pasture cover observed from imagery analysis, since this type of soil cover has an average load capacity of 1.3 animals per hectare, fostering the production, commercialization, and distribution of bovine products in areas where native pastures predominate 7. In the case of water bodies, there was an increase of 66 %, which may be related to the type of exploitation of gold, which consists of dredging of the ground by hydraulic monitors and the flow toward a gravity separation structure or pits made on land to remove metals. Furthermore, in the amalgamation process, mercury is added directly to the excavation pit, and the gold is recovered by the movement and transportation of the load. Water quality is affected by discharges of toxic substances, such as cyanide and heavy metals (copper, silver, nickel, lead, and zinc, among others), which are accumulated and then deposited in bottom sediments 16. In the Bajo Cauca region, reforestation projects have been developed over the studied period. As a result, they may have influenced an apparent recovery of the vegetation 30. The abandonment of old gold mining quarries may also explain part of this recovery. Moreover, it is necessary to consider the climatic conditions during the studied years; "El Niño" and "La Niña" conditions occurred over the 24 years of study, with "La Niña" influencing the weather in 1996 and 2010 with conditions of weak and moderate intensity, respectively 31. This is a cool phase characterized by strong rain in the region. Therefore, the climate may have influenced the presence of ponds and flooded areas in the soil cover changes.
Table 3 Evolution of land coverages in the municipality of Nechí between 1986 and 2010
| Type of coverage | Area in 1986 (km?) | Area in 2010 (km2) | Area change (krtf) | % Loss or Gain | |
| Forest | 571.0 | 446.2 | -124.8 | -21.9 | |
| Pastures | 194.5 | 327.6 | 133.1 | 68.4 | |
| Bare soil | 101.5 | 70.8 | -30.7 | -30.2 | |
| Water bodies | 32.0 | 53.2 | 21.2 | 66.3 | |
| Total area | 899.00 | 897.8 |
An average annual production of more than 10,000 kg of gold was registered in Antioquia between 2007 and 2011, which represents approximately 49.96 % of the average annual national production. For 2011, the production percentage of alluvial and "filon" gold in Antioquia was 73 % and 27 %, respectively 16. Table 4 shows the amounts of gold produced by different departments between 2002 and 2010.
Gold mining activities lead the mining sector in Antioquia, with their participation threefold in the department's economy increasing from 0.5 % of the departmental GDP in 2000 to 1.4 % by the end of 2012. Furthermore, this growth is also reflected in the national economy, since gold production in Antioquia increased from 0.07 % of nation's GDP in 2000 to 0.18 % in 2012 32.
Table 4 Annual gold production (kg) by Colombian administrative departments (2002-2010)
| Year | Antioquia | Bolívar | Caldas | Cauca | Chocó | Córdoba |
| 2002 | 10,998.19 | 1,869.41 | 795.65 | 390.68 | 605.89 | 5,485.86 |
| 2003 | 27,071.63 | 6,874.91 | 1,099.21 | 446.27 | 1,204.04 | 8,211.74 |
| 2004 | 22,878.73 | 2,949.13 | 1,331.26 | 361.16 | 851.17 | 7,226.60 |
| 2005 | 22,376.18 | 4,194.28 | 2,013.33 | 349.86 | 1,882.35 | 3,720.74 |
| 2006 | 10,724.24 | 991.13 | 1,416.57 | 281.4 | 1,192.29 | 462.02 |
| 2007 | 11,414.18 | 417.27 | 1,120.85 | 350.69 | 1,589.95 | 14.26 |
| 2008 | 25,995.60 | 2,389.82 | 1,080.28 | 621.54 | 3,340.44 | 82.02 |
| 2009 | 28,027.85 | 3,431.14 | 1,217.53 | 2,316.77 | 10,847.19 | 454.79 |
| 2010 | 18,898.47 | 5,763.72 | 1,200.49 | 1,036.72 | 24,529.71 | 638.22 |
Source: adapted from 16
In 2011, the gold production in Antioquia increased in 258 kg compared to the previous year; the total gold production of the department was 19,156 kg, which came from the municipalities of Taraza (4,812 kg), El Bagre (2,997 kg), Cañasgordas (1,771 kg), Nechí (1,619 kg), Remedios (1,329 kg), Zaragoza (1,143 kg), Segovia (1,409 kg), Caucasia (1,232 kg), and Angostura (1,214 kg) 33.
Table 5 shows the volume of annual gold production in kg in Nechí and Antioquia between 2001 and 2010. An increase in gold extraction is observed in 2004, 2009 and 2010. Figure 8 shows the gold annual production in Nechí, and the percentage contribution of production in Nechí to the total production of the department of Antioquia. In 2010, Nechí made the greatest gold contribution to the total gold production in Antioquia, with 12 %.
Table 5 Gold annual production in Nechí and Antioquia
| Year | Nechí (kg) | Antioquia (kg) |
| 2001 | 3.85 | 10021.99 |
| 2002 | 4.93 | 10998.19 |
| 2003 | 4.48 | 27071.63 |
| 2004 | 1698.18 | 22878.73 |
| 2005 | 516.24 | 22376.18 |
| 2006 | 3.02 | 10724.24 |
| 2007 | 160.64 | 11414.18 |
| 2008 | 642.61 | 25995.6 |
| 2009 | 1780.88 | 28027.85 |
| 2010 | 2314.83 | 18898.47 |
Source: adapted from 34
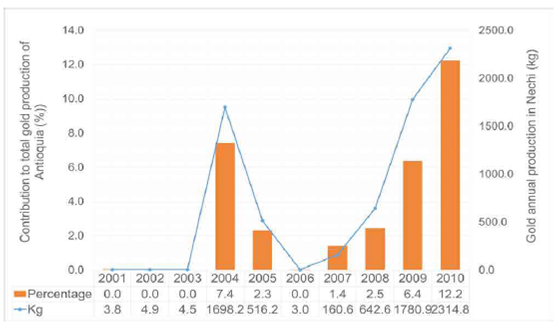
Fig. 8 Annual gold production in Nechí and its contribution to the total production of Antioquia. Adapted from 34.
Several studies 11,35-40 have confirmed the usefulness of classifying and extracting features from remote sensing products related to soil cover. The spatial and temporal information contained on NDVI about vegetation growth represent helpful complementary data for land cover classification. Furthermore, the process of land use and soil cover change in mining regions can be evaluated and quantified by the use of remote sensing information in a time series trend analysis. Finally, historical baselines of forest cover based on management and planning territory studies are needed to analyze the changes and to assess the effectiveness of land-use policies.
IV. CONCLUSIVE REMARKS REFERENCES
Colombia's mining potential is characterized by the presence of geological conditions that favor the location of highly valued mineral deposits. Historically, the Bajo Cauca region has represented a strategic point for mining activities. Gold mining in particular plays a crucial role in Nechí's economy. Nevertheless, the inappropriate use of mining extraction techniques has generated negative impacts on biotic components, mainly affecting vegetation, water, and soil. The environmental degradation suffered by the soil cover in Nechí can be observed over time, partly due to development of mining in the area. Other economic activities widely exercised in the region, such as livestock and mining, coupled with the lack of control and weak law enforcement, greatly impact soil covers.
Land cover changes are related to socioeconomic conditions prevalent in each studied year. Since 2000, mining has had a remarkable participation in the Colombian economy. Statistics show the continuous growth of exploitation and production of gold and other metals. Antioquia is one of the departments in which further exploitation of gold has been carried out, being gold the main ore product in this region. In 2010, Nechí was the municipality of Antioquia with the highest number of gold mining projects (13 in total), becoming the greatest contributor to the total gold production in Antioquia. Despite the difficulties and economic setbacks linked to the global crisis, the mining sector always remained on the rise during the analyzed period due to the continuous demand for gold. Associated with that production, the images showed areas, especially in southwestern Nechí, where environmental conditions have been degraded in both the soil and the Cauca River margins. Despite this extended degradation, the eastern areas showed a steady condition, and even a slight improvement associated with the definition of a forest reserve.

