


 English (pdf)
 Article in xml format
 Article references
 Send this article by e-mail
 Cited by SciELO
  Cited by Google
  Similars in
SciELO
Similars in
SciELO  Similars in Google
 Permalink
I. INTRODUCTION
The need of using technology to increase energy efficiency in industrial processes and apply energy savings techniques to decrease production costs throughout the entire industry is currently a topic of great importance [1]. Reducing production costs improves the profitability of companies [2]; therefore, techniques for increasing efficiency and energy savings are not only employed or demanded by industries that produce goods [3], but also by companies that offer different types of services [4].
Applying energy savings strategies such as motion detectors, infra-red technology, operating time programs, energy-efficient lighting, fuel changes, burner changes, modernized auxiliary equipment, and renovated equipment, among others is fundamental to bring about significant savings, mainly in thermal and electrical energy bills. However, other alternatives can be studied and applied; for example, using different energy generation schemes by implementing power cycles and systems [5].
Companies aim at becoming more competitive in the international market with energy savings and increased energy efficiency, which create a demand for better quality products at lower costs on an increasing basis. Therefore, applying these engineering techniques, seek to obtain an economic and ecological benefit with high operational functionality that minimizes the risks for personnel.
Here, we present the results from a case study conducted in a warehouse with the aim of offering an energy solution or alternative [6]. To conduct this study, we measured, in the field and with specialized instruments, the energy consumption of the auxiliary process equipment, and checked the operation and performance of air-conditioning and lighting equipment. The objective was to understand the equipment operation and performance to quantify their impact on energy costs, and hence, create a proposal for increasing energy efficiency that would result in economic savings.
II. METHODOLOGY
The warehouse historical monthly energy consumption records were gathered from at least 12 months of bills issued by the Mexico's Federal Electricity Commission (Comisión Federal de Electricidad, CFE). This guaranteed that the data used in the analysis were real and objective. The data included the rate type, the connected load (CC, for its initials in Spanish), the contract demand (DC, for its initials in Spanish), the maximum demands, the billable demand (DF, for its initials in Spanish), the power factor (FP, for its initials in Spanish), the load factor (FC, for its initials in Spanish), the consumption per period, and in total, the average price of the energy consumed (Pm, for its initials in Spanish) and the discounts or penalties according to the power factor, among others (www.cfe.gob.mx), as well as the consumption of water and fuel.
Technical visits to each area and department of the warehouse were conducted to develop a detailed field survey. The survey included identifying all types of tubing (water, fuel, air-conditioning, etc.) and the type and quantity of lights, as well as gathering technical plate information from all the operating equipment and recording their physical operating parameters (e.g., temperature, pressure, capacity, flow, electrical parameters). Likewise, operators were visited to collect variables that could not be obtained directly from physical measurements, such as usage habits, maintenance hours, and considerations beyond maintenance controls, among others. This information was used to identify various opportunities for increasing efficiency and saving energy and improving operating programs and maintenance with the systems and equipment [7].
III. RESULTS
From the field surveys, we found that implementing a cogeneration system in the warehouse represents a savings opportunity [8,9]. This system would operate with a motor generator to produce electrical energy and an absorption cooling system to provide air-conditioning [10,11]. The current energy performance conditions of the entire warehouse are described below.
A. Current situation
The plant has a contract with CFE for a mediumvoltage rate (HM) with a supply of 13,200 V. It has two 350 kW generators, which generate electrical energy during peak hours and serve as backup equipment in case of outages. Table 1 shows the electrical energy consumption and maximum demands of the studied plant.
TABLE 1 ELECTRICITY CONSUMPTION AND DEMANDS
| Demand (kW) | Consumption (kWh) | |||||||
|---|---|---|---|---|---|---|---|---|
| Month | Base | Intermediate | Peak | Billable | Base | Intermediate | Peak | Total |
| January | 465 | 484 | 400 | 426 | 56,794 | 127,546 | 31,600 | 215,940 |
| February | 466 | 444 | 404 | 420 | 51,498 | 117,076 | 29,592 | 198,166 |
| March | 473 | 507 | 475 | 485 | 55,370 | 125,421 | 31,373 | 212,164 |
| April | 594 | 497 | 546 | 554 | 55,958 | 135,941 | 54,838 | 246,737 |
| May | 621 | 519 | 569 | 577 | 71,170 | 149,416 | 27,558 | 248,144 |
| June | 642 | 547 | 494 | 525 | 108,011 | 120,388 | 13,258 | 241,658 |
| July | 635 | 512 | 565 | 576 | 64,651 | 165,645 | 27,116 | 257,412 |
| August | 620 | 495 | 548 | 560 | 70,316 | 160,207 | 26,272 | 256,795 |
| September | 583 | 515 | 564 | 567 | 65,022 | 150,573 | 26,474 | 242,070 |
| October | 604 | 470 | 519 | 532 | 61,034 | 136,102 | 53,500 | 250,636 |
| November | 498 | 567 | 439 | 478 | 54,874 | 134,521 | 33,677 | 223,072 |
| December | 429 | 521 | 413 | 446 | 49,695 | 140,200 | 34,741 | 224,636 |
| Minimum | 429 | 444 | 400 | 420 | 49,695 | 117,076 | 13,258 | 198,166 |
| Maximum | 642 | 567 | 569 | 577 | 108,011 | 165,645 | 54,838 | 257,412 |
| Average | 553 | 506 | 495 | 512 | 63,699 | 138,586 | 32,500 | 234,786 |
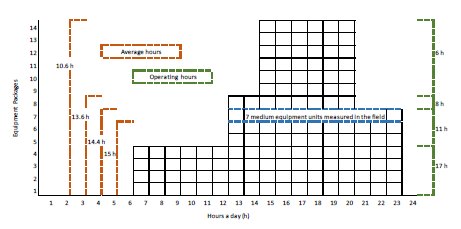
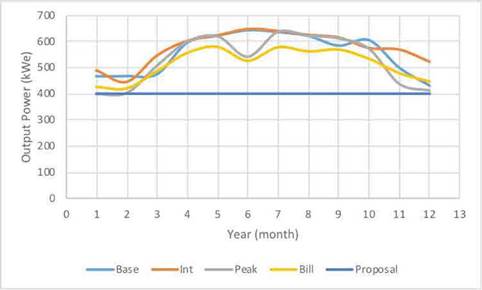
The plant also has 14 package units of 25 tons of refrigeration (TR) each that supply air-conditioning to the entire warehouse; this is mainly used during summer when ambient temperatures increase. This equipment is activated in staggered phases throughout the day. The first four equipment packages are activated at 6:00 a.m., then, four more are activated at 12 p.m., and the six remaining are turned on at 2:00 p.m. Seven of them are turned off at 8:00 p.m., and the rest, at 11:00 p.m. (Fig. 1). This takes place during the eight-month season that is considered to have high ambient temperatures, which lasts from March to October. All the equipment operates for an average of 10.6 hours a day; however, the first four equipment units operate a total of 17 hours a day, experiencing greater wear, which reduces their lifespan compared to the rest of the equipment. Regarding the lights, the evaluation showed that they are in good condition and do not need changes or modifications.
The air-conditioning equipment is distributed throughout the entire area of the warehouse, offering adequate comfort. The operation of the first seven air conditioning units was measured in the field (Table 2 and Fig. 2); subsequently, this information was used for extrapolating energy consumption for the rest of the equipment packages. The first seven equipment packages that are turned on during the day are used 75% more than the others.
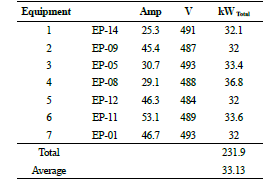
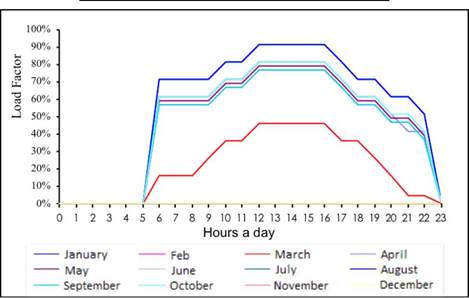
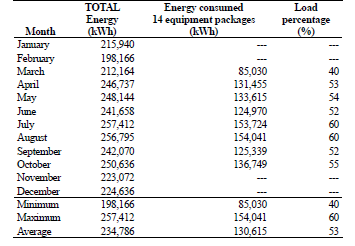
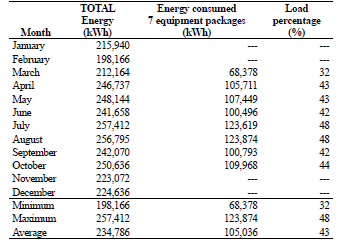
Table 3 reports the total consumption of the 14 equipment packages and their load percentage, in relation to the total consumption of the warehouse. Moreover, Table 4 shows that the consumption of the first seven equipment units that are turned on (the ones monitored in the field) represent approximately 80% of the energy consumption of all the air conditioning equipment.
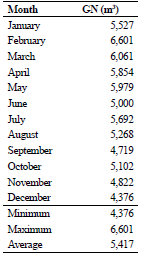
The studied company uses natural gas, with an rates average calorific value of 36,421 kJ m-3 and a supply pressure of 2 kg cm-2. Natural gas is used at these in different areas of the warehouse (Table 5).
B. Proposal
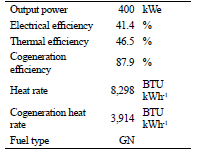
The proposal entails generating electrical energy with a motor generator powered by natural gas (Tables 6 and 7) and, at the same time, using the residual heat from gas exhaust and exhaust sleeves to produce air-conditioning with an absorption cooling system of lithium bromide-water (H2O-LiBr) as a working fluid, presenting a cooling capacity of 75 TR (commercial equipment).
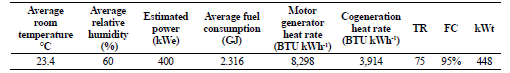
The amount of available residual heat is 448 thermal kW. This power is reduced when considering the cooling coefficient performance (COP) of the absorption system (0.6 in this case), which will help substituting three equipment packages.
The system will require a new supply system of ice water to provide air-conditioning through a blower coil, which will substitute the three equipment packages of 25 TR each. To achieve this, it will be necessary to install ice water pumps, a condensing system, and a cooling tower. The three equipment packages to be substituted are three of the first four units that are turned on at 6:00 a.m. and turned off at 11:00 p.m. every day during the eight months that the warehouse uses air-conditioning.
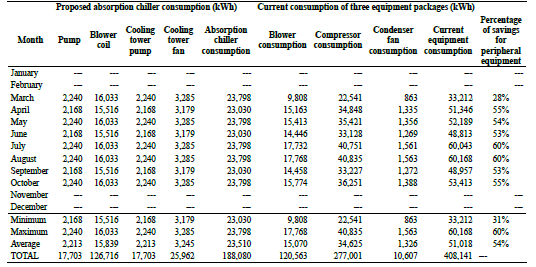
By implementing this cogeneration system, an average monthly electrical energy savings of 234,786 kWh will be achieved with the additional benefit of 29,804 kWh in surplus energy per month, which could be exported at the DAC rate at the cost of 10% less than its billing price. In addition, an average monthly savings of 372 kW for billable demand would be obtained (Fig. 3). Concurrently, there will be a 155 m3 increase of ice water in the cooling tower per month with the installation of the absorption chiller. Table 8 shows the peripheral equipment consumption for each air-conditioning system along with the savings that would be gained thanks to the change in technology.
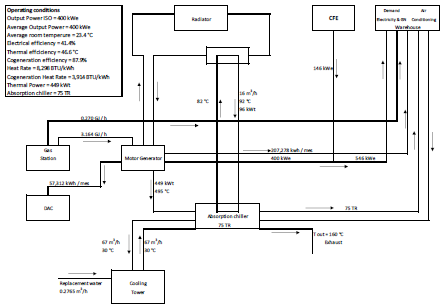
The final evaluation considered the complete installation of the cogeneration system, which includes the motor generator, the ice water and condensed water pumping, the transfer tables, and the booths. Water from the powering system and replacement water will be used for evaporation in the cooling tower. A thorough civil engineering project is being contemplated to install the main and peripheral equipment, including the labor needed to position the tables, the generator equipment, and the air-conditioning equipment, and to remove the existing equipment. Also, adaptations and installations for supplying natural gas to the new generator equipment have been contemplated. Fig. 4 shows the conceptual arrangement of the proposed cogeneration system.
Regarding the energetic performance of the motor generator, it was observed that the total energy produced per year is higher than the energy that is currently consumed (Table 9). However, the demands (base, intermediate, and peak) of the warehouse (kWe) are higher than the installed capacity that has been proposed (Table 10). In this case, the lacking demand would be supplied by CFE.
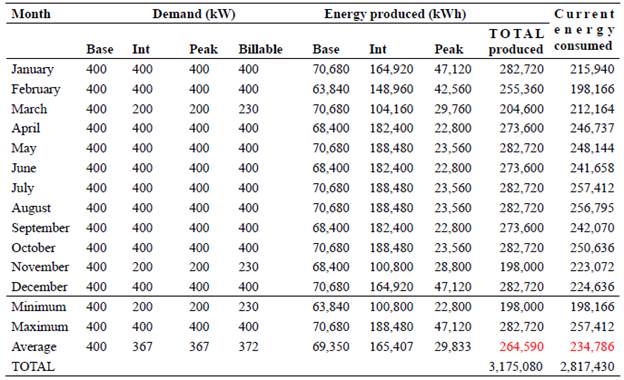
TABLE 10 ENERGY AND DEMAND ASSESSMENT Demand (kW) Energy produced (kWh)
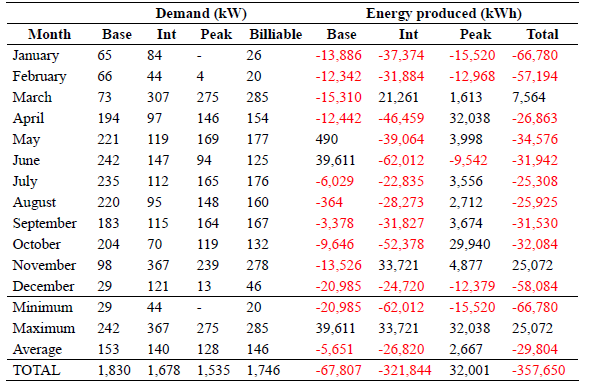
Note: The negative red numbers indicate energy surpluses.
The calculation of the new billable demand (DF, for its initials in Spanish) was obtained using expression (1):

where:
DP is the average maximum demand during the peak period
DI is the average maximum demand during the intermediate period
DB is the average maximum demand during the base period
DPI is the average maximum demand during the peak and intermediate periods
FRI and FRB are reduction factors with values of 0.150 and 0.300, respectively
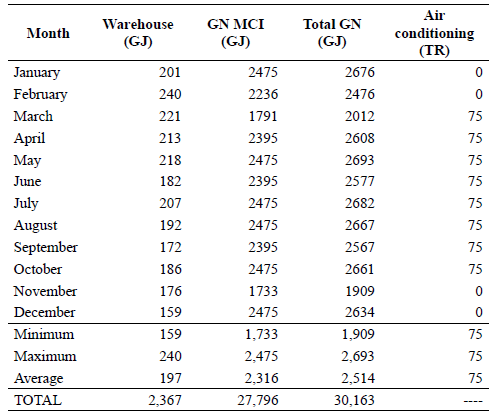
Table 11 summarizes the warehouse potential consumption of natural gas, including the consumption of the proposed motor generator.
C. Simple cost-benefit analysis
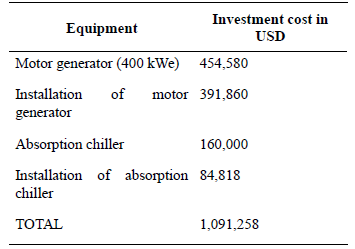
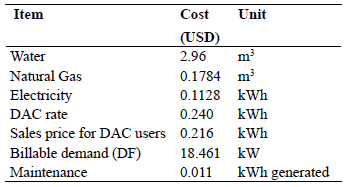
Based on the knowledge of current savings and consumption, a simple cost-benefit analysis was carried out for the period of the technical-financial proposal. To do this, it was necessary to identify the market prices of the different equipment and categories considered for this project (Table 12), including the cost of the equipment units and their complete installation. The latter entails interconnections, auxiliary equipment, adaptations, the civil engineering project, maneuvering, installation, and implementation. The average prices of consumables, the DAC rate, and the maintenance costs per kilowatt generated were also considered (Table 13).
When assessing the consumption and savings according to the proposal, we considered the increase in water consumption (459 USD per month) and natural gas (11,350 USD per month). Furthermore, changing air-conditioning technology generates savings in energy consumption (27,508 kWh per month), which should be added to the surplus of electrical energy (29,804 kWh per month). The per item DF savings should be considered as the average monthly capacity of the motor generator (372 kW), with an average remaining billable demand deficit of 146 kW per month to be paid (Table 14).
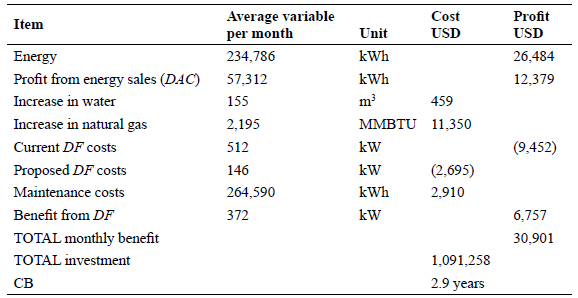
The investment payback period for this project is 2.9 years, which makes it an attractive project with outstanding advantages that benefit the company performance directly regardless of the CFE rates. Likewise, it guarantees the quality of energy inside the warehouse, thus promoting energy savings.
This project could cover 100% of the electrical energy that is consumed by the warehouse (207,278 kWh month-1), in addition to transporting 57,312 kWh per month at a rate of 10% below the DAC cost. Three air-conditioning equipment packages would be substituted by an absorption chiller, which consumes 54% less electrical energy.
IV. CONCLUSION
The proposed cogeneration system conformed of a motor generator and an absorption cooling equipment proved to be an adequate, viable, and technically feasible option for a warehouse. Moreover, the investment payback period for this project is very attractive, as the total cost of the project would be covered in less than three years, including maintenance costs. The cogeneration systems can be applied to both large or industrial companies that have significant levels of electrical and thermal energy consumption, and to small service-provider companies -as was demonstrated-, as long as they have the necessary primary inputs.
Nomenclature
CC Connected load (kW)
DF Billable demand (KW)
FP Power factor (%)
FC Load factor (%)
TR Tons of refrigeration
COP Coefficient of performance
T Temperature (°C)
GN Natural gas
GJ Giga Joules
DC Contract demand (kW)
CB Investment payback period (years)
DAC High domestic consumption rate ($ kWh-1)
CFE Comisión Federal de Electricidad
MCI Motor generador
kWe Electric kilowatt
kWt Thermal kilowatt
USD American dollar

