


 English (pdf)
 Article in xml format
 Article references
 Send this article by e-mail
 Cited by SciELO
  Cited by Google
  Similars in
SciELO
Similars in
SciELO  Similars in Google
 Permalink
I. Introduction
All fuels, except pure hydrogen, produce NOx, SOx, CO2, and other pollutants during combustion, whose impacts on environmental sustainability and public health remain a worldwide persistent problem [1] . To combat this, Colombia recently signed a commitment to reduce CO2 emissions by 20 % and implement strategies to optimize energy efficiency, technology transfer, and fuel substitution with renewable resources [2] . Biomass and biomass blended with fossil fuels are feasible substitutes for thermal generation with existing combustion systems. Biomass CO2 emissions are considered nearly neutral through the carbon cycle [3,4,5] and can greatly reduce environmental impact compared with coal [6, 7] . One promising pathway for utilizing biomass is to produce syngas through gasification [8,9,10] . As reviewed by Emami-Taba et al. [11] , many studies have found that co-gasification technologies with blends of coal and biomass can greatly enhance the quality and composition of syngas. Chenopodium album, sometimes called lambsquarters, pigweed, melde, goosefoot or fat hen, is an herbaceous biomass classified as a weedy undergrowth that competes with food crops for water, sunlight, space, and soil nutrients [12] . This biomass has the potential to replace wood for co-gasification, whose cultivation cycle requires 15 to 20 years in specific terrains and climates. Chenopodium album is suitable from 0 to 3600 meters above sea level in latitudes from 70° N to over 50° S. It is also tolerant of a wide range of cultivating conditions, climates, soil fertility, and pH [13 , 14 , 15] .
To understand the energy production potential of using Chenopodium album, a process evaluation can be performed. For example, Runsheng et al. [16] determined thermal reaction characteristics in charcoal briquettes with iron ore, analyzing the mass loss and the reaction speed of the samples as a function of temperature by the thermal analysis method [16] . Results showed two significant changes in the conversion of the briquettes: at 450 °C it is reduced with respect to the coal, while at 1030 °C the conversion increases. These types of problems can be understood with a Gibbs free energy thermodynamic analysis to confirm the composition and degree of spontaneity of the chemical reactions. Ganesh et al.[17] performed a thermodynamic study of the combined carbon gasification process using the Lagrange multiplier method and the Gibbs free energy minimization algorithm. These investigations show that Gibbs energy- minimization can be used to optimize the efficiency of gasification processes, as well as identify advantages of various feed mixtures and reactor operating conditions and configurations. This work presents an experimental analysis of co-gasification of a coal-biomass agglomerated with a paraffin binder under fixed bed reactor conditions compared with gasification of pure coal and pure biomass. The equilibrium compositions of the system are calculated using the Gibbs free energy minimization method. Experiments were performed in a thermogravimetric analyzer with a gas chromatography system to evaluate the efficiency of the process, identify synergistic conditions, and compare gas compositions to model predictions.
II. Methodology
A. Fuels
The fuels used were sub-bituminous coal type A (P1) biomass of Chenopodium album (P2) and coal-biomass mixtures in 3:1 ratio (P3). The characterization of coal, biomass, coal-biomass mixture and paraffin was done according to standard procedures as reported in Table 1.
Table 1. Physicochemical characterization of fuelsM, residual moisture; VM, volatile matter; FC, fixed carbon; ST, Total sulfur; DAF, Dry Ash Free; HHV: High Heating Value. *calculated by difference, b.d.
| Sample | Proximate analysis (wt. %) | Ultimate analysis (wt. %, DAF basis) | HHV (cal/g) | ||||||||
| M | Ash | VM | FC* | C | H | N | O* | ST | |||
| Coal (P1) | 7.32 | 14.86 | 41.07 | 36.75 | 70.44 | 5.49 | 1.60 | 20.14 | 2.32 | 5920.0 | |
| Biomass (P2) | 5.50 | 1.48 | 73.63 | 19.39 | 45.61 | 5.59 | 4.43 | 44.06 | 0.31 | 3717.4 | |
| 3:1 Mixture (P3) | 7.20 | 11.72 | 48.00 | 33.08 | 64.69 | 5.54 | 2.43 | 25.67 | 1.67 | 5171.1 | |
| Paraffin | - | - | - | 5.23 | 85.23 | - | 14.77 | - | 10994.0 | ||
| ASTM method | D3173 | D3174 | D3175 | b.d. | D5373 | b.d. | D3177 | D5865 | |||
Cellulose and lignin contents in the biomass were determined following Tappi T203Cm99 and T222Os83 standards procedures in a Genesys 10S UV-VIS spectrophotometer. The samples were analyzed in a Panalytical Mini pal 2 and in a SEM-CARL ZEISS EVO/MA10, as shown in Table 2.
B. Experimental procedure
The fuels were gasified in a thermogravimetric analyzer. The gasification tests were carried out on a Linseis Thermobalance, Model STA PT 1600, with L75/220 furnace, applying temperature ramps of 40 °C/min, between 25 and 700 °C in nitrogen atmosphere (20 ml/min), and of 20 °C/min between 700 and 950 °C, injecting 2.0 ml/min of air as a gasifying agent, with an air/fuel ratio (ER) of 0.4; this condition was maintained at 950 °C for 40 minutes. For each test, gas samples were analyzed at 750, 850 and 950 °C; then one sample every 20 minutes during the isothermal period. All experimental tests were carried out at least twice in each case. In Figure 1 the schematic of assembly of equipment for conducting the tests is presented [18] .
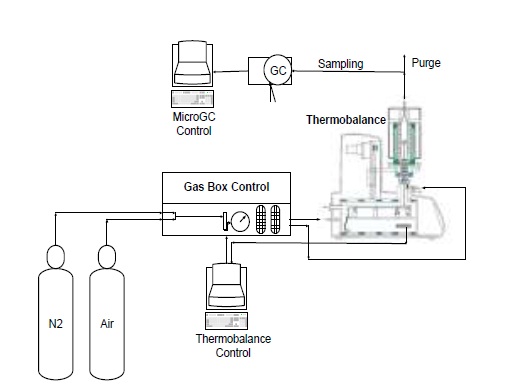
The composition of the gas products was determined with an Agilent 3000A MicroGC chromatograph, which has two thermal conductivity detectors (TCD) and a 5Å molecular sieve column with 10m x 0.32mm using Ar as carrier gas and a Plot U capillary column, with 8m x 0.32mm using He as carrier gas. The analysis method was calibrated under the same operating conditions through standards produced and certified by Praxair-Colombia. The method was used to quantify concentrations (vol. %) of H2, O2, N2, CH4, CO, CO2, H2S, C2H4, C2H6 and C3H8. Procedures for interpreting thermogravimetric mass-loss data follow the method developed by Desamparados [19] . The gas samples were cleaned in a system consisting of a gas bubbling device in isopropanol at 0 °C to capture tar, and a filter with silica gel to remove moisture, before performing the gas chromatographic analysis. The results of the characterization of gases and the process were used to evaluate the performance of the same through parameters such as gas production (Yg), carbon conversion efficiency (Ecc) and thermal efficiency (Eth), which are determined according to equations 1 - 4 [20] :
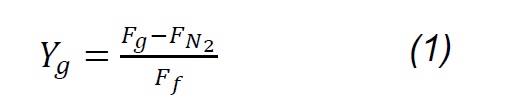
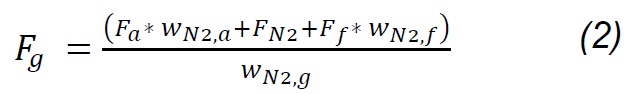
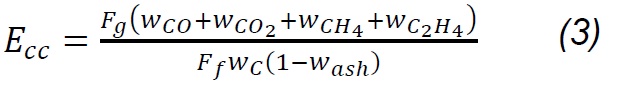
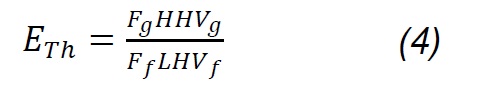
Where Fg, Ff, Fa , and Fn2 are the total gas flow, solid fuel, air flow and drag nitrogen flow, respectively. wn2,a, wn2,f, and wn2,g are the mass fractions of nitrogen in the air, in the fuel and in the gas produced. Carbon conversion efficiency was calculated from Eq.3, where Wco, Wco2, Wch4, Wc2h4 are the mass fractions of CO, CO2, CH4, C2H4 in gas,Wc and w ash are carbon and ash in the fuel, respectively, while the thermal efficiency was calculated according to the HHVg of gas and LHVf of solid fuel. For the previous calculations, it was considered that the moisture content in fuel is extracted during the drying phase [20] , nitrogen and air are injected dry to the process; therefore, the incidence of dehydration reactions [18] , as well as of evaporation of minerals [21] , is considered negligible. Likewise, it is considered that NOx is not produced, because the nitrogen from the biomass leaves as ammonia groups during pyrolysis between 300 and 600 °C; wheareas, the N2 that is in the coal at high temperatures remains strongly linked to structures such as pyrols and quaternary functional groups [22,23,24] , making part of rings of aromatic rings in clusters formed during the graffiti of the carbonaceous structure.
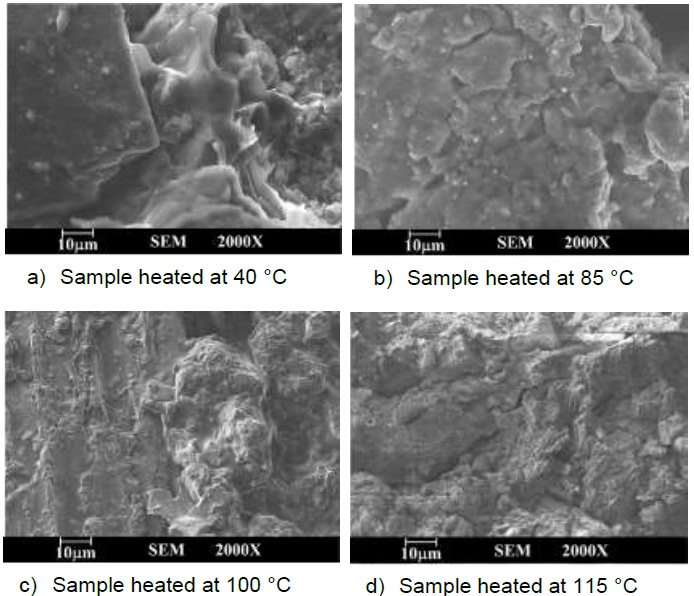
In order to observe the behavior of the paraffin during the drying phase in the gasification test of the agglomerated mixture, analysis of the degradation and expenditure of the binder was carried out. For this, four samples were heated at temperatures of 40, 85, 100 and 115 °C for 12 hours, to make a morphological analysis in a SEM-CARL ZEISS EVO/MA10, under procedures of the ASTM E-3 standard.
Fusible tests of the ashes from the coal-biomass mixture were performed following ASTM D1857 in a CARBOLITE model equipment model CAF-905S, in oxidizing atmosphere, in order to establish if the behavior of the mineral matter present in the sample, during the gasification process, is of solid or fluid ash [10, 25] . The mean fusion temperature (MFT) can also be calculated from the mineralogical composition of the ashes, which were previously analyzed by X-ray diffraction (XRD) [26] to identify qualitatively and quantitatively the crystalline compounds present [27] .
C. Mathematical model
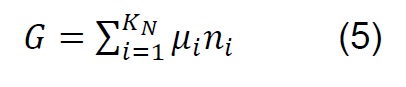
The equilibrium composition in simple reactions can be determined from the equilibrium constants; however, in the thermodynamic analysis of the gasification process, which is more complex and eventually includes the simultaneous development of multiple chemical reactions, the Gibbs free energy minimization algorithm (G) is used [28] . The equilibrium of a system of chemical reactions at constant temperature and pressure [29] can be expressed by the following equation:
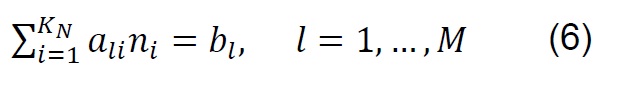
If ni satisfies the elemental balance of mass,
The minimum value of G is:
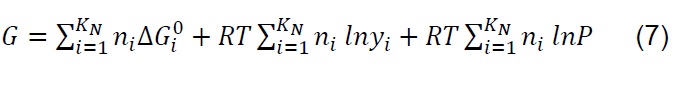
Where: 𝑎𝑙𝑖, Number of gram atoms of element l in a mass of species i. 𝑏𝑙, Totalnumber of gram atoms of element l in the reaction mixture. 𝐺, Gibbs free energy. 𝐾𝑁,Total number of chemical species in the reaction mixture. 𝑀, Total number of atomic elements. 𝑛𝑖 , Number of moles of species i. 𝑁, Total number of moles of all speciesin the gas mixture. 𝑃, System pressure. 𝑅, Constant of gases. 𝑇, Temperature. 𝑦𝑖,Molar fraction of species i. Δ𝐺𝑖 0, Gibbs free energy standard formation of species i.𝜇𝑖, Chemical potential of the species i.
D. Simulation
The Gibbs free energy minimization algorithm [30] was used to find the equilibrium composition of the chemical reactions of the gasification process. The equilibrium models are based on the assumption that the speed of the particular reactions is infinitely high, or the process time is sufficiently long, which allows the analyzed system to reach the state of equilibrium [31] . The simulation is carried out according to the methodology proposed by De Armas et al., for mathematical modeling and simulation [32] . Commercial software HSC Chemistry for Windows V 6.0., module: Equilibrium compositions were used in this work. The software is loaded with the data of the mass (millimoles) consumed during the gasification process of the samples with air as shown in Table 3, according to the chemical reactions (R1 to R9), to determine the evolution of the equilibrium composition depending on the temperature, within a range of 25 to 950 °C and an atmosphere of pressure [33] .
Table 3. Mass reacted by sample for simulation in HSC
| Sample | Initial weight (mg) | Total reacted weight (mg) | Reacted weight up to 750 °C (mg) | Reacted weight from 750 °C (mg) | Reacted elements (mmoles) | Hydrogen-Oxygen Compounds (mmoles) | |||
| C | H | S | O | H2O(v) | |||||
| P1 | 24.81 | 15.55 | 11.20 | 4.35 | 0.305 | 0.033 | 0.001 | 0.209 | 0.01 |
| P2 | 23.05 | 19.47 | 15.57 | 3.90 | 0.126 | 0.007 | 0.001 | 0.069 | 0.01 |
| P3 | 24.92 | 15.36 | 13.45 | 1.91 | 0.091 | 0.019 | 0.001 | 0.05 | 0.01 |


III. Results and discussion
A. Gasification experimental results
Gasification of coal (P1), biomass (P2), and the coal-biomass agglomerate (P3) were performed in the TGA. Figure 2 shows the mass loss as a function of temperature and time as well as the derivatives. The TGA curves show four phases, in accord with other published works [7, 11, 25, 34]. During the drying phase (F1) up to 150 °C there is loss of water and organic solvents of low molecular weight as well as desorption of gases. In the devolatilization phase (F2) between 150 and 250 °C low molecular weight organic components, adsorbed water, and paraffin in the coal-biomass agglomerated mixture are released. The drying stage with degassing of CO2, CH4 and N2 is similar for all samples up to 200 °C, comparable with other studies [18].
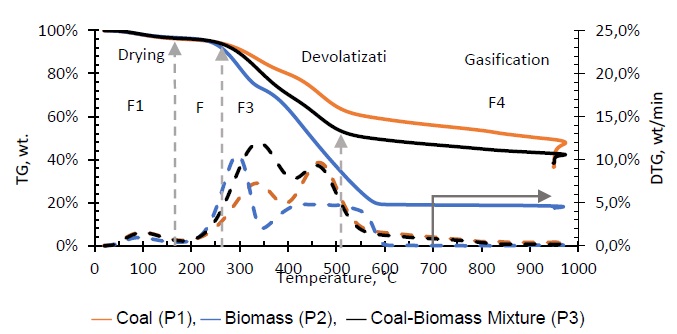
Between 250 and 500 °C (F3), thermal degradation occurs under N2 which releases organic compounds and some light gases. The highest levels of devolatilization are observed between 200 and 550 °C, with differences between biomass, coal and mixture, explained from the composition and compounds present in each of the samples. At temperatures above 500 °C carbonization of hydrocarbon compounds (F4) occurs, whose pyrolysis does not lead to much further volatile formation [19]. The majority of light gas formation occurs when oxygen is added to the system.
In the thermal decomposition curves, it is observed that the mass loss in the coal sample is significantly lower with respect to the biomass sample. This behavior is due to the fact that the biomass is composed of polymeric compounds of cellulose, hemicellulose and lignin which decompose at low temperatures, between 200 and 600 °C [35, 36]. The melting phase of coal contains polycyclic aromatic hydrocarbons with higher binding energies and consequently decompose at a higher temperature [37]. The low biomass content in the coal-biomass mixture explains why its mass loss temperatures generally resemble pure coal gasification [7, 34]. However it also shows a synergistic effect that is generated on the process with the addition of biomass, which accelerates the primary devolatilization between 200 and 400 °C; even though the mass loss curves during this stage are similar, the shape and speed of decomposition are different as seen in its DTG (see Fig. 2) compared to that of coal [38]. This phenomenon does not appear to have a significant effect on the later gasification stage. The mass losses verified after the primary devolatilization (550 and 700 °C), are attributable to secondary crosslinking reactions of nascent char and repolymerization of high molecular weight volatiles that reach to be expelled [18, 39, 40].
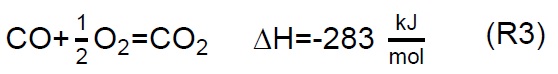
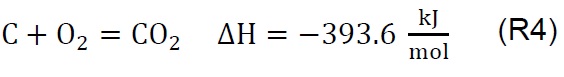
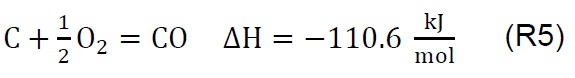
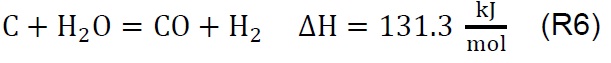
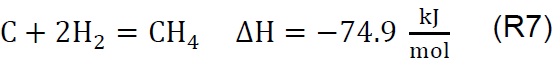
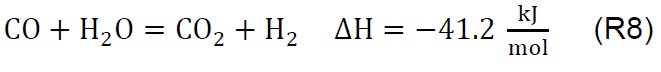
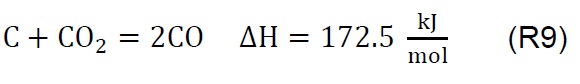
Air injection at 700 °C initiates the gasification process. Combustion and partial-combustion reactions (R4 and R5), production of hydrogen (R6), production of methane (R7) and production of other synthesis gas compounds obtained from the shift (R8) and Boudouard (R9) reactions occur above 650 °C [39]. These reactions are reflected in the gradual mass loss shown in Figure 2.
The average composition (% p) of the gas obtained from P1, P2 and P3, in nitrogen-free and oxygen-free base is shown in Figure 3. Notable contents of H2S, C2H4, C2H6 and C3H8 were not observed. During the gasification of the samples, hydrogen production is very low and does not show a specific trend; In this case, the coal registers the highest amount of propulsion with very little difference with respect to the biomass (1.74 %) and the mixture (1.52). This behavior is likely related to the temperatures reached by the process, elemental composition of biomass, and ash content as discussed later in this work [11].
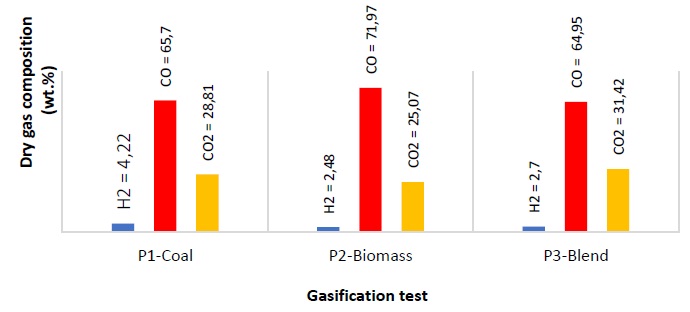
The concentration of CO from the carbon-biomass co-gasification is nearly the same as the gas produced during coal gasification (0.75 %); this is likely due to the greater reactivity of the biomass’s volatile matter which has high oxygen. The production of CO in the biomass gasification is 7.02 % higher than in the cogasification of biomass-coal. This is likely due to the abundance of oxygenated groups, the high content of volatiles in the biomass, and possible catalytic effects promoted by some components of the inorganic material present in the ash which can accelerate or inhibit the thermal decomposition of heavy hydrocarbons to form hydrocarbons lighter than methane or ethane [7, 11, 42, 43]. SiO2, for example, has been reported as a gasification inhibitor [44, 45].
Methane formation during the devolatilization of samples occurs through demethylation reactions of the aromatic structures (rearrangement) in the carbon and in the lignin of the biomass [46, 47]. With co-gasification, there is a reduction in the formation of CH4 compared to that obtained for coal and biomass individually. This may be due to the oxidation of the methyl groups formed during the pyrolysis phase with the oxygen released from the biomass, or because with the addition of biomass the presence of aliphatics since devolatilization is lower [18,48]. The increase in CO22 is commonly observed in tests with ER equal to 0.4 [46], and the presence of oxygen in the biomass [11]. Using air as a gasifying agent does not enhance the concentration of hydrogen since it does not promote the reactions R6 and R8; therefore, the reaction of methanation (R7) becomes irrelevant, but the formation of CO2 is favored [20,41].
At high temperature, the dehydration reactions have little relevance, so the moisture content in the outgoing gas stream is negligible and reactions R6 and R8 are not promoted. The nitrogen contained in the samples is released as ammonia compounds during the devolatilization stage, which leads to negligible amounts of NOx formed at high temperature [50, 51]. The formation of NOx at high temperature due to the air current is negligible in this case. Nitrogen in coal generally exists in heterocyclic aromatic organic structures such as pyrroles, pyridine and quaternary functional groups, which are thermally more stable and are not easily released during gasification [23, 52].
The highest gas production (Yg, 76.6 %) is obtained from the mixture (P3), which is consistent with the investigations reported by Emami-Taba et al. [11]; the differences with respect to coal (P1, 36.8) and biomass (P2, 42.8) are 39.8 % and 33.8 %. This behavior is comparable with gasification tests of biomass carbon mixtures, performed with ER of 0.3 and 0.4 in other investigations [20, 53], in which it was observed that when the biomass content in the mixture and the ER ratio are higher, production improves [20]. The conversion of carbon (Ecc) improves with the high content of volatile matter that increases the reactivity of the biomass and promotes the formation of free radicals, favoring the reactions of decomposition, oxidation and gasification; in addition, the increase in hydrogen and oxygen contents from biomass make the conversion of carbon during co-gasification is greater than in coal gasification [11]. Based on the previous analysis, the differences found between the results of the coal conversion during the gasification of the samples P1 (44.9 %), P2 (44 %) and P3 (88.7 %) are explained. The HHV of coal syngas is 11.52 MJ/Nm3 while biomass had 11.24 MJ/Nm3 and the mixture had HHV 11.02. The thermal efficiency (Eth) of the coal-biomass mixture (P3, 40.4) is 21.4 and 3.7 units higher than in coal (P1, 19.0) and biomass (P2, 36.7), respectively. This suggests that under these experimental conditions, the biomass gas is of lower calorific value than coal gas, and promotes the reduction of this property in the mixture gas (P3); this trend can be explained based by Uson et al. [51], where it is described that the high oxygen content in biomass favors the production of carbon dioxide, reducing the formation of hydrogen and carbon monoxide, which are the species that provide the calorific value to the syngas.
Since paraffin was used as a binder, Figure 4 shows the morphological changes in the surface of the sample due to the degradation and consumption of the binder. At 40 °C (Figure 4 a) there are solidified paraffin agglomerations, with rounded edges and smooth surface. This indicates that this material was exposed to a heating in which it did not reach the total melting point. At 85 °C (Fig. 4b), the paraffin has exceeded the melting point and shows a resolidification with texture and irregular agglomerations, suggesting some level of degradation. The micrograph of the sample exposed to 100 °C (Fig. 4c) shows solid surfaces with the appearance of a very thin coating, but there is no evidence of agglomerations. At 115 °C the sample (Fig. 4d) shows the surface of the carbon grains with high resolution, where no agglomerations or visible layers of paraffin are detected; it is inferred that under these conditions the paraffin has been degraded and removed together with the water vapor, during the drying phase of the sample, and the remaining binder is dragged in the nitrogen atmosphere during the devolatilization, from 370 °C. Therefore, it is considered that paraffin neither has effects on the gasification process, nor on the mineral species in the fuels.
In order to understand the effects of ash, studies to characterize the fusibility of the coal-biomass solids residue were performed. Figure 5 shows the photographic record of the different degrees of deformation of the samples as a function of temperature. A summary of these results in Table 4 shows that all monitored temperatures are lower than the mean fusion temperature —MFT— (1528.78 °C) calculated from ash composition, but also significantly exceed the maximum temperature of the gasification tests (950 ° C). The organic matter present in the coal is composed of ash-forming elements such as Si, Al, Fe, Ca, Mg, Na, K, Ti, S, P; trace elements (Cl, F, Hg, As, Se, and Cr) that generally increase during processes with carbon; rare elements (Ge, Ga, U, Mo, Be, Sc), elements of economic interest (Ag, Zn and Ge), and dangerous elements (Cd and Se) [52].
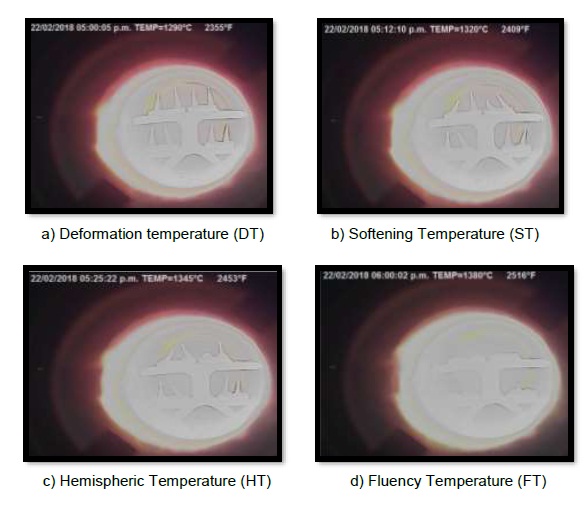
Table 4. Temperatures of tests of ash fusibility.
| Mixture | Temperature (°C) | |||||||||||
| DT | ST | HT | FT | MFT | ||||||||
| Coal-Biomass | 1290 | 1320 | 1345 | 1380 | 1528.78 | |||||||
| Mineralogical composition (wt. %) | ||||||||||||
| Al2O3 | SiO2 | K2O | Na2O | CaO | Fe2O3 | MgO | TiO2 | |||||
| Coal-Biomass | 4.53 | 80.29 | 0.77 | 0.18 | 1.13 | 8.55 | 4.51 | 0.04 | ||||
In other investigations on the behavior of ash fusibility under coal gasification conditions [53], it is found that the presence of CaCO3 and other additives can reduce the hemispheric temperature between 50 and 500 K and interact with other components within the ternary system SiO2-Al2O3-CaO. This tendency could explain the difference between MFT and HT of the fusibility test, given the contents of calcium, potassium and magnesium that the Chenopodium album provides. It is also observed that FT is smaller than DT; this result is simulated in gas gasification tests with CO2 and H2O carried out by Wu [54]. Fusion of the ash starts mainly with iron-containing minerals, such as the ferrite and wustite phases. The process also may be accelerated by the presence of calcium to form eutectic mixtures in the FeOsSiO2sAl2O3 system and CaOsSiO2sAl2O3. The fusibility of the main minerals and the mechanism of reaction at the molecular level, of coal ash mixed under gasification conditions, shows that the melting temperature decreases when mullite is transformed into anortite at average temperatures of 1400 K [55].
The results of the mineralogical composition (Table 4) show SiO2 as the primary species, for which negative inhibitory effects have been reported in the formation of H2 and CO2 on gasification. Upon combustion, depending on the reaction environment, the heating rate and the mineralogical composition (K and P), at temperatures between 700 and 1000 °C, the formation of low melting point salts is possible, which can trap fractions of carbon (sintered), preventing conversion [56], [60, 61]. However, the presence of Fe2O3, K2O and CaO favor the occurrence of cracking reactions of tars, which can enhance in gas and char formation [41].
B. Simulation of the gasification process in HSC
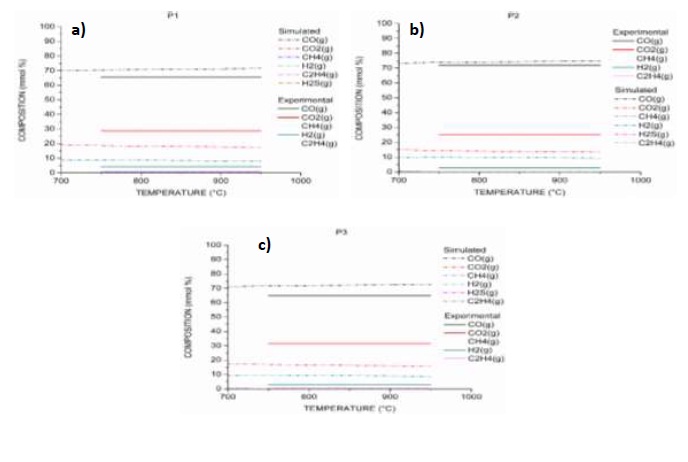
As a result of the simulation of the gasification processes of samples P1, P2 and P3, equilibrium composition curves were obtained for CO, CO2, H2, CH4, C2H4 y H2S and for the temperature range between 750 and 950 °C (Figures 6 a), b) y c)). Simulated equilibrium composition curves (Simulated) for P1 and P3, are nearly constant above 750 °C. A similar behavior was reported by Żogała [31], applying the stoichiometric method for the modeling of the carbon gasification reactions equilibrium when plotting the logarithm of the constants as a function of temperature.
As a result of the simulation of coal (P1), it is observed that simulated CO and H2 are 5.82 % and 4.62 %, higher than those produced experimentally, while simulated CO2 is 10.82 % less than the experimental one; the remaining gases do not show significant differences and the production has zero. The differences among the results of the experimental curves of composition and the simulated curves of the equilibrium composition, for the processes of gasification of biomass (P2) and the mixture P3, present the same trends with very small variations with respect to the values observed in P1. The reduction in the production of CO and H2, as well as the increase in the production of CO2, is comparable with the behaviors of experimental investigations [11, 54], explained above.
IV. Conclusions
The co-processing of coal and Chenopodium album biomass demonstrated physicochemical and environmental synergies. The use of paraffin as a binder for the formation of the combustible mixture does not likely alter the composition of the obtained syngas or modulate the fusibility of the constituent minerals of the ashes in terms of the flux phases.
The composition of the syngas was determined to be dependent on the physicochemical characteristics of the fuel and the process conditions. The syngas obtained from coal had the highest concentration of H2 and the lowest CO. Concentrations of CH4, CO2 and C2H4 were similar between coal and biomass. This result is consistent with the higher calorific value of the coal syngas. The production of syngas from the coal-biomass mixture had the highest contents of H2 and CO. This behavior results from the synergistic phenomena that occur with the fuel mixture. The co-gasification of the mixture presents the best values in syngas production, carbon conversion and thermal efficiency. These results indicate the viability of co-gasification with these feedstocks abundant in the Boyacá region (Colombia).
Funding
The article is a product of the research project: "Effect of physicochemical properties of coal-biomass briquettes on the efficiency of the gasification process in a fixed bed", developed through the Research Group “Investigación en Carbones y Carboquímica de la UPTC”, research lines: clean technologies, pyrolysis. Financing through the scholarship program of the Gobernación de Boyacá through Colciencias. Project approved in Call 733 of 2017 of the Vice-Rector of Investigations of the UPTC, code SGI 2259. Start dates: July 20, 2017. Completion date: December 2018.
Acknowledgments
The authors are grateful to Ph.D. Yaneth Pineda Triana from INCITEMA and the Research Group in Carbons and Carboquímica of the UPTC, the Faculty of Mechanical and Electrical Engineering of the Universidad Autónoma de Coahuila en Monclova, México, the Research Group in Energy Efficiency Management of the Universidad del Atlántico (Colombia), and the Energy Sciences Laboratory of the Universidad Nacional de Colombia (Medellín).
This work was authored in part by the National Renewable Energy Laboratory, operated by Alliance for Sustainable Energy, LLC, for the U.S. Department of Energy (DOE) under Contract No. DE-AC36-08GO28308. Funding provided by U.S. Department of Energy Office of Energy Efficiency and Renewable Energy Bioenergy Technologies Office. The views expressed in the article do not necessarily represent the views of the DOE or the U.S. Government. The U.S. Government retains and the publisher, by accepting the article for publication, acknowledges that the U.S. Government retains a nonexclusive, paid-up, irrevocable, worldwide license to publish or reproduce the published form of this work, or allow others to do so, for U.S. Government purposes.
Author’s contributions
Information about procedures and results from Marco Ardila´s doctoral thesis about kinetic model to the coal-biomass briquetes gasification process, and Eduardo Gil's master thesis about briquetes gasification process, is presented; these reserchs were directed by Alfonso López and Fernando Lozano, respectively. The gasification tests in the thermogravimetric analyzer and chromatographic analysis was leaded by Carlos Valdés. The pyrolisis phase analysis and process performance calculations were guided by Brennan Pecha and Marley Vanegas. The thermodynamic analysis and the equilibrium composition curves were simulated with HSC software, with Emilio Camporredondo instructions.

