


 English (pdf)
 Article in xml format
 Article references
 Send this article by e-mail
 Cited by SciELO
  Cited by Google
  Similars in
SciELO
Similars in
SciELO  Similars in Google
 Permalink
I. Introduction
In fresh rum, as in most distilled alcoholic beverages, the aroma reminds of the used raw material. Aroma varies when the fresh rum rests in oak containers for a certain time, commonly known as "aging" or aging time. During this time, reactions that cause a transformation of the original organoleptic properties of the distillates occur naturally. [1]
The technological production process of the Aged rum that is carried out at the Alcohol and Beverage Reference Center (CERALBE), belonging to the Cuban Research Institute of Sugarcane Byproducts (ICIDCA), comprises several stages. During the rum aging process, product losses, popularly known as "the Angel portion", occur. The aging of rum does not change or transform the drink but develops and sublimates its latent qualities [2]. That is why, in the context of excellence in which these drinks compete, there is an interest in studying the decrease in the volume of rum during aging concerning the environmental conditions. These losses have not been updated in CERALBE recently, although the volume of losses is known to be high.
The existing technology in the aging cellars allowed the study of the wastages during 13 months; measuring the liquid level of the barrels, alcoholic strength, temperature and humidity. All this stored memory constitutes a valuable source of information that can be useful in understanding the present and predicting the future.
Data mining (DM) is the process of extracting useful and understandable knowledge, previously unknown, from large amounts of data stored in different formats [3]. It allows prediction, classification, association, grouping and correlation tasks based on statistical techniques such as the analysis of principal and computational components such as artificial neural networks [4]. Currently, the DM has become popular due to the increase in the computing capacity of the computers, combined with the increase in the data storage capacity and its quality [5].
Artificial neural networks constitute a computational tool that mimics the functioning of the human brain because it can learn patterns or behaviors from a database [6,7]. Obtaining predictive models from training, which is developed by presenting an input matrix and its corresponding output, has allowed the modeling of different processes.
The predictive models obtained by data mining techniques constitute an alternative to the mathematical models and at the same time, a tool to analyze the information stored in the rum aging processes to predict the percentage of volume losses based on the variables that are registered.
II. Materials and methods
A. Creation and Training of the Neural Network
The multilayer perceptron neuronal network with one and two hidden layers, feed-forward network, backpropagation training algorithm was used for the modeling of the rum aging process. This type of neural network is easy to use and allows the modeling of complex functions [7-8].
The number of neurons in the hidden layers was varied from 4 to 10 with each of the training algorithms used: Levenberg-Marquadt (L-M) and Bayesian (Bay). The input variables to the network were: numerical month, volume, temperature, humidity, initial alcoholic grade and aging time, while the output variable was volume losses. Table 1 shows the minimum and maximum values for each variable. 546 pairs of input / output data were processed. The original data were normalized between 0.0 and 1.0, given the differences between their magnitudes. For the partition of training data, the ‟dividerandʺ function was used, with the default division of 70% for training, 15% for testing and 15%, for validation. The increase in 6 consecutive iterations of the validation error and 1,000 as the maximum number of training cycles were the criteria used to stop the training. Both the creation of the neural network and its training were carried out in Matlab 2017.
Table 1 Value range for each variable*V: volume; GA: alcoholic grade; T: temperature, H: humidity; t: aging time, m: volume losses.
| Variable | V (L) | GA (oGL) | T (oC) | H (%) | t (years) | m (L) |
| Minimum | 154.33 | 55.72 | 23.82 | 43.75 | 3.46 | 0.59 |
| Maximum | 172.51 | 56.74 | 37.0 | 74.0 | 4.69 | 2.11 |
| Range | 18.18 | 1.03 | 13.18 | 30.25 | 1.22 | 1.52 |
For the selection of the optimal number of neurons in the hidden layer, three criteria were taken into account: the mean square error in the validation of the model (MSE), the average absolute error (MAE) and the correlation coefficient (R) between the values of losses estimated by the neuronal model and the real values. [9-10].
1) Friedman Test. The Friedman test allows the comparison of several samples, is used for the selection of the best behavioral neuronal architecture according to the criteria of the mean square error, in the case that the results were very similar and the decision becomes difficult. This test has two hypotheses: h0 (null hypothesis), which raises the equality between all the medians in a group, and h1 (alternative hypothesis), which raises the non-equality among all the medians in the group. It is a non-parametric test. The selection of the neural architecture is based on the P value; if this is less than 0.05 the null hypothesis is rejected.
2) Wilcoxon Test. When the Friedman test reveals that there are statistically significant differences between the group medians, it is necessary to perform the Wilcoxon test to select the best behavioral neuronal architecture. The Wilcoxon test (non-parametric) allows a comparison of pairs of samples. It has two hypotheses: h0 (null hypothesis), which remarks the equality between two medians, and h1 (alternative hypothesis), which mentions the non-equality between two medians. The selection of the neural architecture is based on the P-value; if it is less than 0.05 then the null hypothesis is rejected [10].
III. Results and discussions
A. Determination of Noise, Cleaning and Selection of the Data to be Used
A data with 900 instances and ten variables were obtained, five of them qualitative: product, track, date and horizontal and vertical positions; while the remaining: aging time, volume, temperature, humidity and initial alcoholic degree are quantitative. The initial data matrix was reduced to 546 values as it presented incomplete measurements for three barrels (19, 21 and 159) and the period from February to September 2014.
1) Topology of the neural network. The number of neurons in the hidden layer was varied from 4 to 10 with each of the training algorithms used (Levenberg-Marquadt and Bayesian) and the behavior of all topologies were compared. The coefficient of determination (R2) of the losses for each of the topologies, as well as the mean square error (MSE) and the mean absolute error (MAE, are shown in Table 2.
Table 2 Topology comparison with a hidden layer for each algorithm
| Neurons in the hidden layer | Levenberg-Marquadt | Bayesian | ||||
| R2 | MSE | MAE | R2 | MSE | MAE | |
| 4 | 0.9271 | 0.0978 | 0.2734 | 0.9926 | 0.0092 | 0.0702 |
| 5 | 0.9325 | 0.0660 | 0.1864 | 0.9933 | 0.0230 | 0.1295 |
| 6 | 0.9890 | 0.0177 | 0.1080 | 0.9870 | 0.0361 | 0.1604 |
| 7 | 0.9885 | 0.0336 | 0.1415 | 0.9966 | 0.0080 | 0.0712 |
| 8 | 0.9567 | 0.0968 | 0.2478 | 0.9651 | 0.0824 | 0.2452 |
| 9 | 0.9779 | 0.0375 | 0.1611 | 0.9856 | 0.0277 | 0.1196 |
| 10 | 0.9684 | 0.0465 | 0.1664 | 0.9797 | 0.0403 | 0.1619 |
From Table 2 it is shown that the coefficient of determination values are in the range of 0.9271 to 0.9966; the mean square error values are between 0.0080 and 0.0978; while the absolute error is in the range of 0.0702 to 0.2734. By following the criteria of the highest coefficient of determination and the lowest error value, the best-performing neural networks have the structure 6-6-1 and 6-7-1 using the algorithm LM and 6-7-1 and 6-4-1 using the Bayesian algorithm.
According to the previous result and the similarity in the order of the mean square error for each topology, it was concluded that it was necessary to perform the Friedman test to determine if there were statistically significant differences for each configuration.
P-value for the Friedman test was 0.0926 for the L-M training algorithm, while in the case of the Bayesian it was 0.0580 (both greater than 0.05). Therefore, there was equality among all medians and there were no statistically significant differences between the behaviors of the different topologies for each training algorithm used.
Subsequently, networks were modeled with two hidden layers and with the best configurations of neurons obtained, alternating in the same way between the training algorithms mentioned. The statisticians, for the selection of the best model with two hidden layers, are shown in Tables 3 and 4 for each algorithm.
Table 3 Topology comparison with two hidden layers for the LM algorithm
| Neurons in the hidden layer | R2 | MSE | MAE |
| 7-6 | 0.9651 | 0.0357 | 0.1516 |
| 6-7 | 0.9771 | 0.0250 | 0.1167 |
| 10-7 | 0.9401 | 0.2852 | 0.3099 |
| 7-10 | 0.9625 | 0.0577 | 0.1994 |
| 10-6 | 0.9755 | 0.0896 | 0.2479 |
| 6-10 | 0.9464 | 0.0833 | 0.2544 |
| 6-6 | 0.9428 | 0.0553 | 0.1874 |
| 7-7 | 0.9773 | 0.0370 | 0.1622 |
| 6-4 | 0.9753 | 0.0345 | 0.1420 |
| 4-6 | 0.8516 | 0.2213 | 0.3652 |
| 4-7 | 0.9833 | 0.0190 | 0.0933 |
| 7-4 | 0.9570 | 0.0782 | 0.2295 |
Table 4. Topology comparison with two hidden layers for the Bay algorithm.
| Neurons in the hidden layer | R2 | MSE | MAE |
| 7-4 | 0.9630 | 0.2167 | 0.3704 |
| 4-7 | 0.9957 | 0.0118 | 0.0936 |
| 10-7 | 0.9757 | 0.0936 | 0.2333 |
| 7-10 | 0.9887 | 0.0323 | 0.1410 |
| 10-4 | 0.9888 | 0.0284 | 0.1318 |
| 4-10 | 0.9955 | 0.0046 | 0.0432 |
| 7-7 | 0.9905 | 0.0525 | 0.1860 |
| 4-4 | 0.9981 | 0.0021 | 0.0389 |
The topologies shown in Tables 3 and 4 were tested for Friedman to determine if there were statistically significant differences with respect to each configuration. In the first case (L-M algorithm) the result of the P-value for the Friedman test was 0.6959, greater than 0.05, so there are no significant differences between the behaviors of the different topologies. In the second case (Bayesian algorithm), there was a difference between the medians of the topologies, presenting a P-value for the Friedman test of 0.0005, so the Wilcoxon test was performed to define the best neuronal topology according to the criterion of the mean square error. This test was performed between the best topology of this group (6-4-4-1) and the remaining ones; according to the criteria: mean square error, correlation coefficient and absolute error. The results of the Wilcoxon test are shown in Table 5.
Table 5. Comparison between pairs of topologies by Wilcoxon test.
| Compared topologies | P-value | Significant differences |
| 6-4-4-1 y 6-7-4-1 | 0.0025 | * |
| 6-4-4-1 y 6-4-7-1 | 0.0138 | * |
| 6-4-4-1 y 6-10-7-1 | 0.0240 | * |
| 6-4-4-1 y 6-7-10-1 | 0.0103 | * |
| 6-4-4-1 y 6-10-4-1 | 0.0274 | * |
| 6-4-4-1 y 6-4-10-1 | 0.3300 | |
| 6-4-4-1 y 6-7-7-1 | 0.0004 | * |
There are statistically significant differences with respect to the mean square error between the topology (6-4-4-1) and all the remaining ones, except for the configuration (6-4-10-1). Therefore, only those two could be considered selectable in this group, taking into account the criterion of the lowest mean square error. Table 6 shows a selection of the best topologies according to the mentioned criteria, in addition to the determination coefficient calculated for each of them.
Table 6 Selection of the best topologies.
| Algorithm / Topologies | R | MSE | MAE | R2 |
| L-M/6-6-1 | 0.9890 | 0.0177 | 0.1080 | 0.9780 |
| L-M/6-7-1 | 0.9885 | 0.0336 | 0.1415 | 0.9772 |
| Bay/6-4-1 | 0.9926 | 0.0092 | 0.0702 | 0.9853 |
| Bay/6-7-1 | 0.9966 | 0.0080 | 0.0712 | 0.9931 |
| L-M/6-4-7-1 | 0.9833 | 0.0190 | 0.0933 | 0.9669 |
| Bay/6-4-10-1 | 0.9955 | 0.0046 | 0.0432 | 0.9909 |
| Bay/6-4-4-1 | 0.9981 | 0.0021 | 0.0389 | 0.9961 |
The topologies underlined in Table 6 constitute the best combinations of statisticians. The four selected correspond to the Bayesian training algorithm, two of them have a hidden layer and the other two. These were subjected to the Friedman test to determine if there were statistically significant differences. The P-value obtained was 0.0153, less than 0.05, showing that there were differences with the topology (6-7-1). The Wilcoxon test was performed to define if there were differences between the best topology (6-4-4-1) with the (6-4-1) since it had been determined, previously, that there was no difference with (6-4-10-1). The P-value obtained was 0.0513, so there are no differences. From these last four selected topologies, anyone expect (6-7-1) can be chosen.
Based on the results of the best model according to the topology of the neural network, according to the criteria of the mean square error and the correlation coefficient separately, it was decided that the neuronal model that best predicts the losses in the rum aging process is (6-4-4-1). The higher correlation coefficient among all topologies, a moderate structural complexity that allows savings in Matlab software calculations and low mean square error values, are reasons that justify the previous decision.
2) Simulation. In order to verify the predictive capacity of the neural network, already trained and validated, the topology (6-4-4-1) was used to simulate 13 initial aging conditions. These values were determined as the average of the thirteen months of research for each variable analyzed, to ensure the interpolator character of the network. The quality of the model can be seen in Figure 1, where the actual values and those estimated by the neuronal model for the different initial conditions are shown. The average error in the estimate is 3.03%, the maximum error being 7.4%.
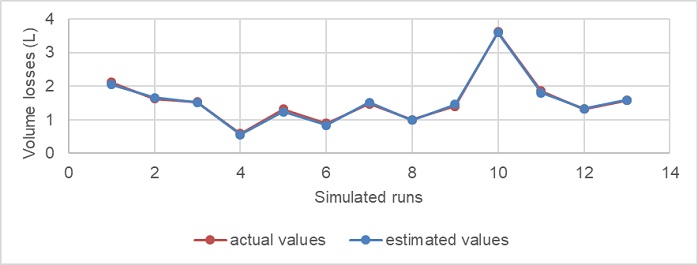
Fig. 1. Comparison chart between actual and predicted values for the neural network model (6-4-4-1).
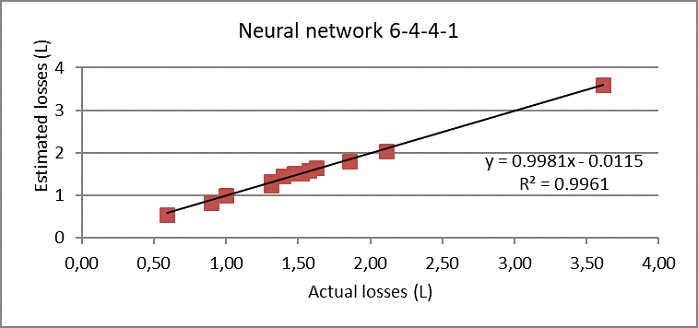
The regression line between the values estimated by the neuronal model and the values of actual losses, as well as the coefficient of determination are shown in Figure 2.
IV. Conclusions
The neural network obtained with the topology 6-4-4-1 was used to model the aging process and demonstrated its ability to estimate the losses in this process satisfactorily. The high value of the coefficient of determination (0.9961) between the simulated values and the real values, and the low mean square error in the model validation indicate the convenience of neural networks in the modeling of the aging process. On average, the error that the trained network commits in the estimate is 3.03%.

