


 English (pdf)
 Article in xml format
 Article references
 Send this article by e-mail
 Cited by SciELO
  Cited by Google
  Similars in
SciELO
Similars in
SciELO  Similars in Google
 Permalink
I. INTRODUCTION
The fundamental objectives of medicine are the prevention and promotion of health, pain relieving, assistance to incurable diseases and prevention of premature death [1, 2]. In medical practice, the diagnosis and evolution of pathology are the most frequent activities in the daily work of a doctor.
Doctors rely on various tools that provide them with information about the status of the human body, in order to diagnose and determine the evolution of the pathology and decide on the treatment to follow [3, 4]. In recent years, medical images became the main tool for the doctor, they show the state of internal tissues in a specific area of the human body.
Different techniques have emerged through technological developments to observe the interior of the body, among them is the computed tomography (CT), where the image is constructed from multiple values of the X-ray beam, which crosses the study area [5]. This type of images is applied to the study of bone lesions, lung and thorax studies, and to detect oncological diseases. Another method is magnetic resonance (MRI), based on the magnetic resonance of the hydrogen nucleus when exposed to a high magnetic field [6], among its main applications are neurology, cardiovascular pathologies, otorhinolaryngology, ophthalmology, and locomotor system diseases. Ultrasound based on a series of electromagnetic waves [7] allows to evaluate different organs of the human body, its main application is a prenatal diagnosis. Positron emission tomography (PET) is a molecular technique that uses radioactive drugs to obtain images of biological processes which are used to evaluate the functioning of organs [8].
Medical images are presented in 2D, 3D, and 4D. Three dimensions are associated with space and fourth is the time, in two-dimensional images the information represents the width and the height of an organ, by adding one more dimension, it represents depth and it is known as three-dimensional image [9]. On the other hand, the fourth dimension, adds the possibility of having movement in the image, 4D images are shaped by 2D and 3D images [10]. A technique that facilitates recording images in different planes is computed tomography, resulting in 2D images, when these images are stacked in a plane, they allow to obtain a 3D image; the three-dimensional objects represented with this type of technique require a mental projection process that can be subjective and different from the diagnostic of the other specialists [11].
The delimitation (segmentation) of the affected area must be done by a specialist doctor, and must take into consideration the additional knowledge of anatomy, pathology, etc. Bokde et al. [12], Cichosz et al. [13], Jaya and Thanushkodi [14], Selvanayaki and Karnan [15] conclude that manual segmentation is not free from errors and presents various problems such as unwanted characteristics both intraoperative and interoperative, lack of reproducibility, exhaustion of the operator [16], among others.
By the incorporation of computation, the analysis of the region of interest in medical images is significantly improved, there are several investigations to perform segmentation, but there are still drawbacks, authors such as Weese and Lorenz [17] highlight the lack of analysis technologies, lack of robustness and reliability in techniques, and lack of automatic algorithms for constructing anatomical models. Ayyoub et al. [18] focus the problem on the segmentation of the region of interest and state that the analysis of medical images still requires considerable improvements [19].
The document is structured as follows, the first section explains the materials and methods presenting preliminary concepts of medical images, describing the algorithms of segmentation and generation of 3D models, also, it shows the stages of software development. The next section shows the result after a computing cost assessment, three-dimensional models, and an end-user experience (usability). The last section presents the conclusions and future works.
II. METHODS
A. Techniques for Medical Images
Currently, technological development has allowed obtaining real-time information of the current state of the organs, facilitating the portability of reports between diverse entities of health. Medical images have also evolved since their invention, presenting improvements in techniques and procedures, but in return, they also increase the amount of data to be processed and analyzed.
As a solution to the handling of information, the DICOM (Digital Imaging and Communications in Medicine) standard appears, which is the most widespread standard. It was created by the ACR (American College of Radiology) and by the NEMA (National Electrical Manufacturers Association). The DICOM standard is open-source designed to organize images for visualization, storage, printing and transmissions [20, 21]. The current version is 3.0 but it constantly evolves according to technological advances [22, 23].
Among the information collection techniques of the human body, there is Computed tomography (CT) and Magnetic Resonance (MRI). Hounsfield, in 1971 develops TC, which uses the intrinsic characteristic of X-rays to pass through the tissues of the human body, and thus form the image that represents the organ. Ramirez et al. [24] determine that the investigations are focused on aspects such as: increasing the speed of acquisition (temporal resolution), improving the spatial resolution, raising the quality of the image and minimizing the dose of ionizing radiation. On the other hand, MRI makes usage of an intense magnetic field for the generation of the image, and this type of technique produces images of high quality, and its main uses are to detect cerebral edema, venous thrombosis, among others [25].
B. Algorithm Clustering (k-means)
Artificial intelligence is revolutionizing the way of processing massive volumes of data (Big Data) [26], involving various areas of knowledge, among which is the medical field, specifically in segmentation. According to Caponetti et al. [27] grouping algorithms are successful tools in the task of limiting the region of interest. Several authors have carried out various works such as the one elaborated by Gharnali et al. [28] who propose an algorithm based on FCM, which increased accuracy and robustness against noise. The analysis was applied to MRI images of the brain in white and gray matter segmentation. On the other hand, Ahmmed et al. [29] performed the classification of brain tumors using fuzzy logic: they initially performed delimitation of the region of interest, then selected characteristics to classify using 93 fuzzy rules. Jaros et al. [30] demonstrated the parallel capabilities of the K-means algorithm applied to the segmentation of TC images of the human body.
In this work, we used the K-means algorithm because of its simple implementation and great results. K-means developed by MacQueen in 1967 is the most widespread and used [31] algorithm. The main applications of clustering methods are in data mining; whose objective is to group elements with common characteristics.
C. Three-Dimensional Models
In virtual environments, the 3D or three-dimensional model is the technique that allows modifying the perception of the observer, providing depth to two-dimensional images. Representing an object on a screen requires an analysis of the morphological characteristics of things. In computing, three-dimensional models are discrete, that is, they are constructed from points located in 3D space, and are interconnected by edges to form graphically visible structures.
Computational graphic models consist of meshes. Authors such as Boening et al. [32], present an algorithm based on Delaunay triangulation, in this work they performed the 3D reconstruction of proteins. Delone proposed in 1934 a method, named Delaunay triangulation, that allows to maximize the interior angle of a mesh of triangles that delimits the surface of an object. Its technique is based on two main elements: the first of them, a triangle, and the second, the circumscribed circumference (the one that contains the vertices of the triangle).
D. Development of SIM3D Software
1) Analysis. The success of software development is in the analysis of the functional requirements of the system. The following list shows the engineering specifications.
Medical images are under the DICOM standard, and the source of generation can be CT or MRI.
The files are stored in a folder, where they are properly labeled.
Perform delimitation of the region of interest using established characteristics.
Perform the generation of three-dimensional models, using the segmentation of medical images.
Interconnect a virtual reality visualization device, using virtual reality glasses and a mobile device.
Allow interaction with objects within the work environment.
2) Design . The program SIM3D contains two modules: Data analysis and information management. Data analysis reads and performs segmentation of medical images, and it includes the functions Read Image and Segmentation. Information management builds three-dimensional meshes, and contains the options Navigate, Mesh and VR. Figure 1. shows a complete block diagram.

The module Read Image establishes a one-dimensional array with pixel values of the image. Initially, a data-stack loads the names of the files located in the directory defined by the user. Next, a function receives the stack with names and extracts the pixel values. Finally, the data-array reshapes dimension to nx1.
The next module (Segmentation) aims to group pixels with similar characteristics. This application implements clustering algorithms (k-means, FCM, and SFCM), these algorithms are iterative and unsupervised, they seek patterns in the data, without having a prediction as aim. As input data needs an array with population to segment, and it also requires cluster number, the initialization of centroids is random.
Next, the module Mesh is responsible of generating the 3D mesh, it receives the data from the Segmentation module, and it delivers the file with extension *.obj (Wavefront 3D Object File) as an output. Initially, the Delaunay algorithm builds the mesh based on data from the Segmentation module, and then a refinement is performed to improve the definition of three-dimensional graphics, at the end of this stage a *.off type file (Object File Format) that contains the geometry of the 3D object is generated. However, Unity does not accept files *.off, therefore, the files all convert to obj format.
The module Navigate is responsible of reading and loading the meshes, it is also responsible of receiving the information of the joystick or gyroscope sensors of the mobile device, with this data it performs movements of the objects or the camera.
Finally, the VR module is responsible of establishing the gateway between the application running on the computer and the mobile device, where the viewing of the objects happens. This module uses a client-server model to build a bidirectional channel.
3) Implementation. We implemented the software using the C ++ programming language, on the VisualStudio platform; Unity software was used as a graphics engine for the rendering of meshes. Figure 2 shows the class diagram.

4) Validation. The user interface can be seen in Figure 3. In the image, you can see a window divided in two, where the mesh is generated by the program. In the lower left part of the window the panel that allows to choose one of the three segmentation algorithms is located, whereas on the right side, buttons that make each cluster visible can be seen.

For improving the navigation experience, the SIM3D software performs movements from two perspectives. The first of these is the movement of the camera, allowing it to perform rotational and translational changes, which makes it easy to observe from various perspectives. The second way to perform moves is to keep the observer static and move the objects present in the scene, additionally allowing translation and rotation.
III. RESULTS
This section presents the strategy for the evaluation of the designed software. The analysis includes the computational cost, time, and RAM usage during mesh generation and viewing of a three-dimensional model. Finally, we perform an experiment with a group the people to define the usability of the computational application. Three computers were used to run the tool developed in this work, as indicated in Table 1.
Table 1 Technological resources
| Characteristics | Machine 1 | Machine 2 | Machine 3 |
| Processor | Core i5-5200 CPU 2.2GHz | Core i7-6700 CPU 3.5 GHz | Core i5-2400 CPU 3.1 GHz |
| RAM | 6 GB | 8 GB | 4 GB |
| Graphic card | Intel HD | GTX 1050 4GB | Intel HD |
| Operative system | Win 10 | Win 10 | Win 10 |
A. Computational Cost
We used a medical MRI image with dimensions of 260x320 pixels for the evaluation of time and RAM metrics. The protocol for the experiment was the following: we performed 10 independent tests and each of them ran 100 iterations, also the number of images in each new inspection increases.
Time and RAM are related to the number of images processed in each run. Table 2 shows the results of the time and RAM used on three machines, where the μ and δ labels represent the mean and standard deviation, respectively. The average time in the three work stations was 0.310s and 37.16s. The shortest time corresponds to the processing of an image with 83.400 pixels, and the largest time in the study is of 11.648.000 pixels corresponding to 130 images. On the other hand, one image uses 0.028 Gb of RAM and 140 images use approximately 1.3 Gb. The RAM used in the three computing machines does not show significant changes.
Table 2 Computational time and RAM cost
| No | C. I | Machine 1 | Machine 2 | Machine 3 | |||||||||
| Time (s) | RAM (GB) | Time (s) | RAM (GB) | Time (s) | RAM (GB) | ||||||||
| µ | δ | µ | δ | µ | Δ | µ | Δ | µ | δ | µ | Δ | ||
| 1 | 001 | 0.265 | 0.01 | 0.010 | 0.01 | 0.243 | 0.02 | 0.010 | 0.01 | 0.423 | 0.02 | 0.010 | 0.01 |
| 2 | 002 | 0.592 | 0.20 | 0.028 | 0.01 | 0.537 | 0.05 | 0.026 | 0.01 | 0.951 | 0.08 | 0.026 | 0.01 |
| 3 | 010 | 2.467 | 0.50 | 0.100 | 0.02 | 2.358 | 0.11 | 0.097 | 0.09 | 4.609 | 0.31 | 0.097 | 0.09 |
| 4 | 020 | 5.049 | 0.30 | 0.190 | 0.01 | 4.486 | 0.30 | 0.190 | 0.01 | 8.012 | 0.45 | 0.190 | 0.01 |
| 5 | 030 | 6.404 | 0.60 | 0.250 | 0.01 | 5.957 | 0.31 | 0.251 | 0.01 | 11.48 | 0.50 | 0.251 | 0.01 |
| 6 | 040 | 9.057 | 1.09 | 0.300 | 0.01 | 8.252 | 0.41 | 0.310 | 0.01 | 15.71 | 1.80 | 0.310 | 0.01 |
| 7 | 050 | 11.51 | 1.03 | 0.500 | 0.10 | 9.923 | 1.01 | 0.493 | 0.10 | 20.87 | 1.57 | 0.494 | 0.10 |
| 8 | 100 | 23.07 | 0.90 | 0.900 | 0.08 | 21.18 | 1.10 | 0.910 | 0.09 | 43.67 | 2.09 | 0.910 | 0.09 |
| 9 | 120 | 27.50 | 1.01 | 1.100 | 0.09 | 23.82 | 1.50 | 1.089 | 0.10 | 47.66 | 2.90 | 1.099 | 0.10 |
| 10 | 140 | 30.44 | 1.10 | 1.300 | 0.10 | 25.63 | 2.00 | 1.281 | 0.20 | 55.43 | 4.01 | 1.291 | 0.20 |
B. Segmentation
For the reconstruction of the tumor, we used four MRI studies that show a brain tumor. Figure 4 illustrates medical images of a patient with primary glioblastoma, which is a tumor of the central nervous system that primarily affects men [33]. In this case, the region with the lesion is found in the right hemisphere, in the parietal lobe. Figure 4a is a lower slice, and Figure 4d is a higher layer.

Clustering techniques present a very high sensitivity to the selection of centroids [35]. In this work, we initialize the centers using random values from the dataset and the cluster number is five. Figure 5 shows the results of the segmentation of the images present in Figure 4. Figures 4a to 4d display the region with a lesion inside a red circle, they also contain an oval white area due to fat between scalp and bone.
C. Rendering
Rendering is done using the Unity graphics engine. Figure 6 displays the three-dimensional model of the tumor. The model is built from triangular meshes which are sets of vertices, edges, and faces. The mesh of the tumor includes 151 vertices and 318 faces. The image shows a tumor with some shape deformations. In other words, the angle formed between two adjacent faces can be between two range 0-30 and values near 90 grades. These types of angles have several causes such as a deficiency in segmentation, images having a separation between each of the layers, among others.


The meshes generated by the computational application use triangles. Figure 7 shows the reconstruction of the tumor seen from various viewpoints, also, the illustration includes views of several sections aiming for the best view. Figures 7a and 7b display the tumor views from top left (this is inside a red curve line). Figure 7c presents the model seen from the posterior region with a turn of about 45 degrees. Figure 7d illustrates a mesh view from the front with approximately 45 grades of inclination of the camera. Finally, Figure 7e shows the tumor view from the neck and with a turn of 90 degrees.
On the whole, the model 3D generated by the application SIM3D contains vertices than form polygons. It includes meshes generated from medical multilayer images; the segmentation delimits the region in groups or several clusters, and it separates in parts. Table 3 presents the vertices and faces of each group. In figure 8, we show the 3D models that are the result of using 5 clusters. Each group is represented by a letter.

Fig. 7 Views of the glioblastoma tumor: (a) and (b) top view, (c) back view with rotation, (d) front view with rotation and (e) bottom view.
Table 3 Vertices and Faces of each of the clusters
| k | Vertices | Faces | ||||||||
| 1 | 2 | 3 | 4 | 5 | 1 | 2 | 3 | 4 | 5 | |
| a | 29.462 | 26.040 | 26.040 | 24.932 | 14.560 | 67.384 | 59.588 | 59.588 | 58.352 | 32.044 |
| b | 29.666 | 28.508 | 24.769 | 23.195 | 12.248 | 68.060 | 64.682 | 55.769 | 53.458 | 27.024 |
| c | 8.555 | 12.112 | 7.320 | 11.696 | 7.166 | 18.076 | 24.430 | 15.320 | 24.702 | 14.828 |
| d | 15.202 | 5.082 | 0.151 | 1.883 | 0.153 | 32.566 | 11.042 | 0.318 | 3.976 | 0.316 |
| e | 26.837 | 15.639 | 09.297 | 8.928 | 7.611 | 60.268 | 34.616 | 20.138 | 12.294 | 16.486 |
D. Usability
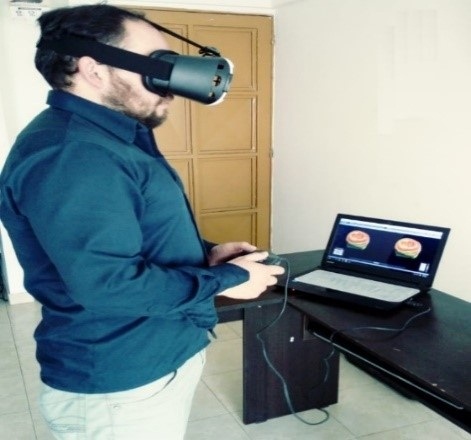
In the developed system, the visualization is done through virtual reality using stereoscopy technique, that is to say, the models are seen through VR glasses. Moreover, the interaction with the objects visible in the scene uses a video game control. The system starts with the choice of DICOM images directory and the selection of the segmentation algorithm, indicating respective parameters, and with the help of the control it moves the objects, both in translation and rotation. Figure 9 shows the final user using the SIM3D system.
Authors such as Barajas et al. [35] recommend that for the study of software usability, the minimum samples must be bigger than or equal to 20. To validate the computer program, a study was conducted by interviewing 20 users, 10 participants are engineers and students of engineering, electronics, mechanics and computer science, and the remaining 10 are students of medicine and odontology. To perform the trial, we used a document with questions.

We used a document with ten questions, with nine closed questions and one open question. The questionnaire is easy to answer, and the questions are shown in Table 4. The survey design seeks to collect the perception of aspects of software quality. It also seeks to identify software support in the analysis of medical images. The questions are randomly distributed to avoid cognitive biases at the time of responding to the survey.
Table 4 Questionnaire
| Index | Question |
| P1 | Was it easy to make a mental representation of the tumor before using the software? |
| P2 | After using the software, was it easier to understand the two-dimensional images presented at the beginning of the exercise? |
| P3 | Are you satisfied with the scenes shown in the SIM3D application? |
| P4 | Is the degree of difficulty in detecting a tumor in medical images high? |
| P5 | During or after the experiment, did you feel any discomfort? |
| P6 | In general, are you satisfied with the navigability of the software? |
| P7 | Before, during and after finishing the test, were there any difficulties interacting with the SIM3D program? |
| P8 | Is the interface suitable for the application? |
| P9 | How do you rate the ergonomics of the software? |
| P10 | What do you think are the opportunities for software improvement? |
The protocol for the execution of the test was divided into three phases: induction, developing, and finally survey answering. In the introductory stage, we inform aspects related to the handling of the SIM3D software, then, each participant observes the images that later load in the computational application. The user must make an imaginative description of the tumor shown in the pictures. In the development stage, the participants must define initial parameters, a directory that includes the images and a cluster number. After that, they perform the following actions: first, move the visible objects in the scene, in the three dimensions, using the video game control (Joystick). Secondly, the head moves to adjust the position of the camera. Thirdly, they perform the incorporation or rejection of objects that uses the buttons in the application or the video game control (Joystick). In the final phase, they must answer the survey.
The participants gave their opinion using the five point Likert scale, where they can select: totally agree (TA), agree (D), neutral (N), disagree (ED) and totally disagree (TD). Question 10 is an open question in which they capture their opinion without limitations. Figure 10 shows the results of the questionnaire. We located in the abscissa axis the index of the nine questions that shows in Table 3. On the other hand, the ordinates axis represents the percentage of responses.
1) Visual perspective of medical images. As mentioned above, the survey is to evaluate the participants' judgment regarding the interpretation of medical images. After analyzing the data, we found that the reading of medical images, especially in the identification of a tumor, presents a high degree of difficulty, 60% totally agree and 15% agree. On the contrary, for 25% the interpretation is easy (see Figure 10. P1), perhaps, due to their medical training. Also, the 20 students -that is 100% of the surveyed people- ratify the difficulty to identify tumors in 2D images (see Figure 10. P4).
Although the results of the questions identified with numbers one and four testify the difficulty in the interpretation of 2D images (traditional method), the answers of the second question let us infer that the implemented application improves the perception of the information contained in medical images, since 80% completely agree, 15% agree, and only 5% remain neutral (see Figure 10. P2).

2) Perspective of the SIM3D software. User interfaces should be attractive, easy to use, functional, intuitive, among other features. The participants, directly and indirectly, declared aspects oriented to improve the perception of the interface. Users reported that approximately 12% strongly agree and 75% agree to the graphics and scenes of the application (see Figure 10. P3 and P8). The test confirmed that the designed interface is acceptable, and also that it can have several improvements.
Besides, the simplicity for the user to scroll through the screen and use the icons of the application makes it attractive to use. Questions six, seven and nine allowed us to obtain the perception of software navigability, and we found that 60% strongly agree, 25% agree, and 15% remain neutral (see Figure 10. P6). Functionality is a feature that makes the user feel comfortable when using a computational application, for which question seven was used, confirming that it is a normally operating system, since 80% fully agree, and 20% agree (see Figure 10. P7). Moreover, the observations of the ninth question confirm that the software is user-friendly, where 16 users that represent 80% of the surveyed students reported total agreement (see Figure 10. P9).
Using screens at a close visual range causes effects on the human body such as eyestrain, dizziness, nausea, among others. To determine any change in the participants, we asked about any discomfort presented during or after the test. Here, 15 % agreed (see Figure 10. P5), that is to say, 3 participants manifested some discomfort that could have occurred due to the effect of the lenses or, perhaps, to extremely rapid movements of the head. On the contrary, 85% reported finishing the experiment without any discomfort.
The open question allows the respondent to answer using their own words and reveal additional information about improvements to the computer program. There is a tendency to improve three-dimensional graphics, some of the answers were: "Eliminate pointed angles between faces"; "objects must be smooth surfaces"; "non-square graphics"; among others. There are also suggestions about the implementation of a security protocol to protect clinical information. Also, users showed interest in the application being multi-user.
IV. DISCUSSION AND CONCLUSIONS
The difference between the research presented by Indraswari et al. [36], Imai et al. [37], Maitra et al. [38] and Zhang et al. [39], and the one in this paper lays mainly in the methodology for presenting results, where, in addition to segmentation, a three-dimensional reconstruction algorithm is incorporated. On the other hand, solutions presented by Zhang et al. [40], Zhao et al. [41], Shen et al. [42], Holger et al. [43] show the data using three-dimensional reconstruction. The difference with the solution proposed in this paper is in the possibility of navigating three-dimensional reconstruction facilitating visualization from different perspectives.
In this article, we presented the design and implementation of the software named SIM3D, for the segmentation and generation of three-dimensional models based on multilayer medical images. The delimitation of the region of interest was performed using clustering algorithms (K-means) and the Delaunay triangulation algorithm was used to generate the 3D mesh, as a rendering engine for Unity 3D. The process was implemented in C++ programming language.
We evaluated the SIM3D application in three computers with different hardware resources, and Windows 10 operating system. The computer must have at least 4Gb available in RAM for proper operation. Other than the RAM, there are no significant changes in the three teams.
The evaluation of the program used MRI images from a patient diagnosed with primary glioblastoma. In the magnetic resonance imaging from the head divided in 24 sliders, the tumor is visible in slice 15 to 18. The k-means algorithm selected the region of interest (tumor), and generated three-dimensional meshes.
In the usability tests the participants were a group of multidisciplinary users such as engineering students, engineers, and medical students. The results show a great acceptance of the designed application.
As future work, it is proposed to optimize the mesh generation algorithm, evaluate using the operating system in real-time, use virtual reality glasses like those developed by Oculus VR, to estimate the performance of the application. Also, perform tests with a real-time source of images.

