


 English (pdf)
 Article in xml format
 Article references
 Send this article by e-mail
 Cited by SciELO
  Cited by Google
  Similars in
SciELO
Similars in
SciELO  Similars in Google
 Permalink
I. Introduction
Greenhouse gases (GHG) are a problem of great importance, since they give rise to climate change, which directly affects society [1] and leads to problems of droughts or floods [2]. For this reason, the study of greenhouse gases (GHG) is essential, gases such as carbon dioxide (CO2), methane (CH4) and nitrogen oxide (N2O), which are released into the environment either naturally or anthropogenically [3]. GHG concentrations in the atmosphere cause an alteration in the terrestrial climate system, either causing an increase or decrease in the Earth's surface temperature [4]. A reservoir is defined as a large body of water that covers a land surface and has been modified to produce hydroelectricity, supply drinking water, for irrigation in agriculture, among other purposes [5].
In the formation and emission of GHGs, one of the most relevant issues underlying the issue of reservoirs is the organic matter in the soil and the biomass of the plants that are flooded [6]. The aerobic / anaerobic degradation of organic matter produces carbon dioxide, which is reduced to methane in an anoxic environment, and is subsequently emitted into the atmosphere [7]. These systems are then forced to rapidly decompose all flooded organic materials in addition to the organic charge entering from the tributaries, producing CO2 and CH4 as the final decomposition product [8]. On the other hand, microorganisms require a source of energy and carbon, which they obtain from the degradation of the organic matter present in the reservoir and, additionally, from other constituents of the water in the tributaries such as nitrogen and phosphorous; in the case of aerobic systems, there are also high concentrations of dissolved oxygen in water [9]. Among the metabolic activities carried out by microorganisms, three cases are mainly distinguished [10]: aerobic systems occur when there is dissolved oxygen in the medium and, therefore, the microorganisms use it as an electron acceptor for the transformation of organic matter, resulting in a high energy level in generation, which is later used for cell growth [11]. For anaerobic systems, the final electron acceptor is CO2[12], as a result of this biological process, most of the organic matter is transformed to CH4[13]. Finally, in anoxic systems, the electron acceptor is usually nitrate, with the final result being the release of N2O or N2, depending on the behavior of the present microorganisms [14].
In this study, the generation of greenhouse gases and the factors involved in the transformation of organic matter were evaluated, based on aerobic and anaerobic degradation tests in batch reactors, using water from a tropical reservoir, and simulating the real conditions present in the reservoir before and after filling it.
II. Materials and Methods
The description of the methodology used in this study is presented below.
A. Sample Study and Collection Area
The samples for laboratory analysis were obtained from a tropical reservoir located in the department of Santander, Colombia; downstream of the Sogamoso river and upstream of the mouth of the Magdalena river [15]. This study focused on two strategic points of the reservoir: P1 that corresponds to the entrance of the Sogamoso river that constitutes one of the main tributaries of the reservoir, in addition to be the confluence between the Suarez river and the Chicamocha river. And the second point, P2, corresponds to the entry point of a creek that presents settlements of nearby populations. Additionally, prior to filling the reservoir, this area had livestock activity as its main use, which leads to the presence of a high load of organic matter, to a point that it generates a high degree of environmental interest. A total of 8 water samples were collected, 4 samples at each point, in the photic zone (20 cm from the water surface), during different times of the year; dry and rain. All samples were collected in plastic containers with a 10-liter capacity, in order to be transported to the laboratory of the Pollution Diagnosis and Control Group (GDCON), where they were refrigerated at 4ºC, and proceeded to the assembly of the reactors and other experiments.
B. Experimental Setup
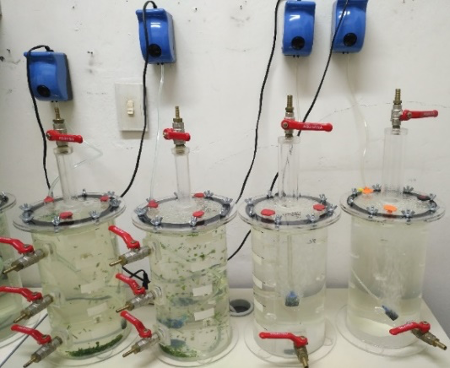
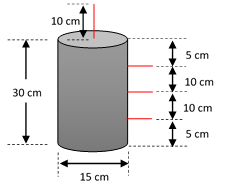
The experiments were carried out in 16 acrylic reactors; 8 for aerobic tests and 8 for anaerobes (Figure 1), with a useful volume of 5 L each and a height/diameter ratio of 2. For aerobic tests, each reactor had an air pump connected with aeration capacity 1200 cc/min and two fine bubble diffusers. The reactors had three quick-opening valves that allowed water samples to be taken, and an upper valve to collect the gas samples for analysis of CO2 and CH4 (every 5 days), using 0.25 L tedlar bags and an extraction pump. GilAir 3 model gases, with an operating flow from 850 to 3000 cc/min and also, avoided the loss of water by evaporation were used. The reactors operated for 200 days, at a temperature of 25°C, pH in the range of 7-8, and, for aerobic reactors, the dissolved oxygen remained > 4 mg/L.
For the experimental analysis, four reactors were used to evaluate the conditions of each sampling point, with water only and water with plant material, under aerobic and anaerobic conditions, both in duplicate. The plant material used was extracted from the protection strip of the reservoir and was composed of grass and leaf litter of different species, which were previously characterized, crushed, sieved at 0.5 mm and added in proportions of 3 g (wet weight) for each reactor, following the methodology described by Lopera et al. [16].
C. Laboratory Analysis
For the analysis of the parameters in situ, a WTW 3210 conductivity meter was used to measure conductivity, as well as an HQ40d multi-parameter equipment for the measurement of dissolved oxygen, and a WTW pH 7110 pH meter to read the pH. Additionally, the physicochemical parameters of Chemical Oxygen Demand (COD), Total Solids (TS), Volatiles (VS), Total Suspended Solids (TSS), Nitrates (NO3 -), Total Phosphorus in water, Total Nitrogen Kjeldahl (TNK), and Ammonium (NH4 +) in vegetal material, followed the analytical criteria of the Standard Methods [17]. For the determination of Dissolved Organic Carbon (DOC), the high-temperature combustion method was used, previously filtering the sample to be analyzed through a 0.45 µm Nylon membrane filter in 40 mL vials, which were previously muffled at an approximate temperature of 550ºC for at least an hour. Then, each of the vials were preserved at pH < 2 using H3PO4 phosphoric acid, to be read later on the Apollo 9000 total organic carbon analyzer. The carbon content in the grass and the litter was obtained by the product of dry biomass and organic carbon determined in the laboratory, using method B: Wet oxidation (Walkley and Black Method) of NTC 5403. All analysis were performed in the laboratory of the GDCON group, accredited for water analysis by IDEAM under NTC-ISO/IEC 17025, Resolution 1665 of July 12, 2011.
Gas samples were analyzed using an Agilent 7890B gas chromatograph with a three-valve system and two detectors with 1/8” packed stainless steel columns (HayeSep Q 80/100 UM 3Ft 1/8 2 mm), with 5975C mass detector for the determination of both CO2 and CH4. The chromatographic conditions were 100ºC for the oven temperature, 325ºC for the methanizer, and 1 mL of sample in the loop. As reference material, a mixture of certified standard gases (Matheson, USA) containing CO2 (2030 ppm v / v), CH4 (2000 ppm v/v), and helium was used as the equilibrium gas. Nitrogen was selected as a carrier gas during chromatographic separation. Retention times were 1,428 min for CH4 and 2,650 min for CO2. Finally, the CH4 results were converted to CO2eq multiplying by 28, according to the guidelines established by the IPCC [3].
III. Results and Analysis
The results found after experimentation with batch reactors are presented below.
A. Initial Characterization
An initial characterization of the water from the sampling stations P1 and P2 selected in this study was performed (Table 1). In the case of organic matter, P1 presented higher concentrations, compared to P2, with a COD concentration of 20.23 mg O2/L and a DOC concentration of 10.39 mg C/L, compared to concentrations of 16.0 mg O2/L and 9.90 mg C/L, respectively, for P2. On the other hand, a higher concentration of TS and VS in P2 was evident, with values of 242.6 mg/L and 56.4 mg/L, respectively, compared to P1, in which concentrations of the order of 142.0 mg/L of TS and 47.8 mg/L of VS were found. At both points, it is evident that there is a greater contribution of solids of an inorganic nature, which may be related to the mineral extraction processes carried out near the tail of the reservoir, which introduce a high content of this material in rivers and nearby sources. Additionally, regarding the TSS, values below the detection limit (< 5 mg/L) were reported in both cases, indicating a large contribution of dissolved solids and corroborating the aforementioned. It is highlighted that, in both sampling points, the trend is towards a slightly basic pH, with 8.1 and 7.6 for P1 and P2, respectively. This can be related to the contribution of nutrients at these two points, and especially in P2, where phosphorus total had a value of 0.38 mg P/L, while in P1 the concentration was lower (0.16 mg P/L). It is important to highlight that in P1 there are nearby settlements which can lead to detergent discharges or even contribution by agricultural fertilizers in nearby areas. These results contrast with the calculation of the quality index (ICA) of six variables [10], since in both sampling points the result was a regular water quality with a yellow indicator, being more polluted in this case P2 compared to P1, having the lowest ICA (0.59).
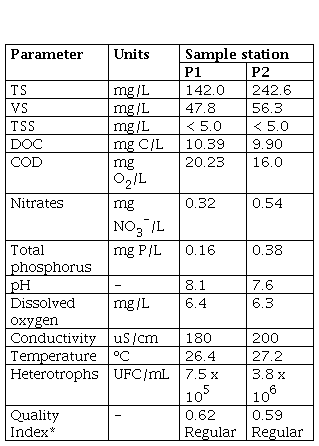
Finally, to verify the ratio of organic matter and nutrients necessary to promote the growth of both aerobic and anaerobic microorganisms, the COD/N/P ratio was calculated. For P1 the ratio was 100/2/0.5 (350/5/2) and for P2 it was 100/3/2 (350/11/7). Studies carried out by Escaler and Mujeriego [18], established that a ratio of 100/5/1 is usually optimal for carrying out aerobic biological processes, while Mata [19] determined an optimal ratio of 350/7/1 in anaerobe processes, indicating that anaerobic microorganisms have a lower nutritional requirement compared to aerobes, due to their high energy performance. Taking into account the above, at both sampling points (P1 and P2), the ratio of organic matter, nitrogen, and phosphorus significantly favors anaerobic processes, especially in P2. In both cases, there is a nitrogen deficit to carry out aerobic biological processes.
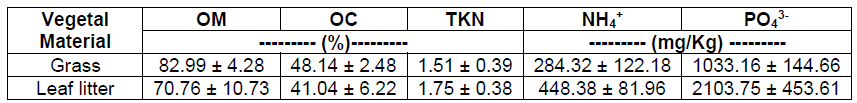
The initial characterization of the vegetal material (Table 2) was carried out on the grass and leaf litter, the latter being the leaves that fall from the trees and cover the soil. The percentage of both nutrients and organic matter was similar in grass and leaf litter, with values of 82.99% Organic Matter (OM), 48.14% Organic Carbon (OC) and 1.51% Total Kjeldahl Nitrogen (TKN) for the grass. Compared to the litter which had 70.76% of OM, 41.04% of OC and 1.75% of TKN, being in this case the OM and the OC slightly lower and the TKN slightly higher than in the grass. On the other hand, regarding the available nutrients, the litter presented higher concentrations than the grass, with values of 448.38 mg NH4 +/Kg and 2103.75 mg PO4 3-/Kg. Studies carried out by Aceñolaza et al. [20], suggest that the decomposition of plant material such as leaf litter constitutes the main source of nutrients supply in the soil, which constitute a fundamental part of the biogeochemical cycles of both carbon, nitrogen and phosphorus.
B. Degradation Kinetics of Organic Matter
Figure 2 shows the degradation process of organic matter in batch reactors for sampling point P1 (Figure 2a) and for P2 (Figure 2b), in both cases under both aerobic and anaerobic conditions. In the case of P1, with water only, the results showed that during the first days (0 - 42 d), the degradation rate was higher in the aerobic process compared to the anaerobic one. However, despite the fact that the anaerobic degradation was slower at the beginning, a greater degradation of the COD was reached at a time of 200 d (4.03 mg/L), compared to the COD in the aerobic process, which was 4.68 mg/L for this same time. These results indicate that the aerobic microorganisms in this case used a greater amount of initial energy for their growth, which led to a higher rate of degradation in the first days. On the contrary, for anaerobic processes, although growth could be less in the first days of degradation (0-42 d), they were possibly better adapted to the present conditions, which caused a greater degradation of the final organic matter. Additionally, the aerobic microorganisms could enter the endogenous phase later, due to using a greater amount of substrate in the initial days, as they had a greater amount of biomass and a smaller amount of substrate, which could limit the degradation process. Corrales et al. [13] defined that the maximum growth rate (mmax) for aerobic microorganisms was of the order of 7.2 d-1, much higher compared to anaerobic microorganisms, in which it was defined between 0.45 - 1.0 d-1. Additionally, the performance coefficient (Y) for aerobes was defined as 0.430 g SSV/g COD, and for anaerobes as 0.18 g SSV/g COD, which supports the ratio of degradation of organic matter, compared to the amount of biomass generated in an aerobic and anaerobic biological process. This would mean that, in an aerobic batch reactor having a higher Y, faster endogenous respiration conditions would be achieved, and this would limit the final degradation rate.
Regarding the results using water with vegetal material (VM), it was found that in both processes, during the first days, there was no degradation of organic matter. On the contrary, its concentration increased until day 21 for the aerobic process, and up to day 28 for the anaerobe, with maximum COD values very similar to each other; 25.20 mg/L in aerobic and 24.54 mg/L in anaerobic. After this, in both processes the degradation of organic matter began, until reaching a final value of 10.82 mg/L of COD at 200 d in the aerobic process, and 8.43 mg/L in the anaerobic one, a result that proves the above with respect to endogenous respiration in aerobic processes. The increase in COD concentration the first days is associated with the release of organic material contained in the grass and litter, by breaking the polymer chains, in this case. Tejada et al. [21] defined that this material contains structural polymers and soluble organic compounds such as sugars, amino acids, cellulose and lignin, which would explain the increase in organic matter caused during the first days in the degradation processes.
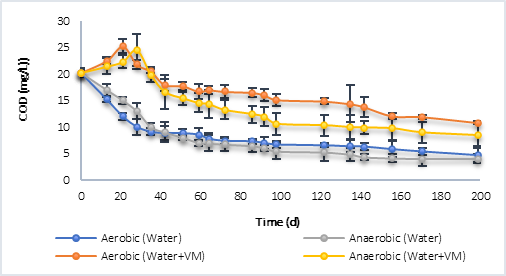
Fig. 2a Degradation of organic matter in terms of COD by aerobic and anaerobic processes. a) Behavior P1. b) P2 behavior.
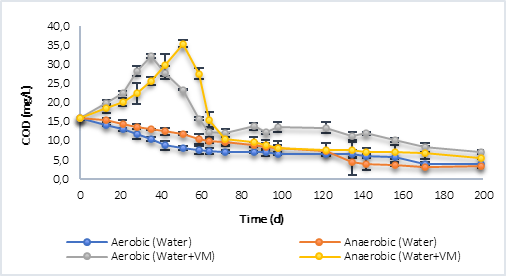
Fig. 2b Degradation of organic matter in terms of COD by aerobic and anaerobic processes. a) Behavior P1. b) P2 behavior
Finally, in the case of P2 (Figure 2b), the results were similar to those obtained with P1 where, for reactors with only water, the degradation of organic matter was greater in the aerobic process until day 122 and, after this, the anaerobic process achieved a lower final COD, with a result of 3.4 mg/L per day 200, compared to 4.0 mg/L in the aerobic process. For the reactors with water and plant material, the same behavior occurred as in P1, with an increase in COD at day 35 (32.30 mg/L) for the aerobic process and day 51 (34.43 mg/L) for the anaerobe. In the latter case, the COD reached a higher value indicating that the anaerobic process led to a greater decomposition of the polymeric compounds present in the grass and litter. The final COD was 7.00 mg/L in the aerobic and 5.51 mg/L in the anaerobic.
Table 3 shows the kinetic constants calculated from the degradation graphs in terms of COD, it is highlighted that in the case of processes with water plus vegetal material (VM), the constant (K) was calculated with the data from the beginning of the degradation process, that is, the process in which the COD increased as a consequence of the breakdown of the polymer chains contained in the litter, grass was omitted.
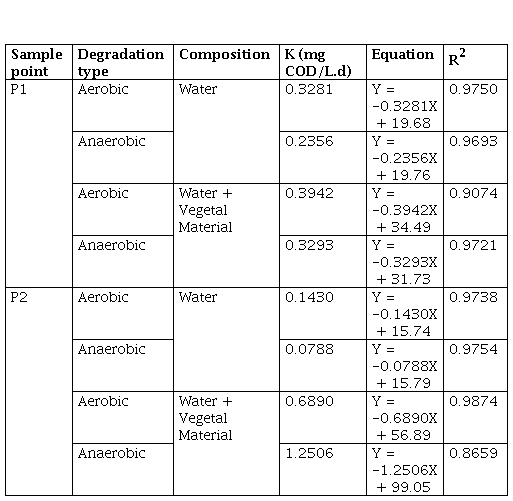
The results of the K corroborate what was previously mentioned, where the degradation rate was higher in the aerobic processes than in anaerobic ones, with the exception of P2 with water and vegetal material (VM), with K = 1.2506 mg COD/L.d in the anaerobic process, compared to 0.6890 mg COD/L.d for the aerobic process. In all cases, the degradation constant was greater where there was more plant material, which indicates that the initial increase in COD promoted the degradation processes aerobically and anaerobically, that is, in a reservoir, the flooded plant material changes the dynamics of both the microorganisms and the decomposition of organic matter that occurs naturally in the water, accelerating the process and increasing the rate of degradation.
C. Greenhouse Gases Emissions
Figure 3 shows the results of the greenhouse gases (GHG) collected in the reactors. CO2 was quantified in the aerobic process and both, CO2 and CH4, in the anaerobic. In both, P1 (Figure 3a) and P2 (Figure 3b), at the beginning of the anaerobic stage there is a slowdown in the process while strictly anaerobic conditions are established, that is, the generation of GHG during the first 30 days does not show a considerable increase. However, after this process, the increase in GHG is significant and greater compared to the GHG generated in the aerobic process, this situation is associated with the production of methane in the anaerobic process, which is a greenhouse effect gas that has a much higher warming potential than CO2 (28 times higher) [3]. The highest GHG values were obtained in P1, in the processes in which only water was evaluated, and in those where water plus plant material was evaluated. This was related to the initial concentration of COD available at the beginning of the process, with values 10.764 g CO2eq/m..d in the aerobic process and 12.296 g CO2eq/m..d in the anaerobic with water only, compared to 9.816 g CO2eq/m..d (Aerobic) and 11.816 g CO2eq/m..d (Anaerobic) for P2 under the same condition. In the case of the tests with water plus plant material, the results were 24.342 g CO2eq/m..d (Aerobic) and 35.210 CO2eq/m..d (Anaerobic) for P1, and 24.729 CO2eq/m..d (Aerobic) and 31.730 g CO2eq/m..d (Anaerobic) for P2.
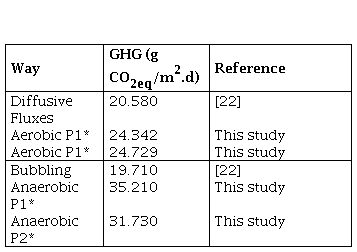
Comparing the results obtained from the CO2eq fluxes using water plus plant material, with the results reported by the IHA [22] (Table 4), it is found that, for reservoirs in tropical climate, the diffusive flows report values of up to 20.580 g CO2eq/m..d and 19.710 g CO2eq/m..d for bubbling flows. The former is more associated with aerobic degradation processes and the latter with anaerobic ones; in this study, the results were slightly higher, especially in anaerobic processes. Other authors such as Guerin et al. [23], have reported higher values, in the order of 37.80 ± 17.6 g CO2eq/m..d. In this sense, it must be taken into account that in the GHG emission there are not only temporal but also spatial variations associated with a reservoir, due to different causes, such as: temperature, type and density of vegetation flooded, carbon charges, among others.
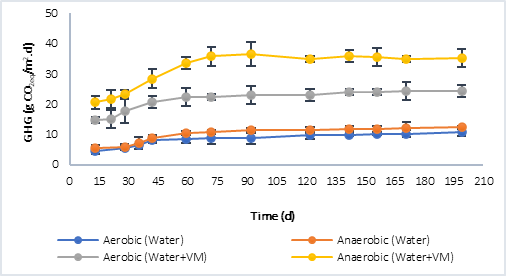
Fig. 3a Greenhouse gas (GHG) generation by aerobic and anaerobic processes. a) Behavior in P1. b) Behavior in P2.
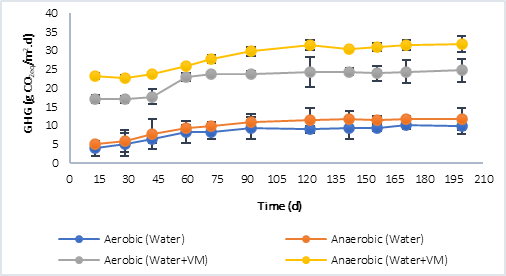
Fig. 3b Greenhouse gas (GHG) generation by aerobic and anaerobic processes. a) Behavior in P1. b) Behavior in P2.
D. Direct measurements
In order to evaluate the aerobic and anaerobic conditions present in each reactor and keep control over time, the measurement of the parameters in situ was performed, shown as an average in Table 5.
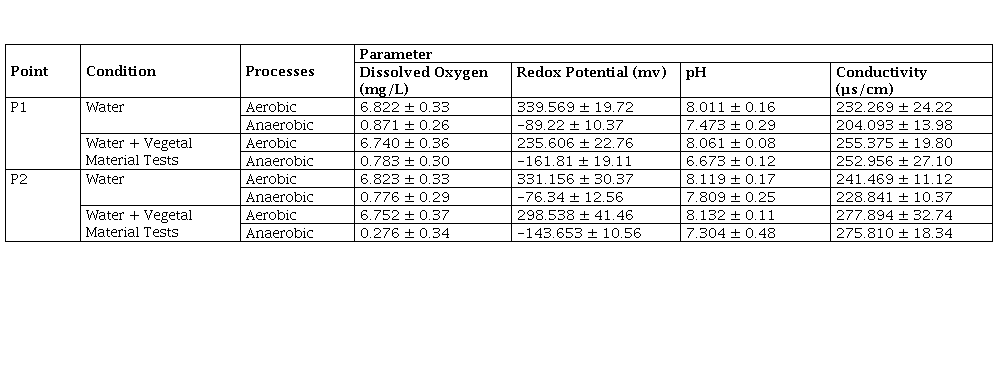
With regard to aerobic and anaerobic conditions, dissolved oxygen and redox potential made it possible to ensure the established conditions. In the case of aerobic processes, the dissolved oxygen values were all greater than 6 mg/L with higher values for conditions where there was water only (6.822 mg/L for P1 and 6.823 mg/L for P2), and slightly lower where there was water plus plant material (6.740 mg/L for P1 and 6.752 mg/L for P2). These results were also proportional at the redox potential where all values were positive and above 200 mV, ensuring aerobic conditions. In the case of anaerobic processes, the redox potential was negative, demonstrating much more anaerobic conditions in the case of water plus plant material, and the dissolved oxygens were all close to 0 mg/L. As for the pH, the aerobic processes were slightly basic with values above 8, while, in the anaerobic processes, a slight acidification was evident compared to the aerobic ones, with values between 6.673 to 7.809. This situation is a product of the anaerobic process in which the formation of volatile fatty acids takes place from the degradation of organic matter, which tends to acidify the medium. Additionally, the results showed an adequate environment for the development of both aerobic and anaerobic microorganisms, which have an optimal pH for their cellular development between pH 6 and 8. Finally, conductivity was higher in the processes in which water kept more plant material, associated with the transformation of organic matter to inorganic compounds, which leads to the release of ions in the medium that increase conductivity.
E. Variable Correlation
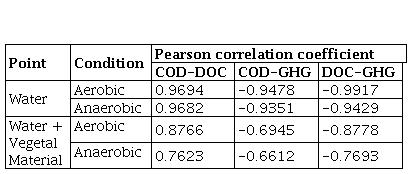
In order to determine the relationship between the most important variables analyzed in the reactors, a Pearson correlation coefficient analysis was performed between the COD, DOC and GHG variables (Table 6). The value of the linear correlation index varies in the interval [-1 to 1], allowing us to approximate the dependency relationship between two variables, one dependent on the other. A strong positive linear relationship between COD-DOC, that is to say a proportional correlation, and negative between COD-GHG and DOC-GHG, that is to say inversely proportional, was evidenced in both aerobic and anaerobic reactors with water. In the case of reactors with water plus plant material (MV), the correlation was moderate, obtaining the best correlations between the DOC-GHG. Comparing the aerobic processes with the anaerobic ones, the best correlations were found in the aerobic processes, indicating that anaerobic processes are more complex in their operation due to the fact that different microbial populations intervene and the metabolic path remains long, which results in highly complex products. Additionally, the plant matter contains highly complex organic matter, which generally requires a first stage of hydrolysis of the polymers or other types of breaking of polymeric bonds that occur more slowly due to the action of microorganisms, for which they require a period of time, acclimatization and adaptation.
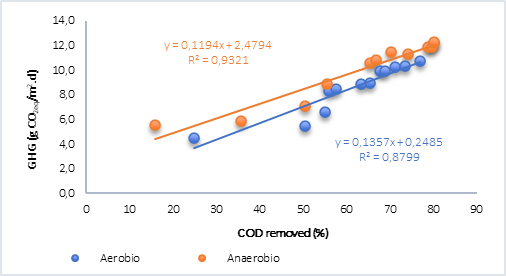
Finally, the behavior of the COD removed vs. GHG was plotted (Figure 4) and it was found that, for both aerobic and anaerobic processes with water only (Figure 4a), the relationship is linear and directly proportional. However, in the anaerobic process with the addition of plant material (Figure 4b), although the correlations are optimal, results were lower than the tests without plant material. In this regard, Ruiz et al. [15] found that the generation of methane in tests with water and plant material was explained using an exponential model and for CO2 using a linear model, which explains why there is no correlation between these analyzed variables, bearing in mind that in this case the greenhouse gases (GHG) calculated in anaerobic processes correspond to CO2 and CH4 in the form of CO2 equivalent.
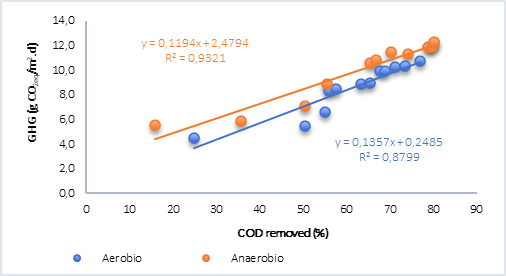
Fig. 4a Correlation of the removal of organic matter and GHG by aerobic and anaerobic processes. A) Water. B) Water + vegetal material.
IV. Conclusions
The plant material contained after the flooding process in a reservoir, is biochemically transformed in two stages; a first stage, where the polymer chains are broken and the COD concentration increases, and later, in a second stage, the process of degradation of organic matter begins. The greatest release of gases makes a greenhouse effect, especially through anaerobic processes, since the remaining organic matter is recalcitrant and not easily assimilated by microorganisms, at this point is when the stabilization process of greenhouse gas emissions begins. Additionally, the organic matter contained only in the water, which simulates the conditions of the rivers, also generates greenhouse gases, hence the importance of defining the baseline in reservoir construction projects, in order to quantify the net greenhouse gases that are attributable to the flooding process of plant material.

