


 English (pdf)
 Article in xml format
 Article references
 Send this article by e-mail
 Cited by SciELO
  Cited by Google
  Similars in
SciELO
Similars in
SciELO  Similars in Google
 Permalink
I. Introduction
Aquifers are territories which store and transmit water through their pores and/or fissures. These can be used by men to obtain economically profitable cashflows with different methods. The municipality of Zona Bananera is located on the aquifer region of the same name, where large volumes of water are extracted annually, mainly for irrigation of Banana crops, and for public and domestic supply through deep wells and cisterns. This intensive use has caused a continuous decrease in the dynamic levels of the piezometric surfaces in this area [1].
The regulation of the hydrological cycle in hydrographic basins depends on climatic factors, type of soils, geomorphology of the area, and vegetation. These characteristics determine the amount of water that runs off the surface after precipitation and the amount that infiltrates and subsequently contributes to groundwater recharge [2]. Direct methods are used to determine the infiltration capacity of the area, such as double infiltration rings and rain simulators, along with indirect methods, where the empirical model of the curve number is found [3].
The curve number (CN) method, developed by the United States Department of Agriculture (USDA) in 1954, is the most common method for estimating surface runoff. This can be estimated using equation (1) [4].
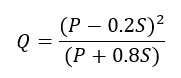 (1)
(1)
Where the runoff (Q) is a function of the rain sheet (P) and the maximum infiltration potential (S), expressed in millimeters. Potential infiltration depends on the cover conditions and soil type, estimated with the CN using equation (2). The CN has values that vary from 0 to 100, indicating the damage percentage to the infiltration process.
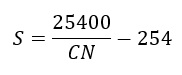 (2)
(2)
Curve number values reflect the effect on the infiltration capacity by factors such as soil type, antecedent moisture conditions, vegetation cover, and soil use practices. Tables containing CN values make it possible to transform qualitative information into quantitative information on the runoff behavior, which can also be used as an indicator of environmental impact [5, 6].
Worldwide, the CN method has been broadly implemented using remote sensing tools and geographic information systems (GIS) for various purposes. Using these techniques, Zabaleta et al. [7] analyzed the hydrological behavior of the surface in the lower basin of the tributaries of the Cauca, San Jorge, and Magdalena rivers in La Mojana region, North of Colombia, by estimating CN. Domínguez and Mercado [8] identified potential recharge areas of the Morroa aquifer in the Arroyo Grande basin in Sucre, Colombia; estimating the infiltration potential of the region [9]. Rajasekhar et al. [9] in a semi-arid area in southern India, identified suitable areas for the construction of rainwater harvesting works by calculating the region runoff potential. Baalousha et al. [10] estimated the rain contribution to groundwater recharge in an arid area, using a water balance where runoff was estimated with CN method; furthermore, Santhanam and Abraham [11] estimated the precipitation contribution to groundwater recharge in a 323 km2 basin in India using the water balance method. The objective of this research was to identify promising groundwater recharge areas in two micro-basins on the Zona Bananera aquifer, by estimating potential infiltration, implementing the curve number method, and using geographic information systems along with remote sensors.
II. Methodology
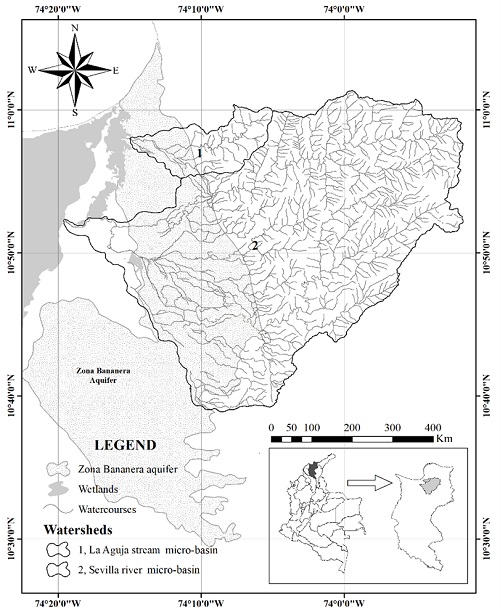
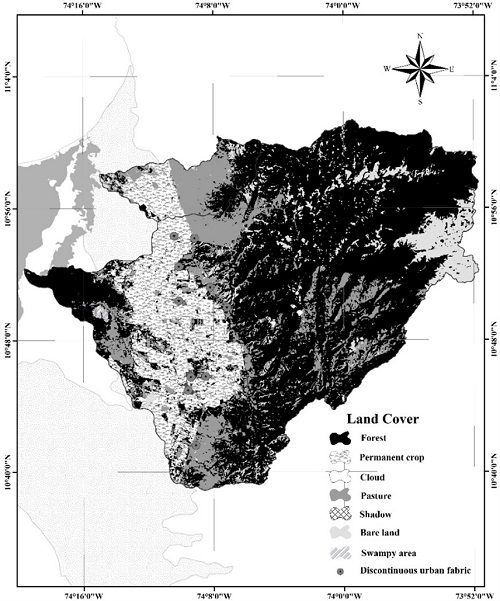
The study area is found in the municipality of Zona Bananera, Magdalena, Northern Colombia; corresponding to the Sevilla River micro-basin with an extension of 1086.5 km2, perimeter of 172.5 km, and a main channel length of 75.5 km; in addition to La Aguja stream micro-basin with an extension of 91.5 km2, a perimeter of 50.6 km, and a main channel length of 27.6 km (Figure 1). The study area shows average annual precipitation of 1112.7 mm with variations between 693.3 and 1532 mm, an average temperature of 28.1°C with a confidence interval between 27.3 and 29°C, and relative humidity between 78% and 83%. Approximately 290.5 km2 of the Sevilla river basin and 32 km2 of La Aguja stream basin intersect with the Zona Bananera aquifer.
A. Land Cover Determination
Land cover was determined by digital classification of satellite images using supervised classification for an atmospherically corrected Landsat 8 image, taken on January 22, 2019, and obtained through the United States Geological Survey (USGS) that contains the study area (https://earthexplorer.usgs.gov/), using the Corine Land Cover methodology adapted for Colombia by the Institute of Meteorology and Environmental Studies (IDEAM). The grouping of cover classes was carried out using the maximum likelihood algorithm, which, based on the "training areas" definition, groups the pixels with similar statistical information under the defined category or class. This algorithm is used for classification since it is the one that gives the most statistical validity to the classification [12, 13].
The Optimal Index Factor (OIF) was estimated for the choice of the combination of three bands with the best statistical separability out of a total of 120 possible combinations, using six bands (bands 2 to 7) on which the grouping was performed. The OIF was determined by equation (3) [14].
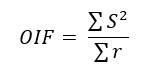 (3)
(3)
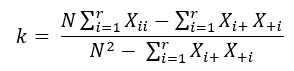
Where S2 is the standard deviation of each band and is the correlation coefficient between the three bands to be combined, obtained from the correlation matrix. The statistical evaluation was carried out using a confusion matrix, using the comparison between the area real conditions and the classification carried out, for which a stratified random sampling was performed ensuring that the adequately implemented classification represents the different cover types [15]. Parameters of producer's accuracy, user's accuracy, and overall accuracy of the classification were calculated, defined as the relationship between the sum of the main diagonal of the matrix with the total sampled points; and finally, the Kappa coefficient was estimated through the equation (4) established in Chuvieco [12].
 (4)
(4)
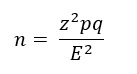
Where X𝑖𝑖 are the values of the main diagonal of the matrix, 𝑋𝑖+ is the marginal total of row 𝑖 ,𝑋+𝑖 the marginal total of column i, and N is the total of control points for reference. The minimum standardized value for acceptance of the mappable final product obtained by digital classification is 85% reliability or global accuracy. Congalton and Green [15] and Loya et al. [16] argue that the Kappa coefficient is the statistical parameter that gives greater reliability to the final classified product when it reaches a value greater than 0.8. Ariza [14] suggests choosing the minimum number of verification points using equation (5).
 (5)
(5)
Where 𝑛 is the minimum number of sampling points, 𝑧 the reliability factor according to the level of confidence in probability, 𝑝 the minimum number of hits, 𝑞 the highest number of errors 𝑞=1−𝑝 and 𝐸 the statistical error. The minimum number of points to be monitored was estimated considering a probability of 95%, a 𝑧 of 1.96 and an error of 5%, with a minimum of 85% correct answers and consequently 15% errors.
B. Hydrologic Soil Group (HSG)
The assignment of hydrologic soil groups was carried out through the textural classification of the soils types reported by the Agustín Codazzi Geographical Institute, as an official source of basic information, considering the suggestions of NRCS [17] and Mongil and Navarro [18], for the assignment of hydrological groups, taking as reference the soil finest textures, as they are the most limiting condition for infiltration.
C. Curve Number Assignment (CN)
The CN was estimated by performing intercept geoprocessing between the layers of hydrologic soil groups (HSG) and covers. To assign the corresponding CN according to the antecedent moisture condition of the study area, which is AMC III. Types of water cover, bare soil, and urban area were assigned a CN of 100, assuming a total impact on infiltration.
D. Hydrological Response of the Area
The potential runoff for maximum rainfall in 24 hours was estimated in order to analyze the area hydrological response, with information from the Tasajera station located at 10°58’36.5’ ’North Latitude and 74°21’42.1’’ West Longitude, for return periods of 2, 5, 10, 25, 50, and 100 years, estimated through the Gumbel probability distribution [19].
III. Results
The most relevant results obtained in the different stages of this research are presented below.
A. Land Cover
Determination of the land cover was carried out considering the discrimination of forest, permanent crops, swampy area, pasture, clouds, shadows, bare land, and discontinuous urban fabric. The optimal index factor with the highest value corresponded to the RGB 567 combination with a magnitude of 6567.97 on which the classes were grouped. With the validation of the classification using the confusion matrix, global reliability of 90.38% and a Kappa coefficient of 0.8552 were obtained; approving the results obtained in the classification.
The results of the supervised classification showed that 61% of the area of the Sevilla river micro-basin (66624.3 ha) is covered by dense forest, located mainly around the Sierra Nevada de Santa Marta, which is a protected area and with little anthropic action. The lower part of the micro-basin is covered by dense mangrove forests, which is typical of coastal wetlands. Banana plantations with an approximate area of 16,892.4 ha are mainly concentrated in the middle part of this micro-basin. Regarding La Aguja stream micro-basin, the predominant type of coverage is pastures with 41.8% of the area, equivalent to 3,823.6 hectares; followed by permanent crops with 27.1% (2477.5 ha) and dense forest with 25.8% (2362 ha). Figure 2 shows the spatial distribution of the covers identified in the study area.
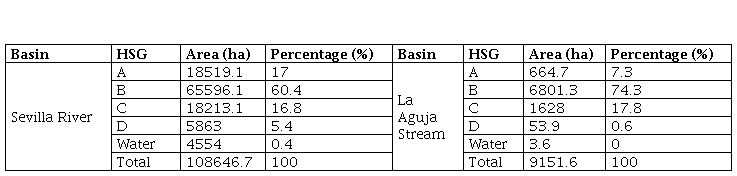
B. Hydrologic Soil Group (SHG)
Table 1 shows the hydrologic soil groups (SHG) for the study area. 77.4% (84115.2 ha) of the soils of the Sevilla river micro-basin and 81.6% (7466.1 ha) in La Aguja micro-basin were classified as SHG A or B; indicating that there is a low potential for runoff, as it favors infiltration.
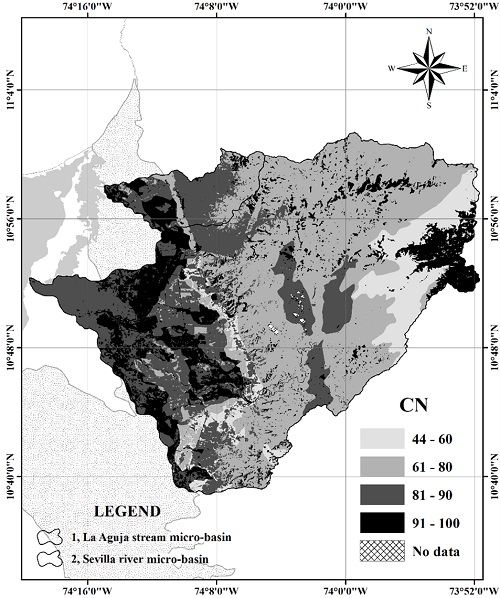
C. Curve Number (CN)
Figure 3 shows the spatial distribution of the CN for the study area. The Sevilla River micro-basin presents CN values lower than 80 in approximately 56.1% of its territory (60,868.7 ha), which makes it the area with the best conditions for the infiltration process; because of the interaction between cover types, management practices, and soil texture. La Aguja stream micro-basin presents CN values between 81 and 90 in 51.2% of the area, infiltration being affected in more than 80%, and CN values greater than 90 in 19.7% of the area; because the zone physical conditions do not favor infiltration, promoting surface runoff.
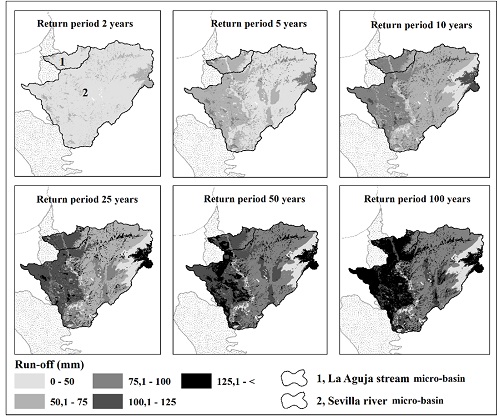
D. Hydrological Response of the Area
Figure 4 shows the spatial distribution of potential runoff for maximum rainfall in 24 hours with return periods of 2, 5, 10, 25, 50, and 100 years. For return periods of 2 and 5 years, a runoff between 50 and 75 mm predominates in the two micro-basins under study; indicating minimal risk of erosive effect in return periods of less than 5 years. Runoffs greater than 100 mm can occur in 5.3% of La Aguja stream micro-basin every 10 years, while in the Sevilla River micro-basin this occurs in only 9.7% of the area. For return periods of 25, 50, and 100 years, the runoff occurrence equal to or greater than 100 mm is expected in 67.7%, 71%, and 76.6%, respectively, of the area of La Aguja stream micro-basin, and in 33.2%, 43.7% and 48.6% in the Sevilla River micro-basin.
IV. Discussion and conclusions
Pasture cover does not favor the initial rain abstraction processes, generating a poor hydrological response in the area as high values of runoff occur; which corresponds to the research reported by [7, 8, 20]. Cover type is a determining factor in the value of the curve number; even when the textural conditions of the area favor infiltration, a better hydrological response is obtained by a dense forest cover than a pasture cover, since the initial abstraction is favored and the contact time between the water and the surface increases, therefore decreasing the runoff. This agrees with the results obtained by [5, 21, 22, 23].
Considering a CN of 80 as the limit value for an acceptable potential infiltration, it was found that 135 hectares in La Aguja stream micro-basin and 3,245 hectares of the Sevilla river micro-basin present favorable conditions to contribute to the recharge of the Zona Bananera aquifer; which is why these areas must be protected. The aquifer intercepts with the lower-middle part of the micro-basins, agreeing with the highest estimated CN values; which makes the implementation of forest restoration projects viable in these areas, therefore improving the potential infiltration capacity.
The highest values of potential runoff were obtained in the middle and lower part of the micro-basins, where the banana plantations are located. This agrees with the results obtained by Aladejana et al. [24] who found that the increase around cultivated land is strongly correlated with the increase in surface runoff and negatively, with the groundwater flow. This allows us to infer that the decrease in the infiltration capacity of the land is due to deforestation and changes in land use and coverage. Generally, the micro-basins of the study area present a good hydrological response to the rain-runoff process; but according to the results, the Sevilla river micro-basin presented the best conditions to favor water regulation and reduce the risk of erosion.
Interaction between the types of coverage, antecedent humidity, usage practices, management, and soil texture in the study area, expressed with a curve number value; allowed to establish areas with attributes to contribute to the recharge of the Zona Bananera aquifer, making it possible to estimate 135 hectares of La Aguja stream micro-basin and 3245 hectares of the Sevilla river micro-basin; which is why these areas must be protected. The extensive presence of permanent crops in the middle and lower part of the micro-basins was a determining factor in the higher values of the curve number obtained; indicating that anthropic intervention largely conditions the infiltration potential of the area. The micro-basins of the study area present a good hydrological response to the rain-runoff process; however, the Sevilla river micro-basin presented the best results, since runoff events greater than 100 mm, with return periods of 25, 50, and 100 occur in 33.2%, 43.7%, and 48.6% of the area; favoring water regulation and reducing the risk of erosion.

