


 English (pdf)
 Article in xml format
 Article references
 Send this article by e-mail
 Cited by SciELO
  Cited by Google
  Similars in
SciELO
Similars in
SciELO  Similars in Google
 Permalink
I. Introduction
Colombia is the main producer of coal in Latin America and the fourth exporter in the world, mainly to the Netherlands and Turkey with 30% of the total production, which is close to 80 million tons per year [1,2,3,4]. The characteristics of Colombian coals vary widely with the region of origin, and those from the north of the country (Guajira and Cesar provinces) account for approximately 90 % of the total production, being mainly used for power generation. The remaining 10 % of coal is produced in the Santander, Córdoba, Cundinamarca, Boyacá, Antioquia, and Valle del Cauca provinces, and is suitable for power, metallurgical and other industrial applications [2].
The traditional use of coal as a power source has recently been under scrutiny. The global trend in reducing greenhouse emissions, mainly in European Union countries, has promoted a reduced use of coal-fired power plants and their transformation into cleaner alternatives, as coal combustion is one of the main sources of carbon dioxide emissions. Other economies, however, still depend strongly from the production and use of coal and finding alternative technologies is of prime importance in economic, social and environmental terms.
In the last decade, coal and its derivatives have also been identified as an unconventional source of rare earth elements (REE) [5-6], which are critical raw materials for high technology industries such as fuel cells, mobile phones, high capacity batteries, permanent magnets, phosphors and metal catalysts [7-8]. The presence of REE in the organic constituents of coal (called macerals) depends on the geological regions [9], and is associated with volcanic ash deposits, characteristics related to the Colombian geography. Alternative applications of coals include their potential to be used as an adsorbent material, particularly anthracite due to its high carbon content and its structure of micropores, mesopores and macropores.
The wide range of Colombian coals in its different reserves where there are qualities ranging from subbituminous for power generation [10-11], bituminous for metallurgical applications, synthesis of chemical products and liquid fuels through pyrolysis [12], and anthracites as adsorbent materials [13]. For this reason, it is necessary to identify and integrate conventional and advanced characterization techniques to provide a fast and reliable analysis in order to determine the applicability of a particular coal. Traditionally, proximal analysis is the preferred technique for the technological characterization of coal and includes the determination of moisture, ash, volatile matter, and fixed carbon. This system serves well for the metallurgical and power generation industries, for which caking capacity and calorific value are of great importance. However, due to the potential for property overlap, the exact determination of the range must be more precise. An alternative to improve the characterization of carbons is through Scanning Electron Microscopy (SEM) analysis, where the diameter of the pores, the morphology of the surface and the stacking of layers related to the arrangement of carbon atoms are studied. This technique provides an in situ determination of macerals with a high level of detail, without the need for extensive sample preparation. Intimate organic associations can also be detected, providing important information for the carbon formation and utilization processes.
Coal can also be characterized more precisely using petrographic techniques based on the reflectance of vitrinite (% Ro) [1, 14], which is the most abundant and important maceral in coals, genetically formed by thermal alteration of the lignin and cellulose, where their properties vary with range. It is a component that provides information on the degree of metamorphism or coalification (range) of the carbon, measuring its reflectance.
%Ro can be estimated with light microscopy, however, because mineral matter is not always easy to identify under the microscope, the count may not be very accurate, in addition to the long analysis and preparation times of the sample. Raman spectroscopy is also a technique that can be used to quantify% Ro, with the advantages of easy sample preparation, non-destructive micrometer-scale characterization, short sampling times, and low energy consumption. Vitrinite reflectance has been used as a reliable indication of the thermal maturity of coal [15]. Zhang and Li [1], have proposed an easy and fast method to determine the coal range by means of Raman Spectroscopy using samples with% Ro previously analyzed with traditional petrographic techniques, which were correlated with RBS, FWHM-G and AR obtained from of Raman spectra.
The objective of this work was to characterize three Colombian coals with different maturity, using samples of anthracite, semi-anthracite and bituminous coals with 96.6%, 78% and 72% carbon, respectively. Scanning electron microscopy (SEM) allowed to correlate the morphology of the stacked layers with the range of the carbon, X-ray energy dispersion spectrometry (EDS), allowed the determination and mapping of the atomic composition and Micro-Raman spectroscopy to estimate the % Ro.
II. Materials and Methods
Three coal samples from three different locations in Colombia were selected to be studied, and their analysis were performed following the ASTM D 388-2012 standard. A first sample from the Páramo del Almorzadero region in Santander Province, north-east of the country, with 96.6% fixed carbon (FC) content, dense, exhibited high hardness, semi-metallic black colour, low thermal expansion, the same as low ash and moisture content, being classified as an anthracite-type coal. A second and third samples, both from the Amagá District in Antioquia Province, central part of Colombia, had 78% and 72% FC respectively, fragile and grayish in colour. Initial classification of these two samples showed, in the first case, a correspondence to a semi-anthracite to bituminous low volatile -type coal and a bituminous medium volatile -type coal, in the second. In order to differentiate them, and for simplicity, the samples were therefore named in the results as anthracite, semi-anthracite and bituminous, respectively.
Morphological and chemical analyses were performed with a Carl Zeiss EVO MA10 SEM scanning electron microscope and an acceleration voltage of 25KV. Images were acquired in a magnification range of 500X to 5000X with a resolution of 1024x884 pixels. A series of high-resolution SEM images of the coal samples were captured at a working distance of 8.5mm. A 10 mm2 solid state Oxford brand X-ray EDS detector was used to obtain a semi-quantitative assessment of the coal constituent elements, in selected areas of analysis. The characterization was carried out in both specific mode with 3 points of interest and in mapping mode to determine the distribution of the elements in the selected areas. Composition mapping was presented in pairs for each coal sample with three different elements on each map.
A Horiba Jobin-Yvon LabRam Raman Confocal Microscope, equipped with a solid state 532nm laser, was used in order to determine the characteristic spectra and the respective spectral bands of interest in each sample, with the following operating conditions: 50mW power, set at 1% sample surface, 12-second acquisition time, 10-second accumulation time, and a 50X microscope objective focused on a laser area between 2μm and 20μm in diameter on the macerals selected for the analysis. Spectra were acquired using a 600 gr/mm grid. The swept spectral range was 500–2500 cm–1.
The reflectance of vitrinite (%Ro) was evaluated by fitting the curve of the Raman spectra using the deconvolution method with the second derivative, which allows to find precise information on the adsorption bands. The correlation between the carbon percentage and the Raman characteristic parameters for %Ro were analyzed following the methodology proposed by Zhang and Li [1]. The best correlation terms were used to construct a set of equations coupling the position parameters of the D and G peaks (RBS), G bandwidth (FWHM-G, Full Width at High Maximum for G band), the slope of the fluorescent background (b), and the integrated area of the Raman spectrum (AR), as expressed by Equations (1), (2) and (3), respectively.
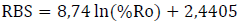 (1)
(1)
 (2)
(2)
 (3)
(3)
Raman spectra were processed using a commercial statistics analysis program. The adjustment of the curves was made in the spectral range of 800 to 2000 cm–1. A spectrum baseline procedure was carried out, selecting for this the spectral region where the characteristic D and G bands were located, to which a deconvolution procedure with the second derivative was then performed achieving a convergence to the Lorentzian function with the best R2, in order to obtain the RBS, FWHM-G and AR parameters.
III. Results and Discussion
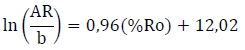
Figure 1 shows the SEM images where the main morphological features of the three coal samples used in this study can be seen. Figures 1(a), Figure 1(c) and Figure 1(e) correspond to images at relatively low magnifications (600X), and Figures 1(b), Figure 1(d) and Figure 1(f) correspond to those at higher magnifications (2,400X and 4600X). The sample of anthracite, Figures 1(a) and (b), exhibited a relatively smooth surface with a pattern of exfoliation or stacked layers, whose laminar texture can be associated with a most ordered carbon structure. This material presents a microporous type structure, with pores in the range between 0.7 µm and 0.8 µm. In general, this sample presents a structure which is denser than that of the remaining samples due to the atomic arrangement shown. The sample of semi-anthracite coal in Figures 1(c) and (d) also presented a layer stacking morphology, with an evidently rough surface, but a less ordered structure than that of anthracite. Pore size measured by SEM in this sample was between 1.3 and 1.5 µm. In the bituminous coal sample, seen in Figures 1(e) and 1(f), a rougher and lumpier surface was observed with no evidence of a layer stacking morphology as in the precedent samples. This is probably due to the low ordering of the atomic structure of carbon and the presence of a higher content of volatile material. Pore sizes in this coal sample were smaller than those of anthracite and semi-anthracite, ranging from 0.2 µm to 0.7 µm. The attempts made in this investigation to identify the macerals were referred to the use of EDS mapping of each sample, which allowed for the determination of chemical composition in specific surface areas of the samples.

Fig. 1. SEM images of three Colombian coal samples. a) and b) anthracite, c) and d) semi-anthracite, e) and f) Bituminous.
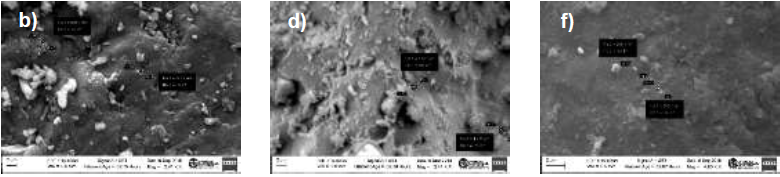
Table 1 shows the results of the elemental composition of each type of coal obtained by SEM-EDS analysis. In this Table, it is noticeable the presence of organic sulfur, whose weight percentage increases with carbon content, in addition to the presence of inorganic elements such as aluminum, iron and silicon that are generally found in the macerals forming aluminocarbonate compounds, aluminosulfates and probably quartz, plagioclase, siderite, pyrite, goethite and hematite [16].
Figure 2 shows the element distribution maps of each type of coal, as determined by using the EDS detector and the INCA analysis software. Table 2 shows the details of the colour code used to present the information in Figure 2 for the anthracite, semi-anthracite and bituminous coal samples. A comparison of Figures 2 (a), (c) and (e) indicates a clear decline in oxygen-containing phases for the lower rank bituminous coal sample with respect to the anthracite-type counterparts. It is also evident the lower content of carbon for the sample with the lower degree of maturity, bituminous sample, in Figures 2 (e) and (f). No conclusive trends can be stated for the remaining elements, but it is also clear a lesser content of silicon in the bituminous, lower rank coal sample.
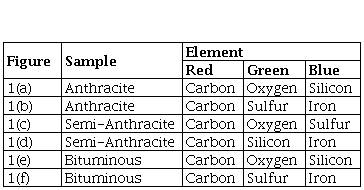
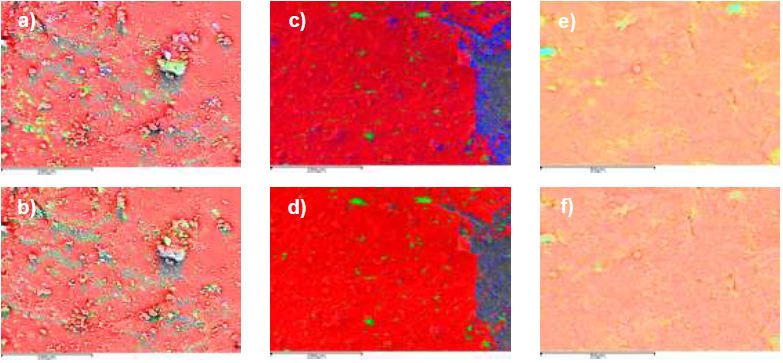
Fig. 2. Element distribution maps of each coal sample. a) and b) anthracite, c) and d), semi-anthracite, e) and f), bituminous coal.
Figure 3 shows the Raman spectra of the coal samples and the respective deconvolution after fitting using the second derivative method. A total of three spectra for each sample were obtained. In Figure 3(a), the spectrum without deconvolution processing for each coal sample have been summarized. As it can be seen, there is an important influence of fluorescence in the case of the lowest rank coal (bituminous). The processed spectra are shown in Figures 3(b), 3(c) and 3(d), in which clear characteristics for each type of coal can be identified. The Raman spectrum of organic matter is composed of two regions: a first order region (1000 to 1800 cm-1), and a second order region (2400-3500 cm-1). In coals, the first order region is the relevant one, and it comprises two main peaks: the disordered band D (at about 1340-1360 cm-1) and the graphite G band (around 1580 cm-1). It is normally observed that, in low maturation coals, Raman spectra show a very weak, irregularly shaped D band with a steep slope or background. This is attributed to interference from strong fluorescence in the lower rank (less mature) coals [1]. Eventually, for the highest rank (more mature) coals, D band will split from G band, and both become sharper, intense and better defined. The width of D and G bands also decrease with the increase in vitrinite reflectance. In this work, G band was predominant for all coal types, as it can be seen in Figures 3b through to 3d. On the other hand, the separation between the G band and the D band was also larger for the highest coal range, as it was the respective intensity of the peak. The D bands are associated with chemical and structural defects in the crystal lattice; as the temperature increases, the chemical defects are removed from the crystal lattice and the carbon reorganizes into a more ordered carbon structure, until it reaches the stage of metamorphism where the carbon residue is transformed into perfectly ordered graphite [15]. Following from the former discussion, the spectra from the anthracitic coal samples examined in this work exhibited the typical behaviour expected for a high rank, high level of maturity coal, with an excellent fit for a second derivative approach. On the other hand, the bituminous-type sample presented a less defined fit for both bands, D and G, which was related to a lower maturation level (range) and the increased difficulties for fitting the curve following the deconvolution, as it was mentioned above.
The necessary parameters for the calculation of vitrinite reflectance (% Ro) were derived from the linearization procedure that relates the terms RBS, FWHM-G and AR with %Ro using the regression of equations (1), (2) and (3). Once the spectra for the anthracitic samples were processed, the following two equations (5) and (6) were derived in order to calculate %Ro for anthracite and semi-anthracite, respectively. In this case, equation (3) from the model by Zhang and Li [1] was omitted because the spectra did not show noticeable changes in slope at the beginning nor the end of the spectra. In other words, equation 6 takes into account the presence of fluorescence, which is more likely to occur in the analysis of low rank, bituminous carbon. Table 3 summarizes the results of the parametrization obtained from the Raman spectra, the calculated %Ro and the percentage of carbon determined by EDS analysis. The result of FC by ASTM analysis of each sample is also included with the purpose of comparison.
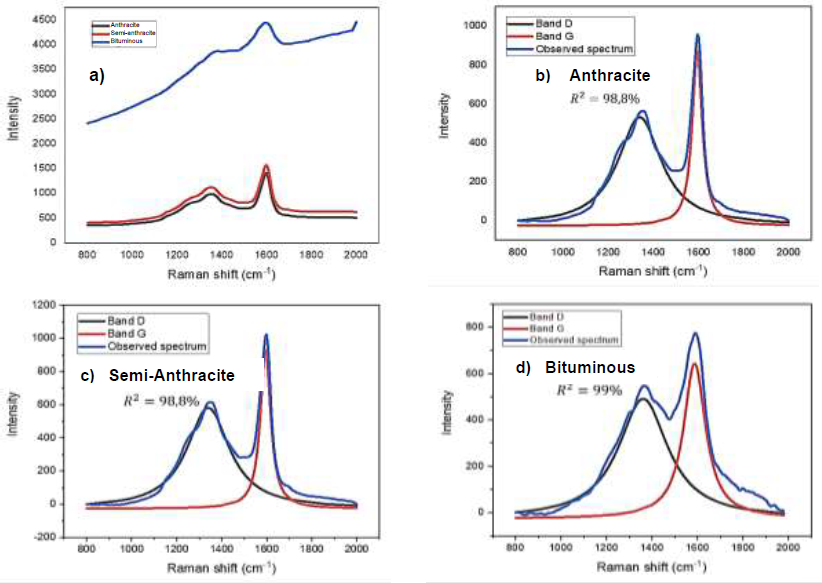
Fig. 3. Characteristic spectra of the Raman bands obtained from anthracite, semi-anthracite and bituminous coal samples, fitted to the curve of the Raman peaks in the area of 800–2000 cm-1 using the second derivative method.
 (5)
(5)
 (6)
(6)
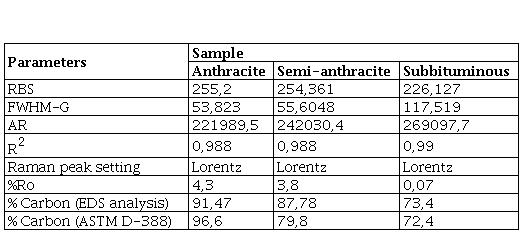
As can be seen from the results in Table 3, the content of carbon (FC) determined by EDS corresponds very well with the results of ASTM analyses. The results of vitrinite reflectance for the anthracite and semi-anthracite samples are much higher than those for the bituminous coal, as expected, and compare well to values reported in the literature. It is worth mentioning, however, that this parameterization method for values of reflectance above 3.5, can introduce inaccuracies due to the fact that the spectra do not show noticeable slope changes as it was previously mentioned. In this work, however, a modification of the method is proposed in order to achieve a better fit in highly mature, anthracite type coals (FC>98%), by the use of Equations (5) and (6). Raman spectroscopy is generally more sensitive for maturity changes in low-carbon coals, which typically have %Ro <1. In the case of the bituminous-type coal studied in this work, an extremely low value of vitrinite reflectance resulted from the application of the model. This demonstrates that the model adjustment is not applicable to lower range coals, probably due to fluorescence interference in low rank coals or as a consequence of fitting defects from the deconvolution method. As it was shown in Figure 3(d), this sample presented a broadening of both bands D and G, which could lead to a significant lack of correlation between band width and band intensity. Oxygen/carbon ratios were also reduced in this sample type, as shown in Figure 2, and this factor could also be related with the molecular structure of organic matter in coal, an aspect which could deserve a more detailed investigation.
IV. Conclusion
In this research, a combination of Scanning Electron Microscopy (SEM), Spectrometry of energy dispersion of X-ray (EDS) and Micro-Raman Spectroscopy analyses was used for morphological, chemical and vitrinite reflectance determination in three samples of high and medium rank Colombian coals. A modified model was proposed, based on the method developed by Zhang and Li, applicable to high maturity, anthracitic coals, which would definitively allow a rapid, simplified method for the analysis of this coal types. The vitrinite reflectance percentages obtained in this work confirmed the existence of an important relationship between %Ro, the carbon content, the height of the peak of the G band of the Raman spectrum and the respective mean width of the band G. By comparison with a lower rank coal, it was shown that the reflectance values depend on the degree of graphitization of the carbon and its level of structural ordering.

