


 Inglés (pdf)
 Articulo en XML
 Referencias del artículo
 Enviar articulo por email
 Citado por SciELO
  Citado por Google
  Similares en
SciELO
Similares en
SciELO  Similares en Google
 Permalink
I. INTRODUCTION
The vast majority of cities in the world are growing in the number of inhabitants at an unprecedented pace [1]. This requires, among other things, urban transport solutions that can be quickly implemented and allow efficiently transporting large volumes of passengers. Massive passenger transport systems (MPTS) or Bus Rapid Transit (BRT) Systems have proven to be a viable solution to the growing demand for public transport and the current problems of mobility [2][3][4][5].
The implementation of the MPTS involves complex design and programming problems, among which are the design of networks and transport routes, frequency programming, and schedules scheduling, which are part of a global problem called "Transit Network Design and Scheduling Problem" (TNDSP) [6][7]. Solving these problems generally involves the use of modeling and simulation tools that allow evaluating the impact of changes in the system to make more appropriate decisions to improve the service.
In the market, there are different modeling and simulation tools, including ARENA® Simulation Software [8][9][10][11]. A commercial tool to model the operation of any system based on the concept of discrete events and supported in SIMAN [12][13] to perform the simulation. ARENA® acts as an automatic SIMAN code generation tool. However, its use brings two drawbacks. On the one hand, the high licensing costs, which can directly affect the viability and start-up of a project, and on the other, the fact that it requires very specialized knowledge to make the models.
Modeling a full MPTS in ARENA® can become a complex task because, being a general domain tool, it uses abstract modeling elements that are difficult to relate to real-life objects, and even more so with specific elements of an MPTS (Buses, Stations, Passengers, Intersections, among others). This was the impulse behind the creation of a specific tool (ModeLab), whose interface includes an iconic language (icons and objects) directly related to the form and behavior of the objects in the actual MPTS, which saves time as it facilitates to designers and experts the construction of the models. In addition, this software is free to access (download at http://www.unicauca.edu.co/~ccobos/ModeLab/ModeLab.rar), with which licensing costs are eliminated. To show the advantages of ModeLab, the complete model of the Megabus MPTS (Pereira, Colombia) was performed, both in ARENA® and in ModeLab, to compare the complexity of the models and assessing the simulation results to be equal when working with the same system and with the same parameters.
Next, in Section 2, the Megabus MPTS is summarized. Then, in Section 3, the Megabus model made in ARENA® is presented, giving some basic details required to understand it. Section 4 introduces ModeLab and the Megabus model obtained with this tool; it also shows the advantages of ModeLab compared to ARENA® in the modeling of MPTS. Finally, the article presents the conclusions of the work and what the research group expects to carry out soon.
II. DESCRIPTION OF THE MEGABUS SYSTEM
Megabus is the MPTS of the metropolitan area of western central Colombia. It connects the municipalities of Pereira, Dosquebradas, and La Virginia located in the Department of Risaralda. This MPTS began its operation on August 21, 2006, and has quickly acquired broad recognition worldwide as an example of MPTS implemented in medium or intermediate cities. In Megabus, the feeder buses are responsible for transporting passengers from Dosquebradas and La Virginia as well as the surrounding neighborhoods of Pereira to the exchangers. Here, the passengers are transferred towards the articulated buses which travel the system by using the exclusive or dedicated lanes.
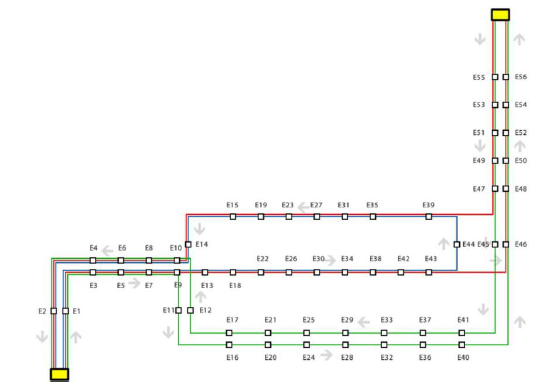
The elements that make up the Megabus MPTS include Bus depots, points in the system where the departure and arrival of articulated buses are controlled and the routes that make the journey through the system are managed; Stations (bus stations), facilities within the system where passengers enter or leave the system or where they board or disembark from buses (double stations allow passengers to transfer from a bus that goes in one direction to another, and the simple ones that only have mobility in one direction); Routes, which determine the entire journey of the buses; in the case of the trunk routes, these determine only the journey of the buses between the stations; Buses, the vehicles with the ability to transport a maximum of passengers; in the case of articulated buses, these only go by exclusive lanes making stops between stations; Intersections, points of road infrastructure and transport where the road is divided into two or more paths; and Journey time, which corresponds to the time it takes a bus to go from one station to another. Fig. 1 shows an abstract and complete model of Megabus.
III. MODEL OF MEGABUS IN ARENA®
ARENA® stands out for its versatility to model several domains, a relatively low learning curve and a high level of interoperability with other applications using the SIMAN compiler and simulator. Different ARENA® modules were used for the Megabus modeling, namely:
Data modules, which allow defining storage structures necessary for the implementation of the simulation. They include entities (people, objects, etc.), attributes (a common feature of entities), and variables (global to the system and accessible by all modules).
Workflow modules (Fig. 2 shows the icons of these modules in ARENA®), which perform actions in the data blocks. These have access to the variables at any time of the simulation and the attributes of an entity at the time that this entity passes through them. They include Create (starting point of entities), Dispose (endpoint of entities), Process (main processing method in a simulation), Assign (used to assign values to the variables, to the attributes of the entities, to the types of entity or system variables), Decide (allows making decisions within the simulation), Record (used for the collection of statistics), Delay (used to retain entities during a specific amount of time), and Hold (useful to simulate queues).

In ARENA®, it is possible to create sub-models, which correspond to blocks that allow grouping multiple modules in a package of macro functionality. These sub-models may have zero or more inputs and zero or more outputs. They facilitate the expansion and maintenance of simulation models while improving visual presentation.
To model Megabus, it was required to define a list of global variables such as the number of stations (N), the number of routes (R), a vector to record the frequency with which the buses are dispatched for each route (RouteIntervals), a vector with the maximum number of buses that are dispatched for each route (RouteMaxBuses), a vector with the time of the simulation from which it begins the dispatch of the buses for each route (RouteTimeStart), a size vector [R, N] that defines the journey of each route through the stations, a vector that indicates the maximum number of passengers that arrive through each station (MaximumPassenger), a string-type matrix of size [N, 4] whose rows store the function of the probability that a passenger at station N is directed to any of the other N-1 stations possible (ProbabilityDestination), and a string-type matrix of size [N, N] that stores the shortest routes to move from one station to another (ShortRoutes), among others.
The Bus entity was associated with the route (Bus.Route), an identifier (Bus.Id), the total capacity of the bus (Bus.TotalCapacity), and the number of passengers carried at any given time (Bus.Capacity).
The Passenger entity was associated with several attributes: Passenger.Time, the time it takes a passenger in making their journey within the MPTS; Passenger.Stop indicates the following station to which the passenger (destination or intermediate) is directed; Passenger.Bus indicates the identifier of the bus in which a passenger is traveling; Passenger.Route represents the route that the passenger boards; Passenger.Journey stores the journey that the passenger has made at an instant N of time; Passenger.TotalJourney stores the total journey that the passenger must perform to reach their destination; Passenger.Destination indicates the destination station where the passenger is directed; and Passenger.Origin indicates the station of origin in which the passenger starts their journey.
The Bus Depot, due to its complexity, was organized as a sub-model having the following modules: Route N (Create), in charge of the creation of buses for a route and the control of the output intervals and the maximum number of buses that are dispatched; Assign Route N (Assign), in charge of assigning the respective route to the buses that go through it; Initialize Route (Assign), which assigns the identifier to the buses and sets the values of Bus.Capacity and Bus.TotalCapacity to the bus; Empty Bus (Decide), which allows controlling that buses do not arrive with passengers to the depot, otherwise there would be an error in the configuration; Bus with Passengers (Hold), which allows assessing the reason why an event was presented in the empty bus module; and Exit of Buses (Dispose), which is the module where the buses terminate and are deleted from the simulation. Fig. 3 (a) shows the sub-model of the Bus Depot defined for the Megabus model. Although in real life in a station, both buses and passengers converge, in the model carried out it was necessary to separate both logics in order to facilitate the reading of the model. However, these stations act in a synchronized manner to simulate the operation of a real station. Between a single passenger station and a double one, there are differences so that they are represented with two separate sub-models.
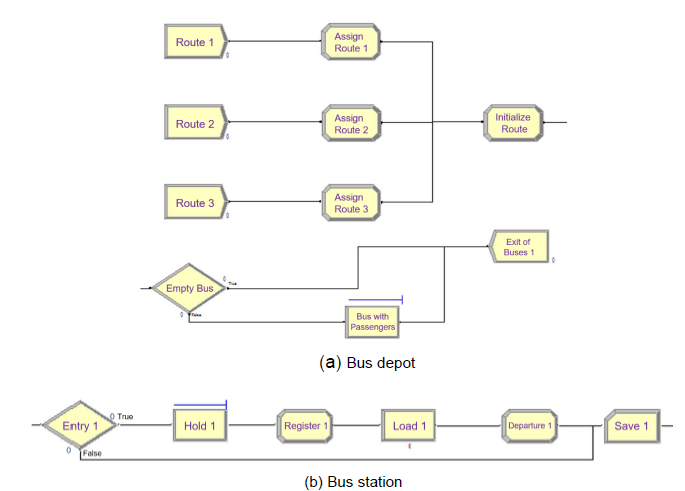
The Bus Station was organized in a sub-model that does not differentiate whether it is single or double. This sub-model has the following modules: Entry (Decide), which validates whether the bus that reaches the station enters or continues its route to another station; Wait (Hold), which is responsible for queueing the buses that are coming to a station in case the station is busy; Register (Record), which registers the entry of a bus to a station; Load (Process), which allocates the bus a fixed time that simulates the loading and unloading of passengers; and Departure (Assign), which records the bus departure and assigns the new capacity to the bus after having collected and dropped off passengers, and it is informed that the station is free to be occupied by other buses. Fig. 3 (b) shows this sub-model.
The single passenger station is composed of the modules of Passenger (Create), in charge of the creation of passengers at each station, controlling the arrival intervals and the maximum number of passengers arriving at a station; Destination (Assign) assigns through a probabilistic function the destination station for each passenger. From this point begins the measure of the time a passenger spends within the MPTS; Stop (Assign), which assigns the shortest passenger’s journey or journeys to their destination -this is based on the matrix of ShortRoute previously introduced-; Board (Decide), which queries whether the bus that arrived at the station goes through the destination station or is a stop for the passenger, and whether the bus can transport them -if the answer is positive, the passenger passes to the "Boarding" module; in the opposite case, the passenger goes to the "More Options" module-; Boarding (Assign), which assigns the passenger the route and the identifier of the bus in which they are going to take their journey, as well as the stop or destination they have according to the bus route they have chosen, and reduces by one seat the available passenger capacity of the bus; More Options (Decide), which verifies whether the passenger has more options to take their route -if the answer is positive, the passenger passes the "Next Option" module, otherwise, they go to the "Wait for another bus" module-; Next Option (Assign) is responsible for assigning the following travel options to the passenger to allow them to evaluate all their travel possibilities against another bus; Wait for Another Bus (Hold), which queues a passenger if they cannot board the bus that is at the station (there is no room or it is the wrong route) until the bus leaves the station; Arrival (Decide), which consults whether the passenger arriving has the present station as their destination or a stop -if the answer is positive, they go to the "Disembarkation" module, otherwise, they continue their journey-; Arrive (Decide) queries whether the current station is the destination of the passenger or is a stop on their route -if it is the destination station, the passenger leaves the MPTS; if the contrary, they are directed to the "Stop" module where the next stop that can be another stop on their journey or the destination station is calculated-; and Exit (Dispose), which emulates the exit of the MPTS passengers.
The Double passenger station has two entrances and two exits. The additional entrance and exit models the transfer of a passenger from one station to another. The modules added to single passenger stations are two: Re-entry Point (Decide) queries whether the next passenger stop is the adjoining station -if so, the passenger passes to the "Travel to E#" module; otherwise, they wait for the bus at the station-; and Travel to E# (Assign), which saves in Passenger. Total Journey the change of station made by the passenger. Fig. 4 shows this sub-model.

A Travel and time sub-model composed of the following modules was also developed: Travel EA to EB (Process), which simulates the travel time that passes from traveling from Station A to B; Bus from EA to EB (Hold), in charge of queueing passengers waiting for a bus to reach the next station (Station B); My Bus from EA to EB (Decide), which asks whether the bus that arrived at the next station (Station B) is the bus in which the current passenger is traveling -if so, the passenger advances on their journey to synchronize their position with the bus; otherwise, the passenger goes to "Another Bus from EA to EB"-; and Another Bus from EA to EB (Hold), which queues passengers until the bus in the next station (Station B) has left. It also prevents infinite loops in the model. Finally, a sub-model of Intersections was defined with a single module, Intersection B1 (Decide), in charge of querying if the next station is on the bus route -if so, the bus takes this option; otherwise, it is directed to the other station. This sub-model serves both passengers and buses as they act in the same way.
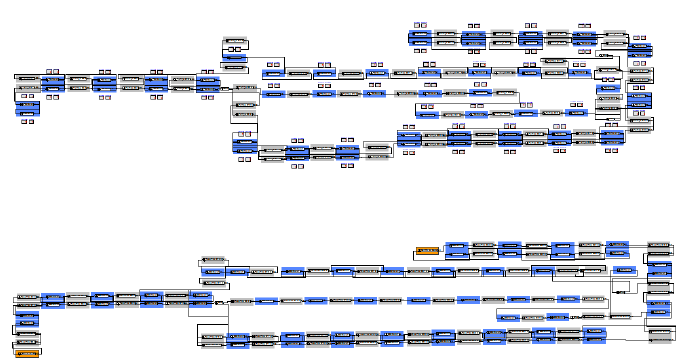
Next, Fig. 5 presents the complete model of the Megabus MPTS performed in ARENA®. The model occupies almost all the ARENA® canvas and it is difficult to appreciate well in a half-page image. It has therefore been left available for download at http://www.unicauca.edu.co/~ccobos/ModeLab/Megabus56.doe. At the top, it is organized according to the movement of passengers; in the lower part, regarding the movement of buses. The orange sub-models represent bus depots, the blue ones represent the stations, and the grey ones represent the journeys between stations. The intersections were not bordered by any color. Given that the double stations were divided into two single stations and that it was necessary to separate the behaviors of buses and passengers to gain readability in the model, in total 112 stations were created with their respective routes.
IV. MODEL OF MEGABUS IN MODELAB
ModeLab is a specialized Web tool for the construction of MPTS simulation models; it seeks to reduce the complexity in the preparation of this type of models when using the existing tools and reduce the high licensing costs of such tools. Fig. 6 shows the ModeLab tool deployed in the Google Chrome browser with a simple model in the center, composed of 1 bus depot and 4 double stations. The graphical interface is divided into three main areas, the toolbar at the top, a left-hand panel with the elements of the model, and the modeling area (canvas). In the toolbar are the standard functions for text editing (copy, paste, undo, redo, etc.), among others.
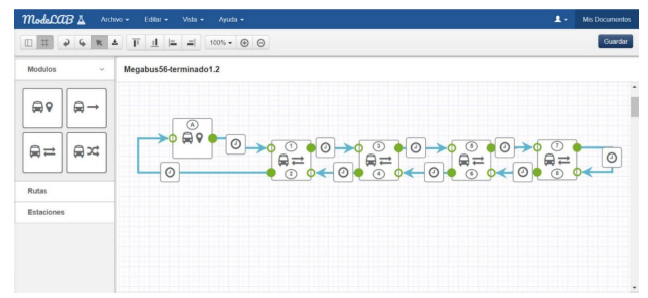
ModeLab allows the making of MPTS models by using only four modules (controls or simple objects): Bus Depot (
), Single Station (), Double Station (), and Intersections () (see left-hand side of Fig. 6). The four modules can be dragged and positioned on a canvas (modeling area), which offers all the possibilities of editing and configuration. These modules can be connected to each other (arrow symbols with a clock in the center , which connect the modules found on the canvas) and configured through modal windows or tables (both options are presented). These can be cut, copied, pasted, or deleted from the model, as well as there are options to align them, zoom them up closer or further away. Once the model or a part of it has been portrayed, the user has the option to save it to subsequently continue with the work or, if the model is complete, it can be exported to SIMAN statements that can be simulated for the analysis of the model’s results. When adding bus depots to the canvas, they are identified with letters in the icon (top), while the stations (single and double) are identified with numbers. In both cases, letters and numbers must be unique.


For the configuration of the modules, modal windows and tables were defined. In the modal windows, the forms were defined for the entry of the values of the attributes for each module. Tables like them were developed, featuring copy, paste, undo, and redo functionalities, which also allow validation, classification, and data grouping. These tables support the inclusion of formulas in columns, rows, or cells. These types of tables were also used for configuration of vector and data modules (routes, probability of destinations, short routes) allowing copying data from other formats (txt, xls, doc) directly on tables, which constitutes a very important aspect for the tool since, for example, the short route matrix is generated from an external algorithm or manually in a text file with all possible short routes. Depending on the number of stations, this matrix can become very extensive (NxN), and passing this data to the one-in-one tool can become an exhausting task.
Table 1 below describes the main functionalities of the tool. All functionalities generate records of changes in the canvas (work area) to be able to support the undo/redo operations.
Table 1 Main functionalities of ModeLab
| Functionality | Description |
|---|---|
| Create Element | The user can create an item by clicking on the element and dragging it to the canvas. |
| Move Node | Any element can be moved on the canvas. |
| Create Connections | The elements are interconnected through lines (which represent roads) and can be configured. |
| Delete Connections | The user can unlink the connection of one element to another. |
| Select Element(s) | The user can select any item by clicking on it, or several elements by holding down the left mouse button which draws a box. The selected elements change color. |
| Key Capture | It was necessary to implement the key capture and its combinations such as CRTL+Z, CRTL+Y, CRTL+C, etc. to model the commands, which in turn can trigger actions. |
| Delete Elements(s) | If an element or elements are selected, the user can delete them, which erases the element and its connections to the others. |
| Create a Project | At any time, the user can create a new document, which in turn creates a new canvas, returning the variables to an initial state. |
| Save Project | Exports a file in JSON format which is downloaded automatically, all the configuration information, connections, and position of the elements is saved. |
| Load Project | If you have previously exported a project, you can load the JSON file, which loads the configuration of the elements, connections, and positions. |
| Copy Element(s) | If the elements are selected, you can create a copy of them through the keys (CTRL) or toolbar, the position and connections between the copied elements are copied. |
| Paste Element(s) | If elements have been previously copied, the paste action draws a picture indicating the place where the new elements will be positioned on the canvas. |
| Cut Element (s) | If elements have been previously selected, this action deletes connections with the other elements but maintains the position and connections of the elements that are being cut. |
| Align Element(s) | If several elements are selected, these can be aligned to the left, right, up, or down. |
| Zoom | Allows to zoom out or approach the canvas by using the mouse scroll wheel or the toolbar. |
| Drag & Drop | The action of being able to drag the items found in the left bar to the modeling area (canvas). |
| Save Information | Through emerging modal windows, it is possible to store data on the items and maintain synchronized information with the tables. |
Each of the elements of the model has attributes that must be configured by the user. By way of example,
Table 2 shows the attributes for a single station, which is responsible for simulating the creation of passengers, as well as the time taken by passengers to board a bus. Double stations share the same attributes as single stations for the former can be modeled as the union of two single stations with opposite directions.
Table 2 Attributes to be configured for the Stations.
| Attribute | Description |
|---|---|
| Station ID | Unique identifier for the station. It must be an integer. |
| Number of Passengers | Total number of passengers arriving at the station when the simulation is running. |
| Start time | Instant at the time of simulation from which passenger type entities are created in the simulation. |
| Arrival Interval | Simulates the time that takes place for a new passenger to arrive at the station. This can be a number (fixed intervals) or a function. |
| Passengers by arrival | Number of passenger entities that are created in each arrival interval. |
| Average loading | Average time that takes users from the station to board a bus. |
| Standard deviation of loading | Standard deviation of the loading average. |
For the construction of ModeLab, several patterns were used: for example, the Model-View-Presenter architectural pattern (MVP) and the observer design pattern, in addition to the concept of a Single-Page Application (SPA). Based on SPA, the entire application runs on a single web page by achieving a user experience closest to a desktop application. To ensure that the application was SPA, at the technical level, it was required to suitably combining HTML, JavaScript (jsPlumb, Bootstrap, Handsometable, RuleJS libraries, among others), and CSS. The diagram of classes includes 52 classes with a total of 227 attributes, 165 operations, 70 associations, and 25 generalizations. The implementation has 8,000 lines of code.
As regards persistence, the models are stored in a JSON file. The entity/relationship representation of persistence includes information from Bus depots, Stations, Intersections, Travel times, and a set of related entities to be able to make the mapping according to the concepts of SIMAN, which allows the generation of the scripts of the model (.MOD) and the configuration of the experiment (.EXP).
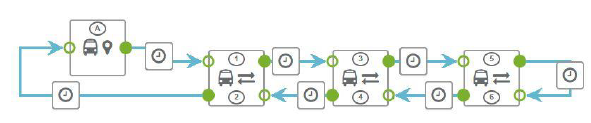
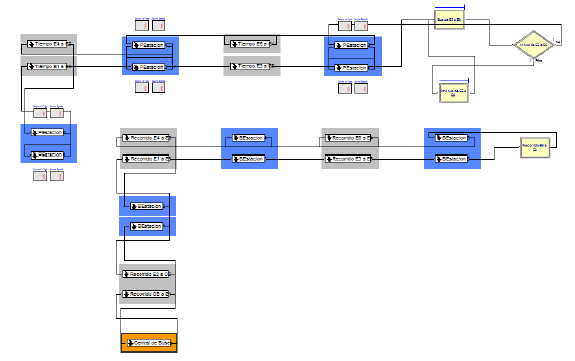
To be able to compare the level of reduction of complexity of the models and ensure that simulation results with SIMAN were equal, a model was developed of a simple system with 6 stations (3 double stations) and 1 bus depot. Fig. 7 shows the model in the ModeLab tool, linearly represented in a very short space and easy to understand. Meanwhile, Fig. 8 shows the same system modeled with ARENA®. It can be seen at first glance that the second model is more complex and difficult to understand. The results of the simulator for the two models were identical.
Concerning the Megabus MPTS , the result of the ModeLab model is presented in Fig. 9 and can be downloaded from http://www.unicauca.edu.co/~ccobos/ModeLab/Megabus56.json. It can be appreciated that it is a more complex model but much less complex than the one presented in Fig. 5 and developed with ARENA®. With ModeLab, it is not necessary to create sub-models nor is it necessary to divide the model’s logic into bus stations and passenger stations to improve readability.

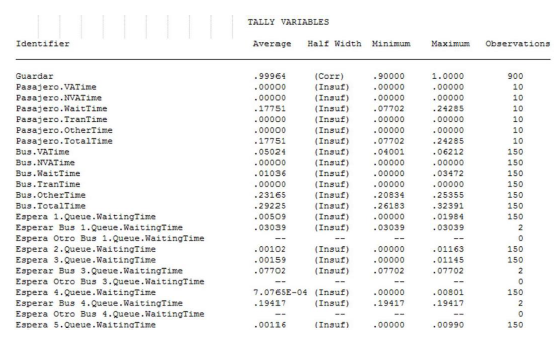
Fig. 10 shows the result of the simulation with SIMAN. The results allow us to evaluate the model’s behavior; in both cases (ModeLab and ARENA®), the results are identical when using the same model and the same parameters. The SIMAN scripts generated by ModeLab have 7,613 and 1,702 lines of code for the model (.MOD) and the configuration of the experiment (.EXP), respectively. To run the simulation, the SIMAN is required. The two files must be compiled. The compiled files are then linked, and finally, the result of the link with the main executable of SIMAN is executed. The results show, among others, the total travel and waiting time of passengers during the time simulated, the total travel and queue waiting time of the buses, and the queue waiting time for each of the buses.
V. DISCUSSION AND CONCLUSIONS
With the development of this work, the modeling and implementation of a Web tool (ModeLab) were achieved, which allows the construction of MPTS models more naturally and intuitively compared to other modeling and simulation tools on the market. Specifically, it is easier to make MPTS models this way than with ARENA®. Moreover, ModeLab also makes it possible to export the model to SIMAN scripts, which can be executed and thus obtain the results of their simulation.
As future work, the research group expects to refine the Megabus model since the passenger arrival parameters, the destination of the parameters, and others must be calibrated or adjusted to various periods of the day. In addition, it is expected to include in ModeLab some functionalities that allow the management and storage of different simulation models in a centralized repository and to include the simulation of the model in the same application.

