


 Inglês (pdf)
 Artigo em XML
 Referências do artigo
 Enviar este artigo por email
 Citado por SciELO
  Citado por Google
  Similares em
SciELO
Similares em
SciELO  Similares em Google
 Permalink
I. INTRODUCTION
Road safety is a major concern around the world. According to the World Health Organization (2018), more than 1.35 million deaths each year are caused by traffic accidents [1]. Speed is one of the most critical accident risk factors and is being used to evaluate the performance of the geometric design of roads since it has a close relationship with road safety [2]-[4].
The human factor and speed are directly related to accidents [5]. When analyzing the process by which the models and the scales for assessing the geometric design consistency are being developed [6], it was identified: i) that the human factor was not considered in the selection of the analyzed speed and, ii) neither was the variation that speed has in the geometric elements and among them. As a result, and in response to one of the pillars of the Global Plan for the 2011-2020 decade of the United Nations Road Safety [7], which commits to studying the speed relationships of road design and operation, these roads have a geometric design defined by a series of parameters that at the same time depend on a preset designed speed [8].
One of the ways to involve speed variation along geometric elements is to use a speed profile instead of a single weighted datum. However, several drawbacks have been reported in the speed profile classification, which is directly related to the driver’s behavior; (i) ) it is difficult to accurately distinguish the boundaries of speed profiles for different driving styles [9] and (ii) a manual selection of speed profile conglomerates generates more consistent results [10]. On the other hand, a relationship between the real velocity profile of the curve to free flow and the level of risk involved has been found [11], as well as the behavior of drivers in it [12].
The main research topic using the driver simulation approach is the performance of road users in horizontal curves [13]. These curves are measurements of speed control for drivers [14]. Driver age and experience are influencing variables in runoff crashes along two-lane rural horizontal curves [15], they usually overestimate time and underestimate their speed on Horizontal Curves in rural environments [16]. Notably, the perceptual speed may be lower than the actual speed due to a monotonous environment; however, the perception improves as the user advances past the midpoint of the curve [17]. There is high variability in speed behavior at the curve’s start, and deceleration stops about 135 meters after entering the curve [18]. Also, earlier deceleration before entering the curve turns into a higher safety maneuver [19]. In this direction, personalized aggressive behavior studies should be preferred over entire sets of drivers data analysis [20]-[21].
In this article, we study the variations in speed within the elements of horizontal curves on rural two-lane roads and their ability to discern a particular driving style that the geometric characteristics of the curve may influence. On this type of road, aggressive behavior (seen as a vehicle’s speed close to or above the speed limit) is usually related to confidence in the driver’s perception of a low volume of vehicles. To define the driving methods of the users and separate the records of the different vehicles according to the most suitable style, a methodology based on cluster analysis and indirect variables or derived from the data measured in the field was used. In the first part, the methodological details are presented together with the description of the area and study data. Subsequently, the results and their discussion are presented by integrating the validation of the proposed methodology. Finally, the most relevant conclusions of the methodological proposal are summarized.
II. METHODOLOGY
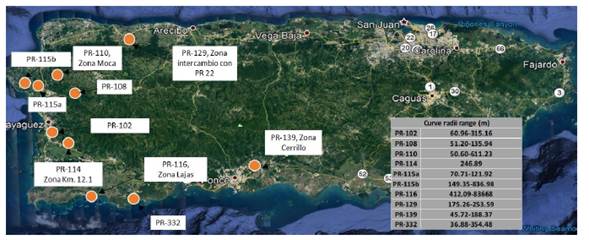
This analysis reviewed 38 horizontal curves in both directions of ten roadway segments on rural two-lane roads in Puerto Rico that allow free-flow speed conditions (Figure 1). These curves exhibit a variety of horizontal and vertical alignments, geometric element sizes, and operational conditions. The data was collected between May and September (mainly the summer season).
The data was collected using a MetroCount 5600 device that was installed in the roadway; this equipment records data with a confidence level of 95% [23]. The induced wheel pressure of vehicles was measured with two sensors (tube hoses) perpendicular to the track axis and separated at a constant distance. The required sample sizing was calculated to determine the true standard deviations, and outliers were cleaned using the Boxplot technique with lower and upper limits [8].
A total of 24,250 sample vehicles were observed in free-flow speed conditions in the data (count all 38 curves after data depuration). The speed pick-up sample points on the roadway and curve segments are presented in Figure 2. When the user traveled a curve, the speed was recorded at five points of interest: the tangential entry (T1, 200 m before the start of the curve), the beginning of the curve (PC), the middle of the curve (MC), the beginning of the tangential departure (PT), and the tangential departure (T2, 200 m from the start of the tangential departure). Additional data information can be found elsewhere [8].
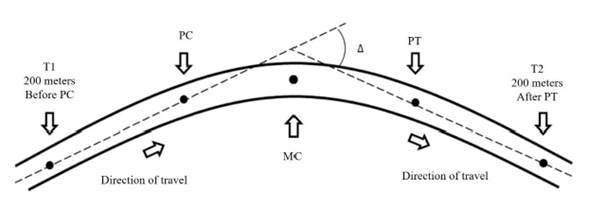
Table 1 demonstrates that the geometric curve parameters and speed records are over-dispersed (i.e. the variance is higher than the average), as expected in real data used on traffic analysis (e.g. [24], [25]) and the first approximation of information analysis involves data reduction or pooling arrangements using preliminary patterns or trends.
Table 1 Statistics of the horizontal-curve data set
| Variable | Min. | Max. | Average | Variance |
|---|---|---|---|---|
| AADT* | 1491 | 20770 | 7071 | 26921268 |
| r (m)* | 36.9 | 1246.9 | 258.5 | 226064.2 |
| L (km)* | 64.5 | 729.3 | 248.1 | 106497.5 |
| Pend (%) * | -10.7 | 10.7 | ± 4.76 | ± 12.39 |
| VDIS (km/h) * | 32.2 | 185.1 | 77.1 | 810.2 |
| V85 (km/h) * | 42.9 | 97.1 | 68.0 | 102.4 |
| VT1 (km/h) ** | 20.2 | 125.6 | 62.4 | 94.7 |
| VPC (km/h) ** | 28.8 | 129.6 | 60.8 | 99.1 |
| VMC (km/h) ** | 26.7 | 125.4 | 60.3 | 118.5 |
| VPT (km/h) ** | 23.1 | 125.3 | 60.8 | 115.9 |
| VT2 (km/h) ** | 16.0 | 119.6 | 61.4 | 85.6 |
Notes: AADT: Average daily annual transit r: curvature radii; L: Length of curve; Slope: avg. superelevation; VDIS: Curve design speed; VXX: Measured speed at point xx *sample 38 curves; **sample 24250 spot speed.
A cluster analysis approach was used for data disaggregation and classification of driver behavior. First, the number of speed profiles (i.e. optimal number of clusters, k) was studied using Elbow, Average silhouette, GAP statistic and NbClust methods [26]. Also, the data normalization was carried out to ensure variables with zero mean and unit standard deviation [27]. Thus an equal weight is guaranteed at different points of the curve.
Once the optimal number of clusters is defined, the k-means classification technique was used to generate the clusters (step 2) using the appropriate number of clusters established in Step 1. This research evaluates three clustering strategies to validate their ability to define the limits of speed profiles for different driving styles [11]. The first one uses only the speed data measured at the curve analysis points (i.e. T1, PC, MC, PT and T2). The second strategy is based on two variables derived from the speed data only: (1) the portion of the time when the driver speed is over 80% of the speed limit (η) and (2) the standard deviation of positive acceleration (a s + ). These variables allow for unique value indicators for each registered vehicle instead of a series of speed values (as in the speed profile) and have made it possible to more accurately distinguish the limits of the speed profiles for different driving styles [11]. The third strategy employs both the velocity data and the two variables inferred from the velocities and characteristics of the curve.
For the calculation of the fraction of the time in which the driver’s speed is greater than 80% of the speed limit (η), the following steps are followed for each speed profile: (1) the distance at which each point of the curve is located according to its geometry is computed, (2) with the recorded speed the travel time between two consecutive measurement points is calculated and, (3) the times when the driver’s speed is higher than 80% of the speed limit are added and divided into the total travel time between the starting and ending points of the study. On the other hand, the standard deviation of the positive acceleration only (a s + ) is estimated by calculating the differences in speeds between consecutive points, with the travel time between these points, the acceleration is computed and, finally, the standard deviation of the positive acceleration values found during the vehicle’s journey is valued. In Table 2, it can be seen the type scheme of a speed profile used for the study with the additional variables.
Table 2 Type speed profile with additional variables.
| T1 (km/h) | PC (km/h) | MC (km/h) | PT (km/h) | T2 (km/h) | η (sg) | as + (m/s2) |
|---|---|---|---|---|---|---|
| 55.89 | 49.10 | 50.29 | 50.90 | 47.51 | 1.00 | 0.0303 |
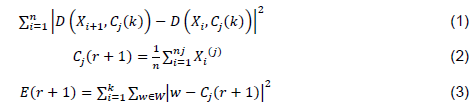
The k-means method is used to separate the data into clusters. The steps in this method are as follows [28]): (1) The desired number of groupings is used, which corresponds to the results of previous analysis (initially, the position of each element X in space is randomized); (2) by calculating the distance at the assigned random position, the elements are grouped by similar distance to the center of the cluster and minimalizing the sum of these distances (i.e., Eq. 1); (3) after the first clustering step, Eq. 2 is used to carry out a new calculation for the cluster center; and (4) Eq. 3 expresses the cluster analysis’ general calculation. Iteration between Eqs. 2 and 3 will allow the data to be allocated to each of the defined groups.
This process assigns a value (1, 2, 3) to each speed profile analyzed, which indicates the grouping to which it has been assigned.
For the assessment and validation of the identification scheme and segregation of driving styles, a comparison between the most representative variables of the curve’s geometry (operability of the curve) and the proportion of the cases that present a particular driving style according to the results of the proposed methodology is presented.
III. RESULTS
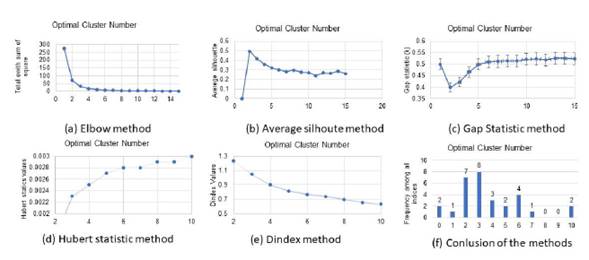
The analysis results of the optimal number of clusters are presented in Figure 3. Figure 3 (a) shows how the k-means method evaluates clustering for the various number of clusters. The change in slope or the formation of an elbow is used as a criterion to determine the correct cluster number in this case. Specifically, k values between 2 and 4 are suitable for cluster analysis engaged in the k-means method. In addition, a histogram of the optimal k value (Figure 3 (f)) summarizes the results of all the 30 approaches used in the NbClust method. It is seen that k values are found to be between 1 and 10, and the most frequent cluster numbers results are 2 and 3. Therefore, the results are a possible range of cluster numbers that can be used to choose a good one. Based on the frequency of these values, a k value of three (3) was selected for this research. This number of clusters falls within the acceptable range for applying the k-means method, which is used in the following analyses. Furthermore, three speed profiles provide a unified representation to classify the driving styles based on a membership (named cautious “c” or moderate “b” or aggressive “a” behavior [11].
The results of the second part of the proposed scheme (i.e. clustering of vehicles speed profiles) for only speed records, only η and as+ parameters and, speed records with both additional parameters are presented in Figures 4 to 7. Figure 4 shows a clear tendency to separate the three fundamental driving styles when using any of the proposed data inputs. When speed data is used at each point in the analysis, a more significant distinction in speed behavior at points T1 and T2 is possible (see Figure 4, left and right plots)
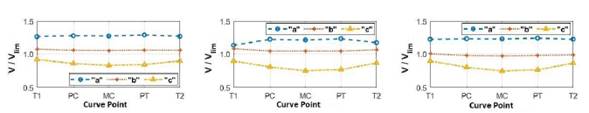
Fig. 4 Identified cluster speed profiles centers using different parameters, left to right: only speed records, only η and as+ parameters and, speed with both additional parameters.
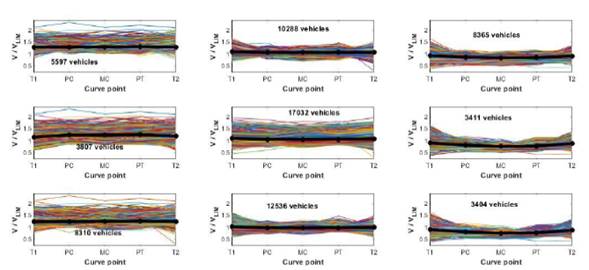
Fig. 5 Grouped speed profiles in cluster analysis using different parameters and cluster center (thick black line), left to right: aggressive “a”, moderate “b” and cautious “c” driver styles. Top to bottom: only speed records, only η and as+ parameters and speed with both additional parameters.
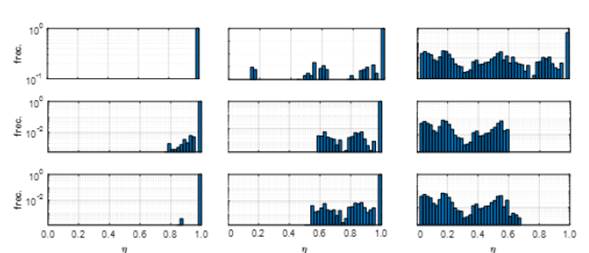
Fig. 6 Histogram for classificatory parameter η. Left to right: aggressive “a”, moderate “b” and cautious “c” driver styles. Top to bottom: only speed records, only η and as+ parameters and speed with both additional parameters.
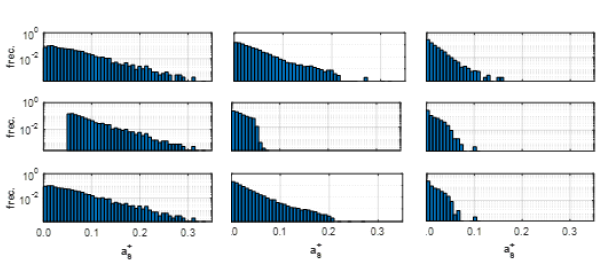
Fig. 7 Histogram for classificatory parameter as+. Left to right: aggressive “a”, moderate “b” and cautious “c” driver styles. Top to bottom: only speed records, only η and as+ parameters and, speed with both additional parameters.
Figure 5 illustrates that the more aggressive the driver is, the more dispersion in the speed values at each of the measurement seed points of the profiles is observed. It has also been established that most drivers have a moderate driving style, which can be identified using the two additional indicators or in combination with speed data (middle and lower plots in Figure 5). However, the speed at the measurement points should be considered to produce the best delimitation of speed profiles or reduce dispersion in its classification (as seen in top and bottom plots in Figure 5).
Figure 6 shows that the cluster separation classification based on the time spent travelling the curve above 80% of the limit speed (η) only matches with the aggressiveness degree when the indicators of driver behavior are used. These graphs show that by using the speed data together with the two variables inferred in the cluster analysis (lower figures), it is possible to distinguish more clearly the level of aggressiveness of the driver as seen from the time during which he/she remains close to or above the speed limit of the curve.
Figure 7 shows that the more aggressive the driver is, the more dispersion in the positive acceleration, reaching the highest values of this indicator (i.e. close to 0.35). In conclusion, from Figures 6 and 7, it is determined that the parameter η allows to limit the change in the three identified driving behaviors clearly, while as+ is a transition parameter that can be interpreted according to its slope and range of values it covers.
IV. DISCUSSION
The agreement between speed profiles classification of cluster analysis and the expected driver behavior under operational conditions of the curve (8 variables) for the identified driving styles is presented in this section for validation purposes. This analysis is performed based on speed profiles classified by cluster analysis in speed with both additional parameters (i.e. η and as+). Figure 8 depicts the identified driving styles contribution (in percentage) for each curve.
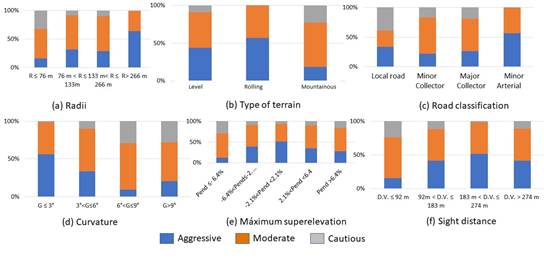
Figure 8 (a) shows that as the curvature radii increase, users gain confidence and shift to aggressive behavior (where a variable increases, a reduction of acceleration is expected). Curves with small radii account for roughly 83% of its more cautious users, attributed to a stronger perception of danger (tendency to reduce speed before starting the curve length). Curves with radii ranging from 0 meters to 133 meters will have predominantly cautious and moderate users in their driving styles, with aggressive driving styles accounting for less than 32% of the total (i.e. the highest road safety condition).
Figure 8 (b) shows how rolling terrain is much more susceptible to aggressive driver behavior, affecting safety and implying that this type of terrain should be designed with special care in terms of road safety. Considering Figures 8 (b-c), it is observed that the increased aggressiveness of rolling terrain users is consistent with road classification in this type of terrain (i.e. these are minor arteries).
The curvature (related with the inverse of curvature radii) allows to identify aggressive driver behavior as it is less than 3° (Figure 8(d)), it may be used for quantification of road safety and defining the geometric design of the curve. When the curve superelevation is higher, the drivers exhibit a more cautious behavior (Figure 8(e)). It should be noted that during the measurement on the ground of this parameter, errors were found in the slope that the constructed curve should have since drivers tend to behave more aggressively when the slope of the curve is less than ±2%. The sight distance defines other distances such as stopping, passing sight and complex maneuver situations; these are used to design the vertical and horizontal alinement elements [10]. Figure 8 (f) shows that when this distance exceeds 92 m, the drivers’ behavior becomes more aggressive (above 40%). In general, the classification of the proposed cluster analysis approaches by three speed profiles matches the expected behavior trend governed by the geometry and operational condition of the curve.
V. CONCLUSIONS
The results show that a total of three (3) conglomerates are adequate to separate correctly the speed profiles observed on rural two-lane roads. It is possible to identify these predominant patterns in the driving style more clearly (i.e. more similar speed profiles are classified in the same group) by including two variables derived from the speed values along the curve within the analysis of conglomerates. The frequency graphs of the indicators η and as+ show a stricter limit when used with speed data at each point combined with indicators η and as+ inside the analysis than when used with only speed or only indicators data. The dominance of the average behavior of the driver (called moderate “b”), which accounts for 51.7% of the users analyzed, indicates stability from a statistical point of view in the cluster method.
Despite the advantages of these results, it is necessary to investigate different sets of data, such as those grouped by several geometric and operational variables. In this sense, the sensitivity of the proposed speed profile classification scheme can be evaluated by analyzing an extensive database obtained in studies of driving simulators with gradual and controlled changes in the design of the curves.

